. 2023;16(1):83-105.
doi: 10.1016/j.jcmgh.2023.03.008. Epub 2023 Apr 1.

DR3 Regulates Intestinal Epithelial Homeostasis and Regeneration After Intestinal Barrier Injury

Affiliations

DR3 Regulates Intestinal Epithelial Homeostasis and Regeneration After Intestinal Barrier Injury

Yosuke Shimodaira et al. Cell Mol Gastroenterol Hepatol. 2023.

Abstract

Background & aims: Tumor necrosis factor (TNF) superfamily member tumor necrosis factor-like protein 1A (TL1A) has been associated with the susceptibility and severity of inflammatory bowel diseases. However, the function of the tumor necrosis factor-like protein 1A and its receptor death receptor 3 (DR3) in the development of intestinal inflammation is incompletely understood. We investigated the role of DR3 expressed by intestinal epithelial cells (IECs) during intestinal homeostasis, tissue injury, and regeneration.

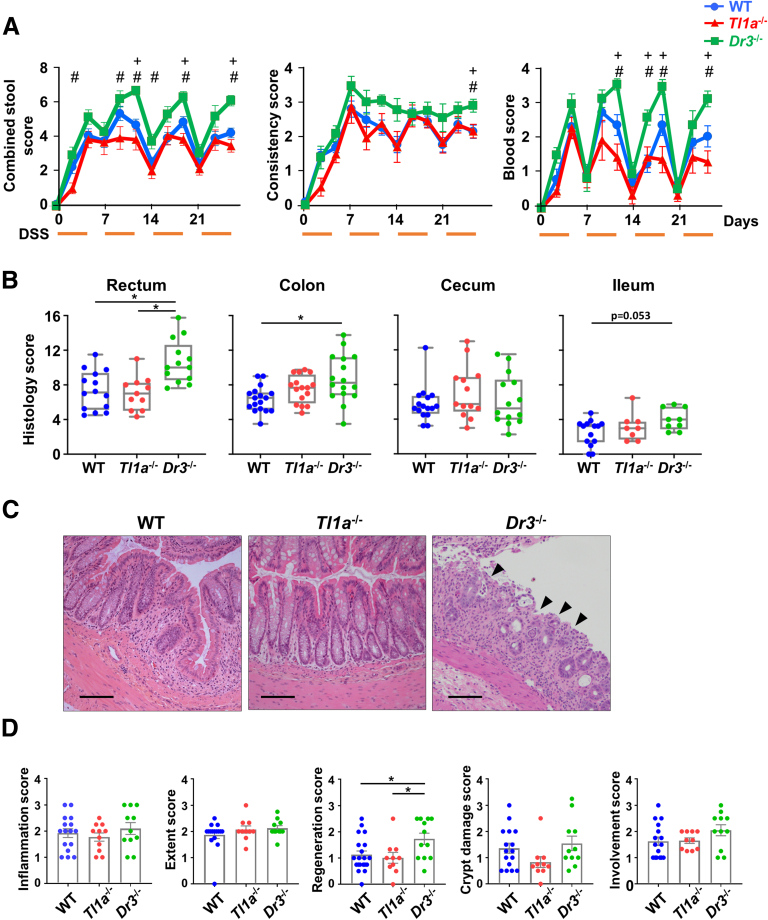
Methods: Clinical phenotype and histologic inflammation were assessed in C57BL/6 (wild-type), Tl1a-/- and Dr3-/- mice in dextran sulfate sodium (DSS)-induced colitis. We generated mice with an IEC-specific deletion of DR3 (Dr3ΔIEC) and assessed intestinal inflammation and epithelial barrier repair. In vivo intestinal permeability was assessed by fluorescein isothiocyanate dextran uptake. Proliferation of IECs was analyzed by bromodeoxyuridine incorporation. Expression of DR3 messenger RNA was assessed by fluorescent in situ hybridization. Small intestinal organoids were used to determine ex vivo regenerative potential.

Results: Dr3-/- mice developed more severe colonic inflammation than wild-type mice in DSS-induced colitis with significantly impaired IEC regeneration. Homeostatic proliferation of IECs was increased in Dr3-/- mice, but blunted during regeneration. Cellular localization and expression of the tight junction proteins Claudin-1 and zonula occludens-1 were altered, leading to increased homeostatic intestinal permeability. Dr3ΔIEC mice recapitulated the phenotype observed in Dr3-/- mice with increased intestinal permeability and IEC proliferation under homeostatic conditions and impaired tissue repair and increased bacterial translocation during DSS-induced colitis. Impaired regenerative potential and altered zonula occludens-1 localization also were observed in Dr3ΔIEC enteroids.

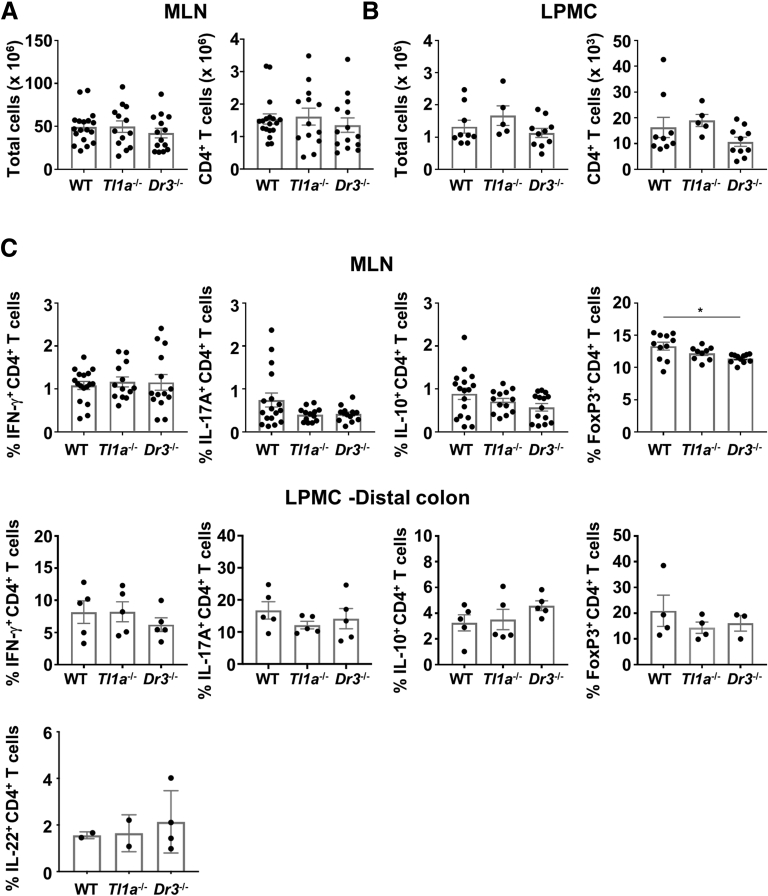
Conclusions: Our findings establish a novel function of DR3 in IEC homeostasis and postinjury regeneration independent of its established role in innate lymphoid cells and T-helper cells.

Keywords: Epithelial Barrier; IEC Proliferation; Intestinal Permeability; Tissue Regeneration.


Figures

None
Graphical abstract
Figure 1
Figure 1
DR3 deficiency exacerbates DSS-induced chronic colitis. WT, Tl1a-/-, and Dr3-/- mice underwent 4 cycles of 2.5% DSS to induce chronic colitis. (A) Combined stool scores (left; stool consistency plus blood in stool), consistency score (middle; 0, firm dry stool; 1, moist stool; 2, soft adherent stool; 3, large soft pliable stool; and 4, liquid stool), and blood score (right; 0, no color; 1, flecks of blue; 2, up to 50% blue; 3, >50% blue; and 4, gross red blood) during DSS-induced chronic colitis (N = 14–18/genotype). +P < .05 for comparison between WT and Dr3-/-, #P < .05 for comparison between Tl1a-/- and Dr3-/-. (B) Histology scores. Data are presented as median with interquartile range. (C) Representative H&E staining of rectum. Scale bar: 100 μm. Black arrowheads indicate impaired regeneration of epithelial layer and ulcerations. (D) Histologic subscores for rectum. Each dot represents an individual mouse. Means ± SEM are shown. ∗P < .05.
Figure 2
Figure 2
TH1, TH17, and ILC3 responses are not altered in Tl1a-/-or Dr3-/-mice during chronic DSS colitis. Cells were isolated from (A) MLNs and (B) LPMCs and the total number of cells and CD4+ T cells was counted. (B and C) Isolated cells were incubated with phorbol 12-myristate 13-acetate and ionomycin for 4 hours. (C) Frequency of IFN-gamma, IL17A, IL10, IL22, and FoxP3-positive cells in MLNs (top) and LPMCs isolated from the distal colon (bottom) were assessed by intracellular staining using flow cytometry. Each dot represents an individual mouse. Means ± SEM are shown. ∗P < .05.
Figure 3
Figure 3
DR3 deficiency increases intestinal permeability. (A) WT, Tl1a-/-, and Dr3-/- mice underwent 4 cycles of 2.5% DSS. On the day they were killed, mice were gavaged with FITC-dextran. The FITC-dextran serum concentration was measured 1 hour postgavage. (B) Untreated mice were gavaged with FITC-dextran. FITC-dextran serum concentrations are shown. Data are shown as median with interquartile range. Each dot represents an individual mouse. Data are from 3 independent experiments. ∗P < .05.
Figure 4
Figure 4
Dr3-/-mice have increased homeostatic IEC proliferation. (A) Ileal villi of WT (left) and Dr3-/- (right) mice were analyzed for Dr3 expression by sm-FISH. Dr3 (yellow), 4’,6-diamidino-2-phenylindole (DAPI) (blue), and E-cadherin (cyan). Arrows indicate Dr3-expressing cells. Scale bar: 20 μm. (B) Colonic crypts of WT mice were analyzed for Dr3 expression by sm-FISH. Dr3 (red), DAPI (blue), and E-cadherin (green). Arrows indicate Dr3-expressing cells. (C–E) Dr3 expression in human ileal and colonic tissue. (C) Healthy human ileal tissue. Dr3 (red), DAPI (blue), and E-cadherin (yellow). (D) Noninflamed (left) and inflamed (right) ileal tissue from a CD patient. White arrows indicate Dr3 expression in IECs and yellowarrowheads indicate Dr3 expression in LP cells. Scale bar: 25 mm. (E) Colonic tissue from a patient with diverticulitis. Dr3 (red), DAPI (blue), and E-cadherin (green). White arrows indicate Dr3 expression in IECs. Scale bar: 25 μm. (F) Villi length of small intestine and (G) crypt length of large intestines are shown (N = 6–7 mice/genotype). (H and I) WT, Tl1a-/-, and Dr3-/- mice were injected intraperitoneally with BrdU 2.5 hours before being killed. (H) Representative ileal and colonic BrdU staining (red) co-stained with DAPI (green). Scale bar: 50 μm. (I) Quantification of BrdU+ cells in tissue sections. BrdU+ cells were counted in 20 well-oriented crypt–villi axis. Each dot represents the average of BrdU+ cells/crypt–villi axis of an individual mouse. (J) Dr3-/- mice were treated with or without broad-spectrum antibiotics for 4 weeks. Quantification of BrdU+ cells in tissue sections. BrdU+ cells were counted in 20 well-oriented crypt–villi axis. Each dot represents the average of BrdU+ cells/crypt–villi axis of an individual mouse. Means ± SEM are shown. ∗P < .05. ABX, antibiotics; Duod, duodenum; E-cad, E-cadherin; Jejun, jejunum.
Figure 5
Figure 5
DR3 regulates the expression and subcellular localization of tight junction proteins ZO-1 and claudin-1. (A) Representative ileal images of immunofluorescence of ZO-1 (gray), claudin-1 (red), claudin-2 (yellow), occludin (green), and DAPI (blue) staining in WT (top), Tl1a-/- (middle), and Dr3-/- (bottom) mice. White arrowheads indicate discontinued ZO-1 staining at the apical side of the IEC layer. Yellow arrowheads indicate normal claudin-1 staining at tight junctions in WT and Tl1a-/- mice, but diminished claudin-1 staining at tight junctions in Dr3-/- mice. Scale bar: 20 μm. (B) Relative mRNA expression of claudin-1, -2, -3, -4, and -15, and Mlck in colonic epithelial cells was assessed by quantitative polymerase chain reaction (N = 5/genotype). (C) Protein expression in ileal epithelial cells was assessed by Western blot. Relative expression of claudin-1 and claudin-2 are shown (left; N = 4/genotype). Representative images of Western blots (right). Means ± SEM, ∗P < .05, Student t test. GAPDH, glyceraldehyde-3-phosphate dehydrogenase; Rel, relative.
Figure 6
Figure 6
DR3 deficiency impairs tissue regeneration in DSS-induced epithelial damage. WT, Tl1a-/-, and Dr3-/- mice were treated with 3% DSS for 5 days and regeneration was analyzed 2 or 3 days after DSS treatment. (A) Combined stool scores (left), consistency score (middle), and blood score (right) at the indicated time points (N = 6/genotype). ∗P < .05 for comparison between Tl1a-/- and Dr3-/-. (B) Representative H&E staining of WT and Dr3-/- rectal tissue (top), histology score (bottom left), and regeneration score (bottom right) are shown. Black arrows indicate regenerating epithelial layer, and black arrowheads indicate ulcerations. Each dot represents an individual mouse. Scale bar: 100 μm. (C) Representative macroscopic images of spleens (top) and splenocyte numbers (bottom) from 2 independent experiments. (N = 4/genotype). (D–G) WT, Tl1a-/-, and Dr3-/- mice were treated with 3% DSS for 3 days to induce acute colitis. (D) Cells were isolated from LP and the total number of cells (left) and CD4+ T cells (right) were counted. (E) Enzyme-linked immunosorbent assay analysis of IFN-gamma, IL17A, and IL22 production from LPMCs after ex vivo restimulation with anti-CD3 and anti-CD28. (F) Frequency of IL22-positive cells in LPMCs isolated from the large intestine were assessed by intracellular staining using flow cytometry. (G) Total numbers of IL22-positive RORγt+ ILC3s in LPMCs isolated from the large intestine. Each dot represents an individual mouse. Means ± SEM are shown. ∗P < .05.
Figure 7
Figure 7
DR3 deficiency impairs IEC proliferation in DSS-induced epithelial damage. WT, Tl1a-/-, and Dr3-/- mice were treated with 3% DSS for 5 days and regular drinking water for 2 days. Mice were injected intraperitoneally with BrdU 2.5 or 24 hours before being killed. (A) Representative colonic BrdU staining (red) co-stained with DAPI (green). Scale bar: 50 μm. (B) Quantification of BrdU+ cells in colonic tissue sections. BrdU+ cells were counted in 20 well-oriented crypts. Each dot represents the average BrdU+ cells/crypt axis of an individual mouse. (C) Quantification of BrdU+ cells in ileal (top) and colon (bottom) tissue sections. BrdU+ cells were counted in 20 well-oriented crypts. Each symbol represents the average of BrdU+ cells/crypt–villus axis of an individual mouse. Means ± SEM are shown. ∗P < .05.
Figure 8
Figure 8
DR3 but not TL1A deficiency results in impaired enteroid formation. (A) Representative phase-contrast images of ileal enteroids developed from WT, Tl1a-/-, and Dr3-/- mice captured on days 1, 3, and 6. Scale bar: 100 μm. (B) Quantification of enteroid surface area (left), and crypts/enteroid (right). (C) Representative images of ZO-1 (red), Hoechst dye (blue), and E-cadherin (green) immunofluorescence staining in WT, Tl1a-/-, and Dr3-/- enteroids (left), and quantification of ZO-1 fluorescence intensity. Scale bar: 20 μm. At least 28 enteroids/genotype were analyzed. (D) mRNA expression of Tnfsf15 and Tnfrsf25 in spleen and enteroids was assessed by quantitative polymerase chain reaction (N = 3). (E) Quantification of enteroid surface area of WT enteroids treated with TL1A (100 ng/mL) and IL22 (0.25, 0.5, 1 ng/mL). (F) Quantification of enteroid surface area (left) and crypts/enteroid (right) of WT and Dr3-/- enteroids treated with or without IL22 (1 ng/mL). At least 13 enteroids/condition were analyzed. Three independent experiments were performed. Means ± SEM are shown. ∗P < .05, ∗∗P < .01, and ∗∗∗P < .005. E-cad, E-cadherin.
Figure 9
Figure 9
Intestinal epithelial DR3 promotes the integrity of the intestinal barrier and regulates IEC proliferation. (A) Ileal villi on Dr3ΔIEC mice were stained by sm-FISH. Dr3 (yellow), DAPI (blue), and E-cadherin (cyan). Arrows point to LP cells expressing Dr3 mRNA. Dashed line indicates the border between the IEC layer and LP. Scale bar: 20 μm. (B) Dr3fl/fl and Dr3ΔIEC mice were gavaged with FITC-dextran. The FITC-dextran serum concentration was measured 1 hour postgavage. Data are shown as median with interquartile range. Each dot represents an individual mouse. (C) Serum IgA (left), IgG (middle), and fecal IgA (right) concentrations were measured in untreated Dr3fl/fl and Dr3ΔIEC mice. (D) Representative ileal images of immunofluorescence of claudin-1 (red) and DAPI (blue) staining in Dr3fl/fl (left) and Dr3ΔIEC (right) mice. White arrowheads indicate discontinuous claudin-1 staining at the apical side of the IEC layer. Yellow arrowheads indicate basolateral claudin-1 staining. Scale bar: 20 μm. (E) Protein expression of claudin-1 was assessed by Western blot. Relative expression is shown (left; N = 11–12/genotype). Representative images of Western blot (right). (F and G) Dr3fl/fl and Dr3ΔIEC mice were injected intraperitoneally with BrdU 24 hours before being killed. (F) Representative colonic BrdU staining (red) co-stained with DAPI (green) are shown. Scalebar: 50 μm. (G) Quantification of BrdU+ cells in colonic tissue sections. BrdU+ cells were counted in 20 well-oriented crypts. Each dot represents the average BrdU+ cells/crypts of an individual mouse. (H) Untreated Dr3fl/fl and Dr3ΔIEC mice were assessed for TUNEL positivity in IECs. TUNEL+ cells per ileal crypt–villus axis (left) and TUNEL+ cells per colonic crypts (right). Means ± SEM are shown. ∗P < .05 by (E and G) Mann–Whitney U test or (B, C, and H) Student t test. GAPDH, glyceraldehyde-3-phosphate dehydrogenase; Rel, relative. ∗∗∗P < .005
Figure 10
Figure 10
TH1, TH17, and ILC3 responses were not altered in Dr3ΔIECmice. Homeostatic immune profiles of 6- to 8-week-old Dr3fl/fl and Dr3ΔIEC mice were analyzed. (A) Cells were isolated from LP and the total number of cells (left) and CD4+ T cells (right) was counted. (B) Enzyme-linked immunosorbent assay analysis of IFN-gamma, IL17A, and IL22 production from LPMCs after ex vivo restimulation with anti-CD3 and anti-CD28. (C) Frequency of IFN-gamma, IL17A, IL22, and IL10-positive cells in LPMCs isolated from the large intestine were assessed by intracellular staining using flow cytometry. (D) Total numbers of IL22-positive RORγt+ ILC3s in LPMCs isolated from the large intestine. (E) Quantification of relative abundance of SFB in fecal samples of co-housed 6- to 10-week-old Dr3fl/fl and Dr3ΔIEC mice by quantitative polymerase chain reaction (N = 15/genotype). (F) Dr3ΔIEC mice were treated with or without broad-spectrum antibiotics for 4 weeks. Quantification of BrdU+ cells in tissue sections. BrdU+ cells were counted in 20 well-oriented crypt–villi axis. Each dot represents the average of BrdU+ cells/crypt–villi axis of an individual mouse. Means ± SEM are shown. ABX, antibiotics; rRNA, ribosomal RNA.
Figure 11
Figure 11
Loss of DR3 in IECs leads to growth defects in enteroid cultures. (A) Representative phase-contrast images of ileal enteroids developed from Dr3fl/fl and Dr3ΔIEC mice captured on days 1, 3, and 6. Scale bar: 100 μm. (B–D) Enteroid-forming capacity of Dr3fl/fl and Dr3ΔIEC crypts analyzed on day 6. (B) Enteroid surface area. (C) Percentage of enteroid formation potential. (D) De novo crypt formation (budding). (E) Representative images of ZO-1 (red), Hoechst dye (blue), and E-cadherin (green) immunofluorescence staining in Dr3fl/fl (top) and Dr3ΔIEC (bottom) enteroids. White arrows indicate continuous and discontinuous ZO-1 staining on the luminal side of Dr3fl/fl and Dr3ΔIEC enteroids, respectively. Scale bars: 20 μm. Three independent experiments were performed. Means ± SEM are shown. ∗P < .05.
Figure 12
Figure 12
Intestinal epithelial DR3 promotes tissue repair after DSS-induced injury.Dr3fl/fl and Dr3ΔIEC mice were treated with 3% DSS for 5 days to induce acute colitis. (A) Combined stool scores (left), consistency score (middle), and blood score (right) during acute DSS colitis (N = 17–18/genotype). (B) Representative H&E staining of Dr3fl/fl and Dr3ΔIEC mouse rectal tissue (top). Red arrowheads indicate regenerating crypts, black arrows indicate regenerating epithelial layer, and black arrowheads indicate ulcerations. Histology score (bottom left), and regeneration score (bottom right) in rectum are shown. Each dot represents an individual mouse. Data are presented as median with interquartile range. Scale bar: 100 μm. (C) Representative macroscopic images of spleens (top) and splenocyte numbers (bottom) from 2 independent experiments are shown (N = 9–10/genotype). (D) MLN homogenates were cultured under anerobic conditions on chocolate blood agar plates. Representative images for colonies (top). Colony forming unit (CFU) was analyzed by Χ2 test (N = 5–6/genotype) (bottom). (E and F) Dr3fl/fl and Dr3ΔIEC mice were injected intraperitoneally with BrdU 24 hours before being killed. (E) Representative colonic BrdU staining (red) co-stained with DAPI (green). Scale bar: 50 μm. (F) Quantification of BrdU+ cells in colonic tissue sections. BrdU+ cells were counted in 20 well-oriented crypts. Each symbol represents the average BrdU+ cells/crypt of an individual mouse. (G) Quantification of BrdU+ cells in colonic tissue sections of water and DSS-treated mice. BrdU+ cells were counted in 20 well-oriented crypt–villi axis. Each symbol represents the average of BrdU+ cells/crypt–villi axis of an individual mouse. Means ± SEM are shown. ∗P < .05, ∗∗∗P < .005.
Figure 13
Figure 13
TH1, TH17, and ILC3 responses are not altered in Dr3ΔIECmice during acute DSS colitis.Dr3fl/fl and Dr3ΔIEC mice were treated with 3% DSS for 3 days to induce acute colitis. (A) Cells were isolated from LP and the total number of cells (left) and CD4+ T cells (right) were counted. (B) Ileal tissue explants were cultured for 24 hours and supernatants were analyzed by enzyme-linked immunosorbent assay (ELISA). Concentrations of secreted cytokines were normalized to the dry weight of the tissue sections. (C) ELISA analysis of IFN-gamma, IL17A, and IL22 production from LPMCs after ex vivo restimulation with anti-CD3 and anti-CD28. (D) Frequency of IFN-gamma, IL17A, IL22, and IL10-positive cells in LPMCs isolated from the large intestine were assessed by intracellular staining using flow cytometry. (E) Total number of IL22-positive RORγt+ ILC3s in LPMCs isolated from the large intestine. Each dot represents an individual mouse. Means ± SEM are shown. ∗P < .05.

References

    1. Maloy K.J., Powrie F. Intestinal homeostasis and its breakdown in inflammatory bowel disease. Nature. 2011;474:298–306. - PubMed
    1. Xavier R.J., Podolsky D.K. Unravelling the pathogenesis of inflammatory bowel disease. Nature. 2007;448:427–434. - PubMed
    1. Migone T.S., Zhang J., Luo X., et al. TL1A is a TNF-like ligand for DR3 and TR6/DcR3 and functions as a T cell costimulator. Immunity. 2002;16:479–492. - PubMed
    1. Papadakis K.A., Zhu D., Prehn J.L., et al. Dominant role for TL1A/DR3 pathway in IL-12 plus IL-18-induced IFN-gamma production by peripheral blood and mucosal CCR9+ T lymphocytes. J Immunol. 2005;174:4985–4990. - PubMed
    1. Prehn J.L., Thomas L.S., Landers C.J., et al. The T cell costimulator TL1A is induced by FcgammaR signaling in human monocytes and dendritic cells. J Immunol. 2007;178:4033–4038. - PubMed

Publication types

Substances