. 2023 Apr 11;10(4):ENEURO.0183-22.2023.
doi: 10.1523/ENEURO.0183-22.2023. Print 2023 Apr.

Off Starburst Amacrine Cells in the Retina Trigger Looming-Evoked Fear Responses in Mice

Affiliations

Off Starburst Amacrine Cells in the Retina Trigger Looming-Evoked Fear Responses in Mice

Jeremy M Bohl et al. eNeuro. .

Abstract

A rapidly approaching dark object evokes an evolutionarily conserved fear response in both vertebrates and invertebrates, young to old. A looming visual stimulus mimics an approaching object and triggers a similarly robust fear response in mice, resulting in freeze and flight. However, the retinal neural pathway responsible for this innate response has not been fully understood. We first explored a variety of visual stimuli that reliably induced these innate responses, and found that a looming stimulus with 2-d acclimation consistently evoked fear responses. Because the fear responses were triggered by the looming stimulus with moving edges, but not by a screen flipping from light to dark, we targeted the starburst amacrine cells (SACs), crucial neurons for retinal motion detection. We used intraocular injection of diphtheria toxin (DT) in mutant mice expressing diphtheria toxin receptors (DTR) in SACs. The looming-evoked fear responses disappeared in half of the DT-injected mice, and the other mice still exhibited the fear responses. The optomotor responses (OMRs) were reduced or eliminated, which occurred independent of the disappearance of the fear responses. A histologic examination revealed that ON SACs were reduced in both mouse groups preserved or absent fear responses. In contrast, the number of OFF SACs was different among two groups. The OFF SACs were relatively preserved in mice exhibiting continued fear responses, whereas they were ablated in mice lacking fear response to looming stimulation. These results indicate that OFF SACs and the direction-selective pathway in the retina play a role in looming-induced fear behaviors.

Keywords: fear response; flight; looming stimulus; starburst amacrine cell; vision test.


Conflict of interest statement

The authors declare no competing financial interests.

Figures

Figure 1.
Figure 1.
Visual stimuli and mouse behavior. A, Visual stimuli we tested: a, looming stimulus; b, white receding stimulus; c, flip screen stimulus; d, sweeping stimulus; e, large sweeping stimulus. B, A sample mouse track record. A mouse was placed in an arena of 400 × 500 mm with a hut for the mouse to escape from the stimulus (red circle). After 10-min acclimation, video capturing started (1), a looming stimulus started (2), and the mouse came into the shelter (3). C, Based on the mouse tracking records, the distance to the nest over the time was calculated and plotted. After normalization to the distance at the stimulus onset (time = 0 s), the distances for individual mice were plotted before and after the 1-time looming stimuli. A dark bar indicates the timing of the 1-looming stimulus. The vertical dashed line at time 0 s indicates stimulus onset. The 1.0 indicates the position when the visual stimulus started, while the location of the shelter was 0. A group of mice froze to the stimuli (14/26 mice). Each line color indicates the track of each mouse. D, The same stimulus evoked immediate flight responses to another group of mice (12/26 mice). E, 10-time receding white circle evoked freeze responses in 13/25 mice. F, Flip screen did not evoke fear responses (6 mice).
Figure 2.
Figure 2.
C57 wild-type mice exposed to the 10-looming stimulus. A, A group of mice froze before the flight response, indicated by straight lines after the stimulus (18/39 mice). B, Another group of mice exhibited immediate flight or rearing and flight responses (21/39 mice). C, A heatmap summary of mouse speed before and after 10-looming stimuli. A red dashed line indicates the onset of the looming stimulus. A high speed (light blue) at the end shows the flight response before moving into a hut. A low speed (pink) for >1 s indicates the freeze response. Tracking was ended after mice moved into the hut.
Figure 3.
Figure 3.
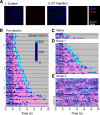
DT injection reduced the number of SACs and removed the looming-evoked fear responses. A, Using immunohistochemistry, (I) control and (II) DT-injected retinas were labeled with DAPI and ChAT-antibody. There was no difference in the density of GCL layer cells between the control and injected groups. In contrast, the SAC density showed a significant reduction. B, Speed heatmap for mouse responses to the 10-time looming stimulus before DT injection. After the looming stimuli, mice displayed a combination of flight (high speed, light blue) and freezing (low speed, pink) responses. A red line indicates the onset of looming stimulus. Asterisks (*) indicate that mice were exposed to the 2° to 9° looming stimulus. All other mice were exposed to the looming stimulus of 2° to 50°. C, Saline-injected mice showed flight responses to looming stimulus. D, Group 1 mice exhibited freeze and/or flight responses after DT injection. E, Group 2 mice did not show freeze and/or flight responses after DT injection.
Figure 4.
Figure 4.
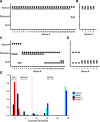
Optomotor responses (OMRs) before and after the DT injection. The black and white dots in A–D refer to one of the two eyes for each mouse. A, Before the DT injection, the OMR was measured. The average contrast sensitivity was 19.1 and the SD was 5.8. When the eye exhibited within the 2 SD, it was categorized as normal. If the sensitivity was lower than 2 SD, it was categorized as reduced. If the OMR was not recognized, it was categorized as null. Most eyes before the DT injection showed normal contrast sensitivity. B, Saline was injected into five mice, which all exhibited normal sensitivity. C, Group 1 mice exhibited reduced or null OMRs after one week of DT intravitreal injection. For those mice, the OMR sensitivity was reduced at least one of eyes. D, Group 2 mice exhibited reduced or null OMRs. These mice did not show the fear response after the DT intravitreal injection. E, A bar graph showing the distribution of the contrast sensitivities for each group. The frequency was normalized to each group and is shown as the proportion of eyes with the same contrast sensitivity value per group. The contrast sensitivity values are color coded: preinjection mice (blue), saline-injected mice (cyan), Group 1 DT-injected mice (black), and Group 2 DT-injected mice (red).
Figure 5.
Figure 5.
Immunohistochemical analysis of ON and OFF SACs after the DT injection. A, Saline-injected eyes exhibited normal densities of GCL-layer cells, and ON and OFF SACs in GCL and INL layers, respectively. The Group 1 mice showed significantly reduced ON SACs. OFF SACs were also reduced, but still remained. In contrast, ON and OFF SACs were significantly reduced in Group 2 mice. B, In Group 1 mice, the remaining OFF SACs exhibited normal dendritic structures. OFF ChAT band (side view) and dendritic network (top view) are shown. C, ON and OFF SAC density in Group 1 mice. The dotted line indicates the normal density. D, ON and OFF SAC density in Group 2 mice. The scale is same as the graph C. E, The same graph as D; however, the scale was adjusted. F, OMR and the densities of ON and OFF SACs were compared in twenty-one eyes from Group 1 mice. The red lines are mice that had normal OMR, blue lines are mice with reduced OMR, and black lines are mice with null OMR. Although ON SAC density was significantly decreased, some eyes exhibited OMR in normal and reduced ranges. The null-OMR mice exhibited the low ON SAC density. However, OFF SACs were relatively preserved (>20% of normal density).

References

    1. Adolphs R (2013) The biology of fear. Curr Biol 23:R79–R93. 10.1016/j.cub.2012.11.055 - DOI - PMC - PubMed
    1. Baden T, Berens P, Franke K, Román Rosón M, Bethge M, Euler T (2016) The functional diversity of retinal ganglion cells in the mouse. Nature 529:345–350. 10.1038/nature16468 - DOI - PMC - PubMed
    1. Bertels J, Bourguignon M, de Heering A, Chetail F, De Tiège X, Cleeremans A, Destrebecqz A (2020) Snakes elicit specific neural responses in the human infant brain. Sci Rep 10:7443. 10.1038/s41598-020-63619-y - DOI - PMC - PubMed
    1. Blanchard DC, Hynd AL, Minke KA, Minemoto T, Blanchard RJ (2001) Human defensive behaviors to threat scenarios show parallels to fear- and anxiety-related defense patterns of non-human mammals. Neurosci Biobehav Rev 25:761–770. 10.1016/S0149-7634(01)00056-2 - DOI - PubMed
    1. Cappe C, Thelen A, Romei V, Thut G, Murray MM (2012) Looming signals reveal synergistic principles of multisensory integration. J Neurosci 32:1171–1182. 10.1523/JNEUROSCI.5517-11.2012 - DOI - PMC - PubMed

Publication types

LinkOut - more resources