. 2023 Apr 3;14(1):1850.
doi: 10.1038/s41467-023-37522-9.

The Trypanosoma cruzi Antigen and Epitope Atlas: antibody specificities in Chagas disease patients across the Americas

Affiliations

The Trypanosoma cruzi Antigen and Epitope Atlas: antibody specificities in Chagas disease patients across the Americas

Alejandro D Ricci et al. Nat Commun. .

Abstract

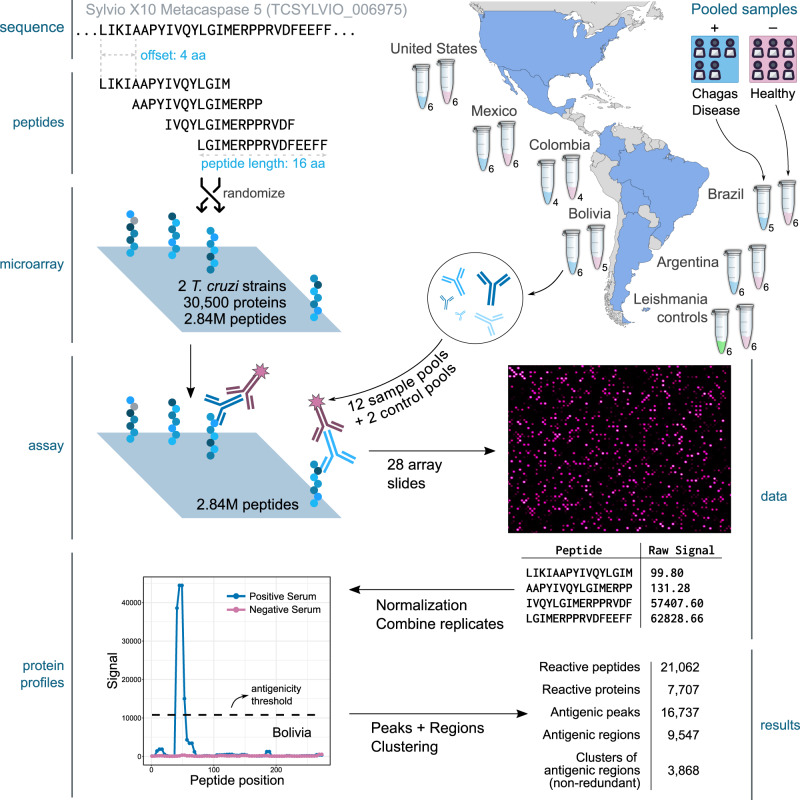
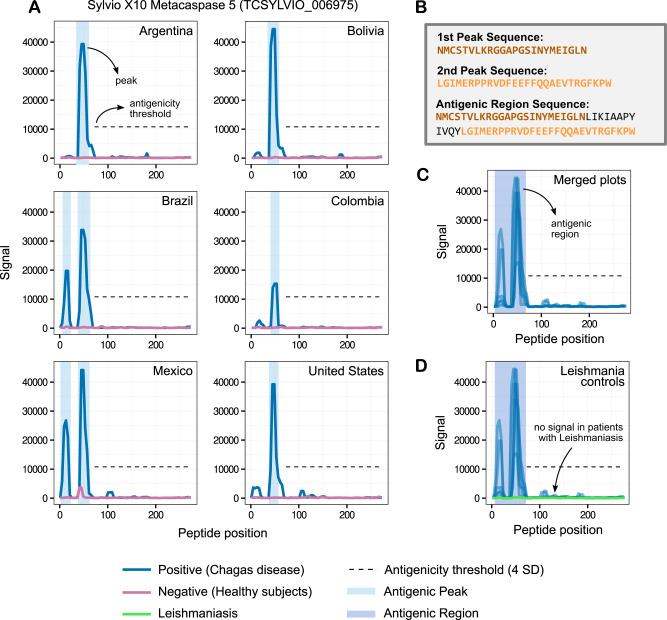
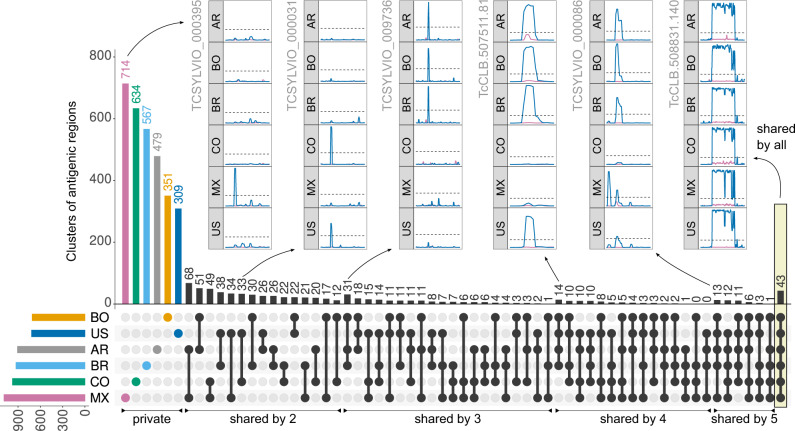
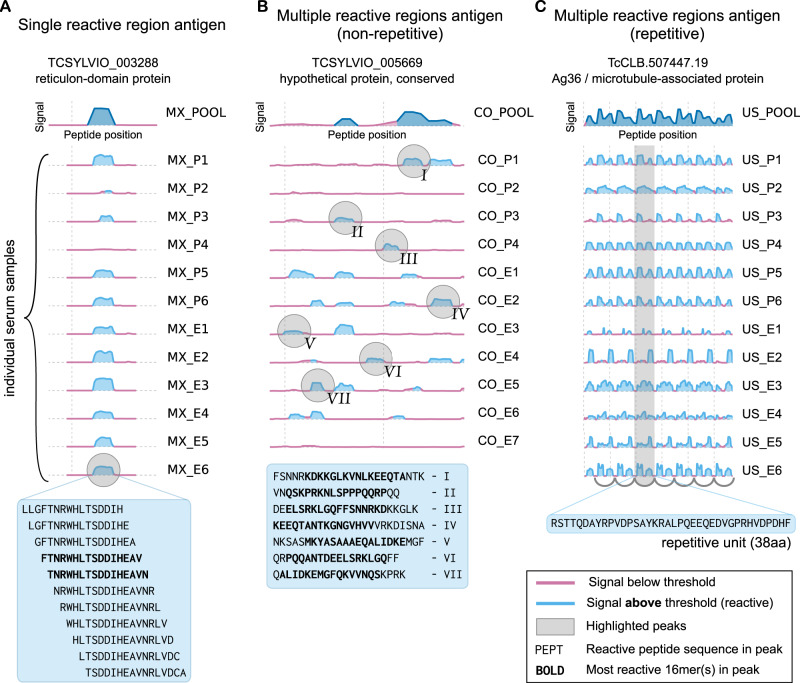
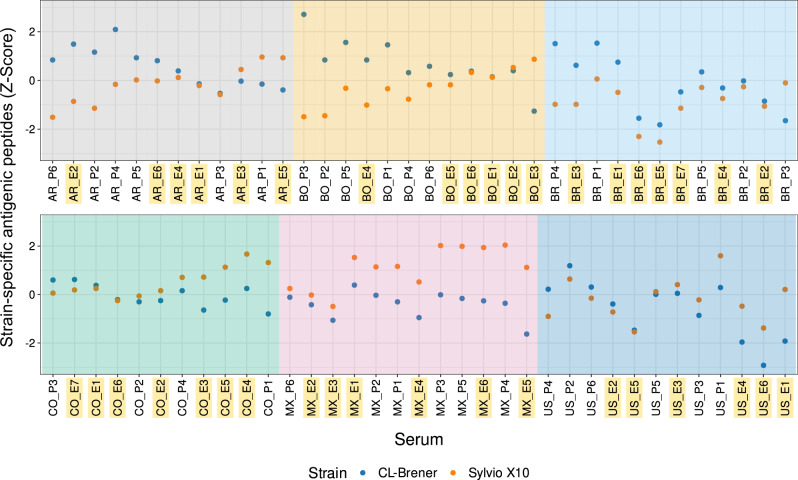
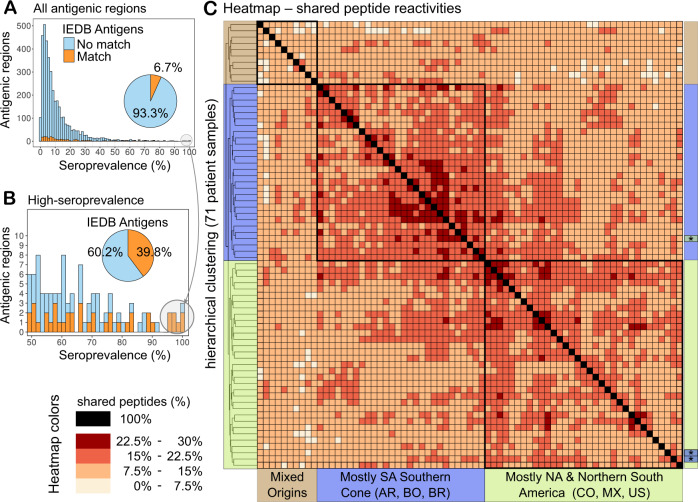
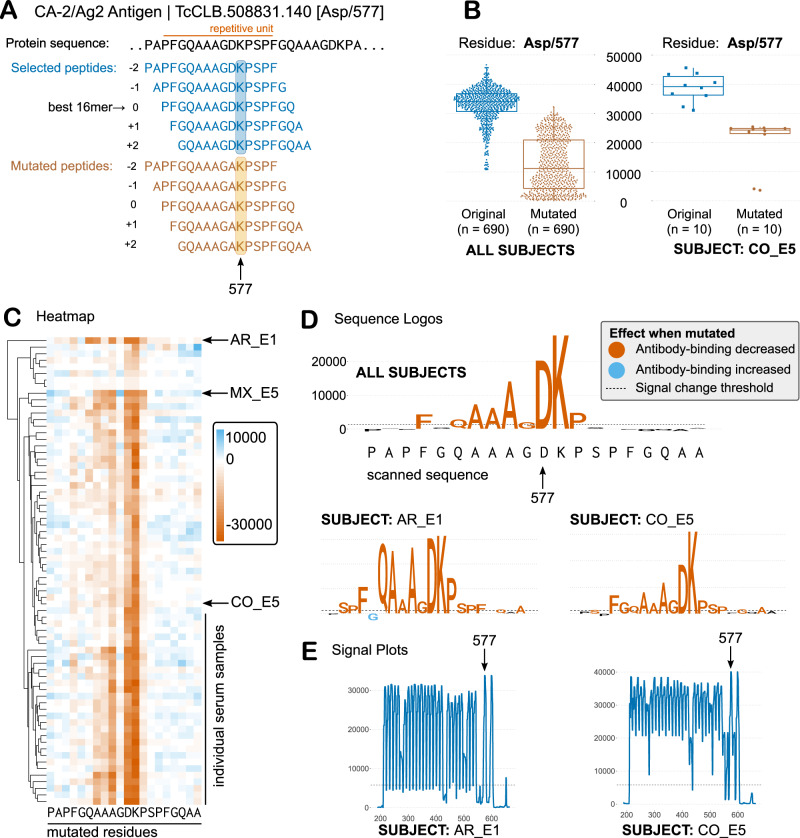
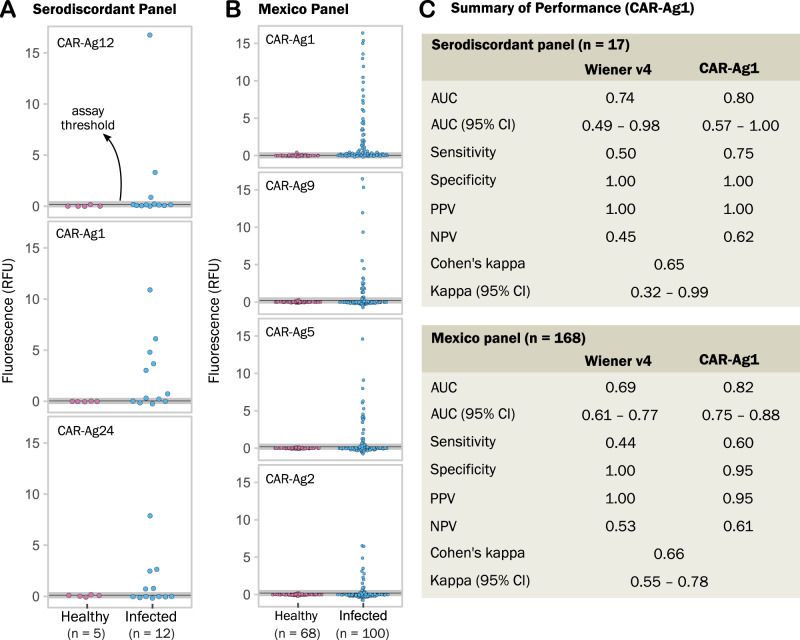
During an infection the immune system produces pathogen-specific antibodies. These antibody repertoires become specific to the history of infections and represent a rich source of diagnostic markers. However, the specificities of these antibodies are mostly unknown. Here, using high-density peptide arrays we examined the human antibody repertoires of Chagas disease patients. Chagas disease is a neglected disease caused by Trypanosoma cruzi, a protozoan parasite that evades immune mediated elimination and mounts long-lasting chronic infections. We describe a proteome-wide search for antigens, characterised their linear epitopes, and show their reactivity on 71 individuals from diverse human populations. Using single-residue mutagenesis we revealed the core functional residues for 232 of these epitopes. Finally, we show the diagnostic performance of identified antigens on challenging samples. These datasets enable the study of the Chagas antibody repertoire at an unprecedented depth and granularity, while also providing a rich source of serological biomarkers.


Conflict of interest statement

The authors declare no competing interests.

Figures

Fig. 1
Fig. 1. Summary of the discovery screening.
The figure shows a schematic representation of the steps followed to analyse two T. cruzi proteomes (CL-Brener and Sylvio X10) using pooled serum samples across the Americas (one pool from Chagas-infected individuals and one from healthy subjects from Argentina, Brazil, Bolivia, Colombia, Mexico, and the United States). The numbers below each tube represent the number of individual sera in each pool. An additional pooled serum sample of Leishmania-infected individuals and their healthy counterparts were used to study cross-reactivity. The protein used for this example is the metacaspase 5 protein from Sylvio X10 (TCSYLVIO_006975), which has 291 residues and was represented in each array using 69 peptides (16mers with an offset of 4 aa), of which only the first 4 peptides are shown here. Third-party image elements: the coloured map was created with MapChart, tubes and person open-licensed clipart are from Pixabay and SVG Repo.
Fig. 2
Fig. 2. Antibody-binding profiles, peaks, and regions.
The normalised fluorescence signal of each peptide in any given protein was used to produce the antibody-binding profiles for an antigen. The y-axis shows fluorescence units. The x-axis shows peptide positions along the protein sequence. Each subplot was produced using data from 4 high-density peptide arrays (2 replicas for Chagas disease subjects and 2 for matched healthy subjects, see main text). The figure serves to illustrate how we defined peaks (groups of consecutive peptides over the signal threshold) and antigenic regions (groups of neighbouring peaks). A Reactivity subplots for different sera pools for the Sylvio X10 metacaspase 5 protein. The antibody-binding profiles are shown in blue for the Chagas-positive sample pools (infected) and in magenta for the Chagas-negative pools (healthy). We used a conservative 4 SD antigenicity threshold throughout the discovery phase, which can be seen as a black dashed line. B Peptide sequences of the reactive peaks and regions in (A). C Reactivity plot merging data from all sample pools. D Same as (C) and showing the signal for the leishmaniasis-positive serum samples (in green).
Fig. 3
Fig. 3. Diversity of T. cruzi antibody-specific responses in pooled sera.
Non-redundant clusters of reactive regions in the analysed T. cruzi proteomes (clustered by sequence similarity) were counted on all intersections of the 6 analysed pooled samples. A cluster was antigenic in each sera pool when at least one of its regions was antigenic in that pool. The UpSet Plot displays a histogram with these counts (top), as well as a visual depiction of all the set intersections (bottom, black). The coloured histogram at the bottom left shows the counts of total reactive clusters. Pooled samples are AR = Argentina; BR = Brazil; BO = Bolivia; CO = Colombia; MX = Mexico; US = United States. The insets show antibody-binding profiles (as in Fig. 2) for several selected antigens. Source data are provided as a Source Data file.
Fig. 4
Fig. 4. Individual patient resolution and epitope mapping of Chagas disease antigens.
Examples of different types of antibody-binding profiles obtained using CHAGASTOPE-v2 arrays. In all cases, the reactivity of the pooled samples in the CHAGASTOPE-v1 discovery screening is shown at the top (dark blue), and stacked plots of the reactivity of the same protein against individual serum samples are shown below. See Supplementary Data S2 for the codes of patient serum samples (MX = Mexico, CO = Colombia, US = United States). Source data are provided as a Source Data file. A Example antigen with a single reactive region, showcasing peptides with signal above threshold (and most reactive peptides in bold). B Non-repetitive antigen displaying multiple reactive peaks (marked using roman numerals), and the corresponding peak sequences below. C Repetitive antigen displaying heterogeneous recognition of the repetitive unit by different Chagas-positive individuals.
Fig. 5
Fig. 5. Comparison of strain-specific antigenicity across subjects.
Counts of each subject’s strain-specific reactive peptides (those present in only one strain and with a signal above the antigenicity threshold) were standardised using Z-scores. Standardisation was necessary because CL-Brener and Sylvio X10 strains have different numbers of encoded proteins (see Methods). Z-scores above 0 and below 0 represent the higher and lower relative numbers of strain-specific reactive peptides, respectively. See Supplementary Data S2 for the codes of patient serum samples (AR = Argentina, BR = Brazil, BO = Bolivia, CO = Colombia, MX = Mexico, US = United States). Samples that were not part of the discovery screening and hence were not used for antigen discovery and design of the CHAGASTOPE-v2 arrays are highlighted in yellow. Source data are provided as a Source Data file.
Fig. 6
Fig. 6. Profiling of individual antibody responses reveals the diversity of anti-T. cruzi-specific antibodies.
A Histogram showing the number of clusters of antigenic regions that were reactive in each fraction of subjects (shown as seroprevalence). Sequence similarity to known antigens was assessed by BLASTP against T. cruzi linear epitopes in the IEDB (see Methods). Previously described antigens are shown in orange; antigens without matches to the IEDB are in light blue. B Inset zooming in on the 98 clusters reactive in at least 50% of the subjects (colours for novel and known antigens as in (A)). C Heatmap showing the percentage of non-redundant antigenic peptides that were shared between a pair of individual samples. The hierarchical clustering of samples shows three main branches (coloured and labelled at the sides) that correspond to the boxed peptide reactivities. A similar figure showing all sample labels is available, see Supplementary Fig. S4. Source data for each panel are provided as a Source Data file.
Fig. 7
Fig. 7. Single-residue scanning mutagenesis of T. cruzi antigens.
A Schematic representations of single-residue mutagenesis for one repetitive antigen (only 1 residue is mutated in this depiction for clarity). B Average signal of the original and mutated peptides for the Asp/577 residue for all positive sera (n = 69 biological independent samples) for this antigen (left) and for one selected subject (right). Each point represents the signal from an independent experiment, e.g., a peptide that contains residue 577 either as Asp (wild-type) or Ala (mutated). Boxplots: the upper and lower bounds of the box correspond to the first and third quartiles. Whiskers extend from the box up to 1.5 × IQR (interquartile range) or to the smallest and/or largest value. The centre of the box corresponds to the median value. C Heatmap showing the effect of mutations on antibody binding (signal change from original to mutated peptides) for all residues and for all sera. Mutations that decrease antibody binding are shown in different shades of orange, while those that increase binding are shown in shades of blue. Columns = residue positions, Rows = individual serum samples. D Sequence logos summarise data for all positive sera (Core residues), or for individual cases (y-axis: signal change in fluorescence units). Colours follow the heatmap. E Antibody-binding signal plots for selected subjects. Source data for each panel are provided as a Source Data file.
Fig. 8
Fig. 8. Performance of identified antigens for diagnosis of challenging samples.
All assays are fluorescent-linked immunosorbent assays (FLISA), each dot in a plot represents the average signal of duplicates from an individual sample. RFU means relative fluorescence units. Assay threshold is shown as a black line and corresponds to the value of the mean signal of all healthy individuals plus three standard deviations. An indeterminate zone around the threshold is shown in grey. A Reactivity of three antigens against a panel of serodiscordant individuals (see Methods); in this case, the classification of Healthy vs Infected is based on the result of the confirmatory technique (IIF indirect immunofluorescence, performed with replicates in a reference centre by trained personnel). B Reactivity of four antigens against a panel of samples from Mexico. Individuals were classified into Healthy vs Infected using both serology and molecular tests at the origin. C Performance of the CAR-Ag1 antigen against the Wiener Chagatest recombinant v4 assay. Cohen’s kappa index measures concordance between the two assays in each panel. Source data for each panel are provided as a Source Data file.

References

    1. Bannard O, Cyster JG. Germinal centers: programmed for affinity maturation and antibody diversification. Curr. Opin. Immunol. 2017;45:21–30. doi: 10.1016/j.coi.2016.12.004. - DOI - PubMed
    1. Di Noia JM, Neuberger MS. Molecular mechanisms of antibody somatic hypermutation. Annu. Rev. Biochem. 2007;76:1–22. doi: 10.1146/annurev.biochem.76.061705.090740. - DOI - PubMed
    1. Feng Y, Seija N, Di Noia JM, Martin A. AID in antibody diversification: there and back again. Trends Immunol. 2020;41:586–600. doi: 10.1016/j.it.2020.04.009. - DOI - PMC - PubMed
    1. Zhang Y, Zhang X, Dai H-Q, Hu H, Alt FW. The role of chromatin loop extrusion in antibody diversification. Nat. Rev. Immunol. 2022;22:550–566. doi: 10.1038/s41577-022-00679-3. - DOI - PMC - PubMed
    1. Frank, R. & Overwin, H. SPOT synthesis. in Epitope Mapping Protocols (ed. Morris, G. E.) 149–169 (Humana Press). 10.1385/0-89603-375-9:149 (1996).

Publication types