. 2023 Apr 3;14(1):1839.
doi: 10.1038/s41467-023-37361-8.

Monocyte depletion enhances neutrophil influx and proneural to mesenchymal transition in glioblastoma

Affiliations

Monocyte depletion enhances neutrophil influx and proneural to mesenchymal transition in glioblastoma

Zhihong Chen et al. Nat Commun. .

Abstract

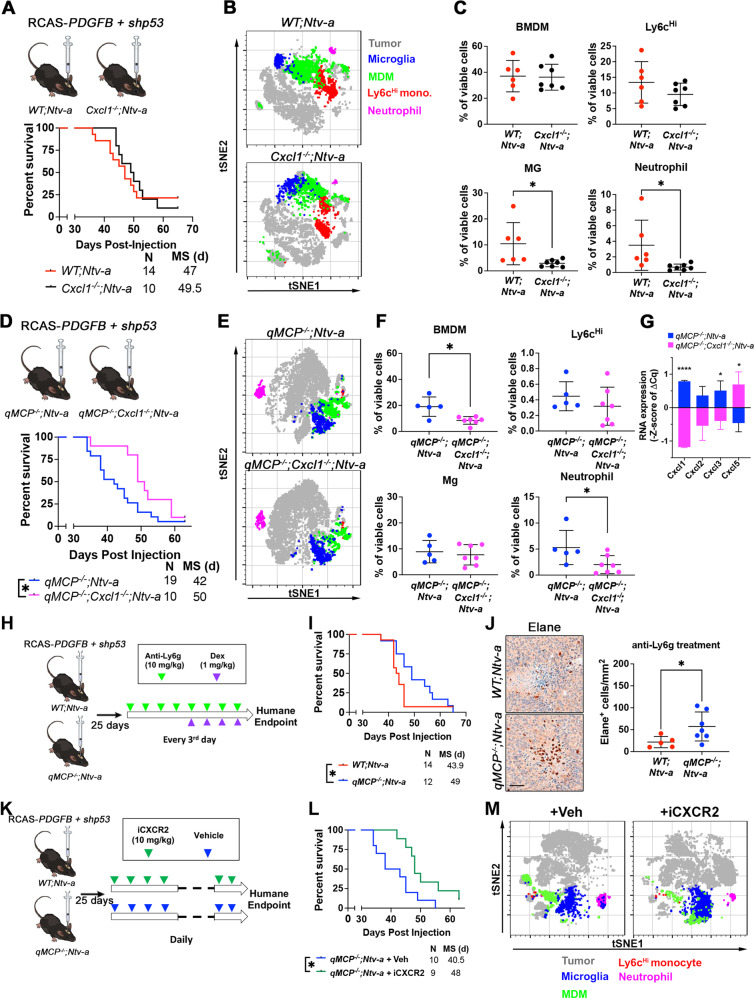
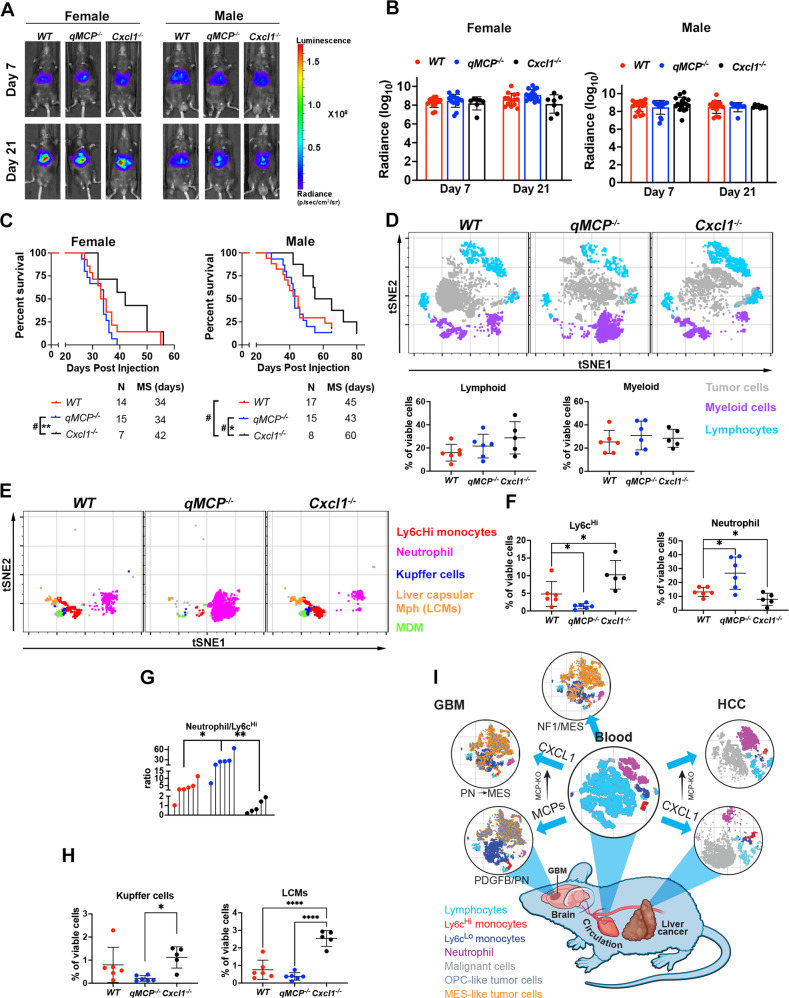
Myeloid cells comprise the majority of immune cells in tumors, contributing to tumor growth and therapeutic resistance. Incomplete understanding of myeloid cells response to tumor driver mutation and therapeutic intervention impedes effective therapeutic design. Here, by leveraging CRISPR/Cas9-based genome editing, we generate a mouse model that is deficient of all monocyte chemoattractant proteins. Using this strain, we effectively abolish monocyte infiltration in genetically engineered murine models of de novo glioblastoma (GBM) and hepatocellular carcinoma (HCC), which show differential enrichment patterns for monocytes and neutrophils. Eliminating monocyte chemoattraction in monocyte enriched PDGFB-driven GBM invokes a compensatory neutrophil influx, while having no effect on Nf1-silenced GBM model. Single-cell RNA sequencing reveals that intratumoral neutrophils promote proneural-to-mesenchymal transition and increase hypoxia in PDGFB-driven GBM. We further demonstrate neutrophil-derived TNF-a directly drives mesenchymal transition in PDGFB-driven primary GBM cells. Genetic or pharmacological inhibiting neutrophils in HCC or monocyte-deficient PDGFB-driven and Nf1-silenced GBM models extend the survival of tumor-bearing mice. Our findings demonstrate tumor-type and genotype dependent infiltration and function of monocytes and neutrophils and highlight the importance of targeting them simultaneously for cancer treatments.


Conflict of interest statement

The authors declare no competing interests.

Figures

Fig. 1
Fig. 1. Expressions of MCP family member CCL7 is increased in human GBM, and increased levels correlate with inferior GBM patient survival, and generation and validation of qMCP−/− mouse.
A Correlations between CCL7, CCL8, and CCL13 expression levels and patient survival were analyzed using an IDH-WT cohort from TCGA. High and low expressions were defined as + /− 0.5 SD from the mean of all samples (n = 259). B Forrest plots showing hazard ratio (HR) generated with Cox Proportional Hazards models, using expression of different MCPs genes as continuous variates, with age and gender as covariates. LCL lower confidence limit, UCL upper confidence limit. C Expression distribution of MCP family members in human GBM tissue as determined in tandem by laser capture microdissection and RNA-seq queried from the IVYGap database. D Normalized protein expressions of MCPs examined in control brain and GBM samples by Olink proteomic assay. N = 3 (independent normal controls) and 7 (independent patient tumor tissues). Data are presented as mean + /− SD. E Schematic illustration of CRISPR/Cas9-mediated deletion of the MCP genes. F Serum MCP levels were measured by ELISA following LPS treatment. CCL5 was used as an internal control. N = 8 (independent WT mice) and 8 (independent qMCP/− mice). Data are presented as mean + /− SD. P = 0.054, 0.0016, 0.0037, 0.000, respectively, where asterisks are present. G Flow cytometry quantification of Ly6cHi monocytes in the bone marrow of healthy adult mice. Data are presented as mean + /− SD. H Multiplex flow cytometry analysis was used to enumerate blood cells in the circulation. N = 5 (independent WT mice) and 5 (independent qMCP/ mice). I Analysis of blood cells in healthy adult mice. P = 0.0018, 0.0003, and 0.0845, respectively, where asterisks are present. N = 8 (independent WT mice) and 5 (independent qMCP/− mice). Data are presented as mean + /− SD. J Schematic illustration of orthotopic transplantation of primary tumors. K Kaplan–Meier survival curves of PDGFB-driven tumors generated in WT and qMCP/− mice. P = 0.0333. L flow cytometric quantification of myeloid cells in tumors at humane endpoint. N = 5 (independent WT mice) and 3 (independent qMCP/− mice). P = 0.0040, 0.0048 and 0.0004, respectively, where asterisks are present. Data are presented as mean + /− SD. Two-sided Student’s t test for (D, F, G, I, L), and Log-rank test for (A, K). *P < 0.05, **P < 0.01, ***P < 0.001, ****P < 0.0001. MS  median survival. CTL adjacent normal brain tissues. Source data are provided as a Source Data file.
Fig. 2
Fig. 2. Deletion of MCPs blocks monocyte recruitment and leads to a compensatory infiltration of neutrophils.
A Kaplan–Meier survival curves of PDGFB-driven tumors generated in WT; Ntv-a and qMCP/−; Ntv-a mice. B UMAP dimensionality reduction of scRNA-seq data from 57,360 cells isolated from three WT; Ntv-a and three qMCP/; Ntv-a tumors. Consistent expression of known markers was used to annotate cell clusters into five broad cell classes: lymphoid (B cells, NK cells, plasma, αβT-cell, and γδT cells), Myeloid (DC1, DC2, DC3, pDC, MDM, MG, monocytes and neutrophils), Stromal (astrocytes, excitatory neurons, interneurons, OLG_imm, OLG_mat and vascular smooth muscle cells), endothelial, and tumor (T0 to T5). C UMAP showing refined clustering of myeloid cells isolated from WT;Ntv-a (left) and qMCP/−; Ntv-a (right) tumors. D UMAP dimensionality reduction of neutrophil and MDM from qMCP-deficient and WT tumors into clusters. E tSNE plots showing results of spectral flow cytometry analysis of the tumors. F Dot plots and quantification of monocytes and neutrophils analyzed by spectral flow cytometry. P = 0.0040 and 0.0263, respectively. N = 6 (independent WT; Ntv-a mice) and 5 (independent qMCP/−; Ntv-a mice). Data are presented as mean + /− SD. G Representative images of Immunohistochemistry staining for Elane in GBM sections, and H quantification of Elane+ cells. P = 0.0033. N = 8 (independent WT;Ntv-a mice) and 5 (independent qMCP−/;Ntv-a mice). Data are presented as mean + /− SD. I, J Quantitative analysis of Cxcl chemokines or Csf by qPCR. Centerline shows Z score equals to 0, whiskers indicate the standard deviation. N = 12 (independent WT;Ntv-a mice) and 10 (independent qMCP-/-;Ntv-a mice). Two-tailed Student’s t test for (F, H, I, J), and Log-rank test for (A). *P < 0.05, ** P < 0.01, ***P < 0.001, ****P < 0.0001. Scale bar = 100 μm, scale bar in inset = 50 μm. Mus muscle, imm immature, mat mature. Source data are provided as a Source Data file.
Fig. 3
Fig. 3. Human MES and NF1 Del/Mut GBM have increased expression of neutrophil recruitment chemokines and neutrophil content.
A NanoString in silico analysis of cellular scores in human GBM tumor samples. (N = 6 for G-CIMP or IDH-mut, 2 for PN, 10 for CL, and 5 for MES GBM patients). B Neutrophil score in hGBM subtype samples. P = 0.0105, 0.0212, and 0.0191, respectively. N is the same as in (A). C Expression of neutrophil recruitment chemokines IL8 and S100A9 examined by NanoString. P = 0.0003, 0.0007, and 0.0001, respectively. N is the same as in (A). D Genetic alterations of GBM patient samples (cBioportal, TCGA, Firehose Legacy) selected based on mutual exclusivity of alterations in PDGFFRA (N = 15), NF1 (N = 23), and EGFR (N = 0). E Expression of neutrophil recruitment chemokines and their shared receptor CXCR2 examined by TCGA. Two-sided Student’s t test. N = 14 (independent PDGFRA-amplified patients) and 11 (independent Nf-1 silenced patients). Data are presented as mean + /− SD. F Survival curves of IDH-WT human GBM patients based on low- and high- expression levels of IL8. High and low are defined as + /− 1 SD from mean of 373 IDH-WT GBM patient samples (cBioportal, TCGA, Firehose Legacy). P = 0.0029 by Log-rank test. G Representative images of IHC for Elane. H Quantification of Elane+ neutrophils. N = 5 (independent G-CIMP patients), 3 (independent PN patients), 8 (independent CL patients), and 7 (independent MES patients). Data are presented as mean + /− SD. P = 0.0170, 0.0411, and 0.0084, respectively where asterisks are present. One-way ANOVA with Tukey’s multiple comparisons test for (B, C, H), two-sided Student’s t test for (E), Log-rank test for (F). *P < 0.05, **P < 0.01, ***P < 0.001. Scale bar = 100 μm, scale bar in inset = 25 μm. MS  median survival. Source data are provided as a Source Data file.
Fig. 4
Fig. 4. Deletion of MCP chemokines results in PN to MES shift in PDGFB-driven GBM.
A Neftel cell state plots from scRNA-seq demonstrate PDGFB-driven tumors in absence of monocyte show decrease in OPC- and NPC-like cells and increase in MES-like cells. B UMAP dimensionality reduction of MES-like cell state module score in all malignant cells examined by scRNA-seq. C Quantification of MES score between WT; Ntv-a (red) and qMCP/−; Ntv-a (blue) malignant cells. Two-tailed Wilcoxon signed-rank test was used on the cell distributions. No adjustment was made. D Real-time qPCR panel of signature genes that are differentially expressed in PN and MES human GBM. Centerline shows Z score equals to 0, whiskers indicate standard deviation. Data are presented as mean + /− SD. P = 0.0000, 0.0007, 0.0052, 0.0110, 0.0432, and 0.0108, respectively where asterisks are present. N = 12 (WT; Ntv-a) and 10 (qMCP/−; Ntv-a) mice. E Representative images and quantification of immunohistochemistry for signature molecules of neoplastic cells. Data are presented as mean + /− SD. P = 0.0183 and 0.0000, respectively, where asterisks are present. N = 4 (WT; Ntv-a) and 5 (qMCP/−; Ntv-a) mice for Olig2; 6 (WT; Ntv-a) and 6 (qMCP−/−; Ntv-a) mice for GFAP, 4 (WT;Ntv-a) and 5 (qMCP−/−; Ntv-a) mice for CD44. F Representative images and quantification of immunohistochemistry for molecules in TME. N = 5 (WT; Ntv-a) and 5 (qMCP/−; Ntv-a) mice for IBA1; 6 (WT; Ntv-a) and 7 (qMCP−/−; Ntv-a) mice for P2RY12, 5 (WT; Ntv-a) and 5 (qMCP−/−; Ntv-a) mice for vessel size comparison. Data are presented as mean + /− SD. P = 0.0030 and 0.0225, respectively, where asterisks are present. Two-sided Wilcoxon signed-rank test for (C). Two-sided Student’s t test for (DF). *P < 0.05, **P < 0.01, ***P < 0.001, ****P < 0.0001. Scale bar = 50 μm, scale bar in inset = 20 μm. Source data are provided as a Source Data file.
Fig. 5
Fig. 5. Neutrophils promote tumor progression by inducing a hypoxic response and necrosis.
A UMAP dimensionality reduction of the “Greenyellow” module score identified by scWGCNA analysis (left). Distribution of the average “Greenyellow” module score in malignant cells (right). Two-tailed Wilcoxon signed-rank test was used on the cell distributions. No adjustment was made. B Network graph of the top 30 co-expressed genes in the Greenyellow module. C Hallmark pathway gene set enrichment analysis of each WGCNA module. Dot colors represent -log(P-value) and dot sizes represent the number of genes in each Hallmark pathway. Arrowheads indicate biological functions related to the Greenyellow module. Benjamini–Hochberg adjusted (BH-adjusted) hypergeometric test was used. D CellphoneDB dotplot showing differentially enriched interactions between ligands (expressed by neutrophil) and receptors (expressed by recipient cells). Dot colors represent the proportion of WT; Ntv-a vs. qMCP−/−; Ntv-a enrichment and dot sizes represent the −log(P value) of the differential enrichment. E Quantitative real-time PCR for expression of signature MES genes in primary PDGFB-driven GBM tumor cell cultures derived from WT; Ntv-a (WT-GSC) and qMCP−/−; Ntv-a (qMCP−/−-GSC) mice (N = 3 independent primary cultures for each genotype), and F in WT-GSCs treated with 10 ng/mL of TNF-α for 48 hrs. P = 0.0030, 0.0001, 0.0002, respectively for CD44; P = 0.0002 and 0.0000, respectively, for Chi3l1; P = 0.0010, 0.0000, and 0.0000, respectively, for Tgfb1; P = 0.0003 and 0.0000, respectively for Serpine1, where asterisks are present. N = 3 independent primary cultures. G Representative images of TUNEL staining and quantification of TUNEL positive cells in WT-GSCs treated with 10 ng/mL and 50 ng/mL TNF-α for 48 h. N = 3 independent primary cultures. Data are presented as mean + /− SD. P = 0.0255 (0 vs. 10), 0.0213 (0 vs. 50), and 0.0202 (10 vs. 50). H Representative images and quantification of H&E staining for necrosis. N = 7 (WT; Ntv-a) and 6 (qMCP/−; Ntv-a) mice. Data are presented as mean + /− SD. P = 0.0263, 0.0353, and 0.0448, respectively. Fisher’s exact test for D, One-way ANOVA followed by Tucky’s post hoc analysis for (F, G). Two-sided Student’s t test for (E, H). *P < 0.05, **P < 0.01. Scale bar in (G) = 50 μm, scale bar in inset = 20 μm; in (H) = 1 mm, in inset = 250 μm. GSC = glioblastoma stem cell. (GSC-5, GSC-6, GSC-7 are primary lines derived from three different tumor-bearing mice). Source data are provided as a Source Data file.
Fig. 6
Fig. 6. Genetic deletion of Cxcl1 or pharmacological inhibition of neutrophil recruitment extends the survival of qMCP/−;Ntv-a mice.
A Schematic illustration and Kaplan–Meier survival curves of PDGFB-driven tumors generated in WT; Ntv-a and Cxcl1/−; Ntv-a mice (Cxcl1 is lost in both tumor cells and TME). B tSNE plots illustrating myeloid composition in tumors. C FACS quantification of myeloid subtypes. Each dot represents an independent mouse. Data are presented as mean + /− SD. P = 0.0330 and 0.0420, respectively, where asterisks are present. N = 6 (WT; Ntv-a) and 7 (Cxcl1/−; Ntv-a) mice. D Schematic illustration and Kaplan–Meier survival curves of PDGFB-driven tumors generated in qMCP/−; Ntv-a and qMCP/−; Cxcl1−/−; Ntv-a mice. P = 0.0389 by Log-rank test and P = 0.0167 by Gehan–Breslow–Wilcoxon (GBW) test. E tSNE plots illustrating myeloid composition in tumors. F FACS quantification of myeloid subtypes. N = 5 (qMCP/−; Ntv-a) and 7 (qMCP−/; Cxcl1−/−;Ntv-a) mice. Data are presented as mean + /− SD. P = 0.0061 and 0.0470 where asterisks are present. G Real-time qPCR on tumors from (F) at endpoint of survival. Centerline shows Z score equals to 0, whiskers indicate standard deviation. N= 9 (independent qMCP/−; Ntv-a mice) and 6 (independent qMCP/−; Cxcl1−/−; Ntv-a mice). Data are presented as mean + /− SD. P = 0.0000, 0.0453, and 0.0218, respectively, where asterisks are present. H Schematic illustration of treatment paradigm using anti-Ly6g antibodies. I Kaplan–Meier survival curves of WT; Ntv-a and qMCP/−; Ntv-a mice treated with anti-Ly6g antibodies. P = 0.0260 by Gehan–Breslow–Wilcoxon (GBW) test and P = 0.1319 by Log-rank test. J Representative images and quantification of Elane+ neutrophils in tumors from mice at the endpoint of survival. N = 5 (WT; Ntv-a) and 7 (qMCP−/−; Ntv-a) mice. Data are presented as mean + /− SD. K Schematic illustration of treatment paradigm using CXCR2 antagonist. L Kaplan–Meier survival curves of qMCP/−; Ntv-a mice treated with or without iCXCR2. P = 0.0158 by Log-rank test and P = 0.0122 by Gehan–Breslow–Wilcoxon (GBW) test. M tSNE plots illustrating myeloid composition in tumors. Two-sided Student’s t test for (C, F, G, J) and Gehan–Breslow–Wilcoxon (GBW) test and Log-rank test for (D, I, L). *P < 0.05. BMDM   bone marrow-derived myeloid cells, Mg microglia, iCXCR2   CXCR2 inhibitor, Dex dexamethasone, MS   median survival. Veh vehicle. Scale bar = 50 μm. Source data are provided as a Source Data file.
Fig. 7
Fig. 7. Genetic loss of Cxcl1 results in decreased neutrophil infiltration and extended survival of Nf1-silenced tumor-bearing mice.
A Schematic Illustration of generation of Nf1-silenced tumors using WT; Ntv-a and Cxcl1/−; Ntv-a mice and B corresponding Kaplan–Meier survival curves. P = 0.0479 by GBW test and P = 0.0906 by Log-rank test. C Quantification dot plots of various myeloid subsets by spectral flow cytometry. Each dot represents an independent mouse. Data are presented as mean + /− SD. P = 0.0085, 0.0386, and 0.0241, respectively where asterisks are present. N = 10 (WT; Ntv-a) and 9 (Cxcl1−/−; Ntv-a) mice. Log-rank and GBW test for (B) and two-sided Student’s t test for (C). *P < 0.05, **P < 0.01. Source data are provided as a Source Data file.
Fig. 8
Fig. 8. Decreasing neutrophil but not abolishing monocyte recruitment decreases tumor growth and extends the survival of HCC-bearing mice.
A Representative images and B corresponding quantification graphs of bioluminescence imaging at 7 and 21 days after tumor initiation. N = 12 (individual female WT mice), 13 (individual female qMCP/− mice) and 7 (individual female Cxcl1/− mice). N = 17 (individual male WT mice), 15 (individual male qMCP/− mice) and 8 (individual male Cxcl1/ mice). Data are presented as mean + /− SD. C P = 0.0051 by Log-rank test and P = 0.0281 by GBW test, respectively, between female qMCP−/− and female Cxcl1−/− mice. P = 0.047 by GBW test between male WT and male Cxcl1−/− mice; P = 0.0469 by Log-rank test and P = 0.0259 by GBW test, respectively between male qMCP−/− and male Cxcl1−/− mice. D tSNE plots and flow cytometry quantification of lymphoid and myeloid cells in HCC-bearing mice. N = 6 (WT), 6 (qMCP−/−) and 5 (Cxcl1−/−) mice. Data are presented as mean + /− SD. E tSNE plots illustrating myeloid cells examined by spectral flow cytometry. F Quantification of monocytes and neutrophils by spectral flow cytometry. Each dot represents an independent mouse. Data are presented as mean + /− SD. P = 0.0406 (WT vs. qMCP−/−) and 0.0415 (WT vs. Cxcl1−/−) for Ly6cHi monocytes; and P = 0.0206 (WT vs. qMCP−/−) and 0.0468 (WT vs. Cxcl1/−) for Neutrophils. N is the same as in (D). G Lollipop plot showing neutrophil to Ly6cHi monocytes ratio. Each dot represents an independent mouse. P = 0.0124 (WT vs. qMCP/−) and 0.0067 (qMCP/− vs. Cxcl1−/−). N is the same as in (D). H Quantification of Kupffer cells and LCMs by spectral flow cytometry. Data are presented as mean + /− SD. P = 0.0308 (qMCP−/ vs. Cxcl1−/−) for Kupffer cells; and P = 0.0000 (WT vs. Cxcl1−/−) and 0.0000 (qMCP/− vs. Cxcl1-/-) for LCMs. N is the same as in (D). One-way ANOVA with Tukey’s post hoc test for (FH) and Log-rank and GBW for (C). *P < 0.05, **P < 0.01, ***P < 0.001 and #P < 0.05 by GBW test. I Summary Illustration of findings. MS   median survival. N = number of mice. LCM   liver capsular macrophages. Source data are provided as a Source Data file.

References

    1. Hambardzumyan D, Gutmann DH, Kettenmann H. The role of microglia and macrophages in glioma maintenance and progression. Nat. Neurosci. 2016;19:20–27. doi: 10.1038/nn.4185. - DOI - PMC - PubMed
    1. Buonfiglioli A, Hambardzumyan D. Macrophages and microglia: the cerberus of glioblastoma. Acta Neuropathol. Commun. 2021;9:54. doi: 10.1186/s40478-021-01156-z. - DOI - PMC - PubMed
    1. Hambardzumyan D, Bergers G. Glioblastoma: defining tumor niches. Trends Cancer. 2015;1:252–265. doi: 10.1016/j.trecan.2015.10.009. - DOI - PMC - PubMed
    1. Chen Z, et al. Genetic driver mutations introduced in identical cell-of-origin in murine glioblastoma reveal distinct immune landscapes but similar response to checkpoint blockade. Glia. 2020;68:2148–2166. doi: 10.1002/glia.23883. - DOI - PMC - PubMed
    1. Butowski N, et al. Orally administered colony stimulating factor 1 receptor inhibitor PLX3397 in recurrent glioblastoma: an Ivy Foundation Early Phase Clinical Trials Consortium phase II study. Neuro-Oncol. 2016;18:557–564. doi: 10.1093/neuonc/nov245. - DOI - PMC - PubMed

Publication types

Substances