. 2023 Aug;7(8):971-985.
doi: 10.1038/s41551-023-01018-0. Epub 2023 Apr 3.

Surgical polarimetric endoscopy for the detection of laryngeal cancer

Affiliations

Surgical polarimetric endoscopy for the detection of laryngeal cancer

Ji Qi et al. Nat Biomed Eng. 2023 Aug.

Erratum in

Abstract

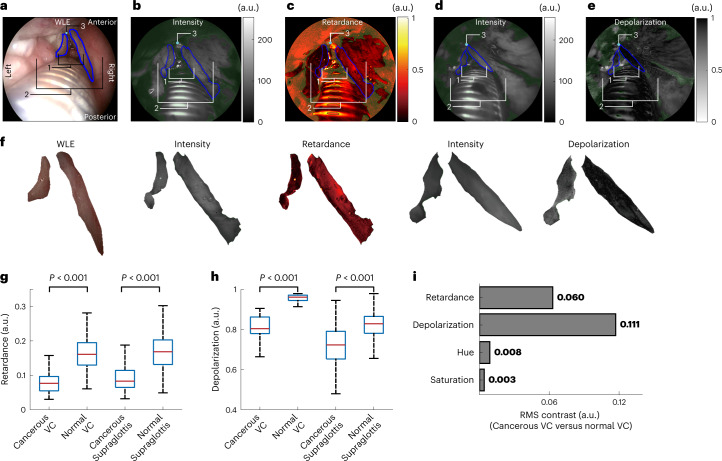
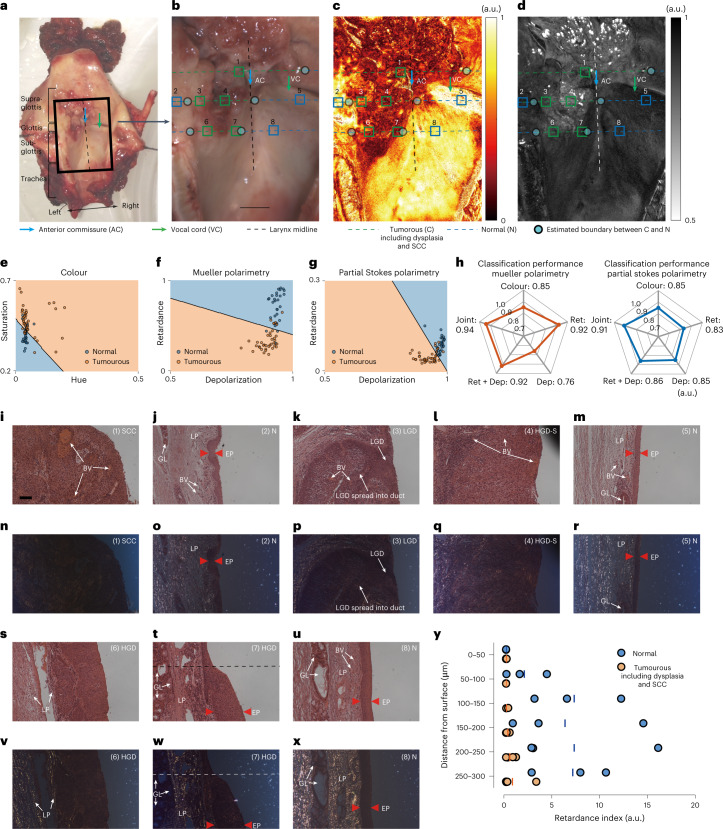
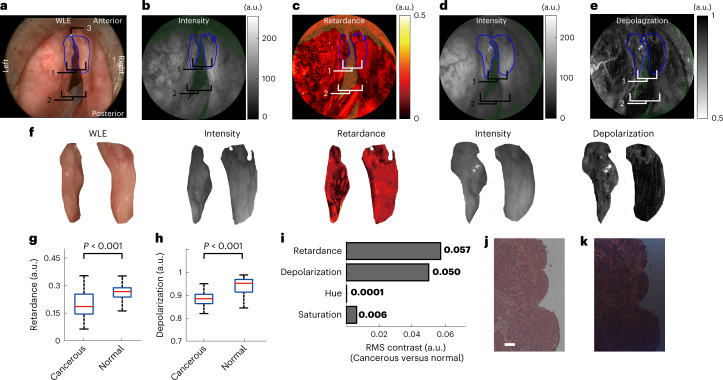
The standard-of-care for the detection of laryngeal pathologies involves distinguishing suspicious lesions from surrounding healthy tissue via contrasts in colour and texture captured by white-light endoscopy. However, the technique is insufficiently sensitive and thus leads to unsatisfactory rates of false negatives. Here we show that laryngeal lesions can be better detected in real time by taking advantage of differences in the light-polarization properties of cancer and healthy tissues. By measuring differences in polarized-light retardance and depolarization, the technique, which we named 'surgical polarimetric endoscopy' (SPE), generates about one-order-of-magnitude greater contrast than white-light endoscopy, and hence allows for the better discrimination of cancerous lesions, as we show with patients diagnosed with squamous cell carcinoma. Polarimetric imaging of excised and stained slices of laryngeal tissue indicated that changes in the retardance of polarized light can be largely attributed to architectural features of the tissue. We also assessed SPE to aid routine transoral laser surgery for the removal of a cancerous lesion, indicating that SPE can complement white-light endoscopy for the detection of laryngeal cancer.


Conflict of interest statement

The authors declare no competing interests.

Figures

Fig. 1
Fig. 1. The SPE system.
a, Design of the handheld endoscope device in the SPE system and schematic of DoFP-LP camera. QWP: quarter waveplate. DoFP-LP incorporates an array of micro-linear polarizers on the top of the photodiode array. Every block of four adjacent array elements comprises 90°, 45°, 135° and 0° angled micro-linear polarizers directly above four photodiodes that constitute a super-pixel. b, Photo of the handheld endoscope part of the SPE system. c, Schematic: intra-operative imaging of larynx with the SPE system. d, Endoscopic polarizing tip attachment, compared with a 20 pence coin. Scale bar is 10 mm. e, The polarization properties (from left to right: retardance, diattenuation and depolarization; unitless) of the imaging channel of the rigid endoscope used in the SPE system. f, Image processing pipeline. g,h, Intensity reference images obtained from SPE imaging of a negative 1951 USAF target under depolarization (dep) (g) and retardance (ret) (h) modes. i, The spread functions of a three-line grid in the target extracted from the red horizontal line in g and blue horizontal line in h. Source data
Fig. 2
Fig. 2. Validation of the SPE system.
a, Imaging a homogeneous scattering target (white paper). The SPE revealed the expected high depolarization and low retardance. Regions rendered green (marked with green arrow indicators) indicate either under- or overexposure and were invalid. b, Imaging a volunteer’s skin, which was highly depolarizing and weakly retarding. Depolarization images show enhanced surface structure contrast compared with its intensity reference, visible in the enlarged regions. c, Imaging a phantom topped by an M-shaped retarding film. d, Retardance and intensity-reference profiles corresponding to the blue lines in c. e, RMS contrast in retardance, hue and saturation between the retarding target (squares 1, 3 and 5) and non-retarding background (squares 2 and 4) in c. f,g, Imaging a volunteer’s oral vestibule area without strain (f) and with strain (g). h, Change of retardance properties within the oral vestibule and the gum represented by ROI 1 and ROI 2 respectively in the lip stretching process recorded over nine consecutive frames. i, Change of depolarization properties within the oral vestibule and the gum represented by ROI 3 and ROI 4 respectively in the lip stretching process recorded over nine consecutive frames. Data in h and i are presented as mean ± standard deviation of the pixel values in the ROIs. Please refer to Supplementary Videos 1 and 2 for the entire process with full field of view. Source data
Fig. 3
Fig. 3. Assessment of SPE in vivo in a laryngectomy case.
a, Larynx imaged with WLE: 1, glottis (vocal cords); 2, supraglottis; 3, anterior commissure. b,c, Retardance and its intensity-reference image of the larynx. d,e, Depolarization and its intensity-reference image of the larynx. f, Magnified images of the cancerous and normal vocal cord (for those of the supraglottis, see Supplementary Fig. 6). gh, Retardance and depolarization values within the cancerous, normal vocal cord (VC) and the cancerous and normal supraglottis. In the box plots, the red centre line denotes the median value and the blue box shows the 25th and 75th percentiles of the dataset. The black whiskers mark the non-outlier minimum and non-outlier maximum. P values were calculated via a two-sided Mann–Whitney U test for two-group comparison. i, RMS contrast between the cancerous and normal vocal cords in terms of retardance and depolarization revealed by the SPE and hue and saturation shown in WLE. For consecutive SPE imaging of this case, please refer to Supplementary Videos 3 and 4. Source data
Fig. 4
Fig. 4. Ex vivo polarimetric imaging and pathological study.
a, Photo of the excised larynx split in posterior midline and splayed open. The photo was taken immediately upon devascularization and before formalin fixation. bd, White light, retardance and circular depolarization (obtained from Mueller polarimetry) images respectively of the area enclosed by the black box in a, labelled with diagnosis results from histopathology along three lines within supraglottis (b), glottis (c) and subglottis (d). Scale bar, 5 mm. eg, Tissue pathology classification based on support vector machine using colour information, polarimetric information obtained from Mueller polarimetry and partial Stokes polarimetry respectively for 66 separate regions along the three lines in bd. h, Classification performance measured by AUC of ROC curves (for all the ROC curves involved here, see Supplementary Figs. 8 and 9) using colour, retardance (Ret) and depolarization (Dep) information alone, using both retardance and depolarization (Ret + Dep) and using all of them (joint) altogether obtained from Mueller polarimetry (left) and partial Stokes polarimetry (right), respectively. ix, White-light microscopy and polarization microscopy of the cross-sectional tissue slices of the larynx in ROIs 1–8 labelled in bd. ix have the same scale bar (100 μm) labelled in i. EP, epithelium; GL, glands; BV, blood vessels. ROI 1: SCC; ROIs 2, 5 and 8: normal represented by N; ROI 3: low-grade dysplasia spreading into the duct (LGD); ROI 4 is carcinoma with a thick high-grade dysplastic surface (HGD-S); ROI 6 is high-grade dysplasia (HGD); ROI 7 below the dash line is also high-grade dysplasia (HGD), above the dashed line is a transition area from dysplasia to normal. y, distribution of tissue retarders along the axial direction for ROI 1–8 in ix. For normal tissue regions (ROIs 2, 5 and 8), the retardance indices (Methods) are small at 0–50 μm depth where epithelium locates and substantially increase from 100 μm below where LP locates. The retardance indices for cancerous regions including dysplastic ones (ROIs 1, 3, 4, 6 and 7) are constantly small across 0–300 μm depth. Source data
Fig. 5
Fig. 5. Testing SPE in vivo in a transoral surgery.
a, Larynx imaged with WLE: 1, anterior vocal cords; 2, posterior vocal cords. b,c, Retardance (b) and its intensity-reference image (c) of the larynx. d,e, Depolarization (d) and its intensity-reference image (e) of the larynx. f, Magnified images of the cancerous and normal anterior vocal cords. g,h, Retardance (g) and depolarization (h) values within the cancerous and normal anterior vocal cord. In the box plots, the red centre line denotes the median value and the blue box shows the 25th and 75th percentiles of the dataset. The black whiskers mark the non-outlier minimum and non-outlier maximum. P values were calculated via a two-sided Mann–Whitney U test for two group comparison. i, RMS contrast between the cancerous and normal anterior vocal cords in terms of retardance and depolarization revealed by the SPE and hue and saturation shown in WLE. j,k, White-light microscopy (j) and polarization microscopy (k) of the tissue slices in the left anterior vocal cord diagnosed as cancerous (SCC). Scale bar, 100 μm. For consecutive SPE imaging of this case, please refer to Supplementary Videos 5 and 6. Source data

References

    1. Steuer CE, El-Deiry M, Parks JR, Higgins KA, Saba NF. An update on larynx cancer. CA Cancer J. Clin. 2017;67:31–50. doi: 10.3322/caac.21386. - DOI - PubMed
    1. Riu Pons F, et al. Narrow-band imaging and high-definition white-light endoscopy in patients with serrated lesions not fulfilling criteria for serrated polyposis syndrome: a randomized controlled trial with tandem colonoscopy. BMC Gastroenterol. 2020;20:111. doi: 10.1186/s12876-020-01257-4. - DOI - PMC - PubMed
    1. Lier MCI, et al. Comparison of enhanced laparoscopic imaging techniques in endometriosis surgery: a diagnostic accuracy study. Surg. Endosc. 2020;34:96–104. doi: 10.1007/s00464-019-06736-8. - DOI - PMC - PubMed
    1. Menon S, Dhar A, Hoare J, Trudgill N. How commonly is gastric cancer missed at endoscopy: a UK primary care based study. Gut. 2012;61:A43. doi: 10.1136/gutjnl-2012-302514a.98. - DOI
    1. Kraft M, Betz CS, Leunig A, Arens C. Value of fluorescence endoscopy for the early diagnosis of laryngeal cancer and its precursor lesions. Head Neck. 2011;33:941–948. doi: 10.1002/hed.21565. - DOI - PubMed

Publication types

MeSH terms