. 2023 May;26(5):798-809.
doi: 10.1038/s41593-023-01296-6. Epub 2023 Apr 3.

Neural dynamics underlying associative learning in the dorsal and ventral hippocampus

Affiliations

Neural dynamics underlying associative learning in the dorsal and ventral hippocampus

Jeremy S Biane et al. Nat Neurosci. 2023 May.

Abstract

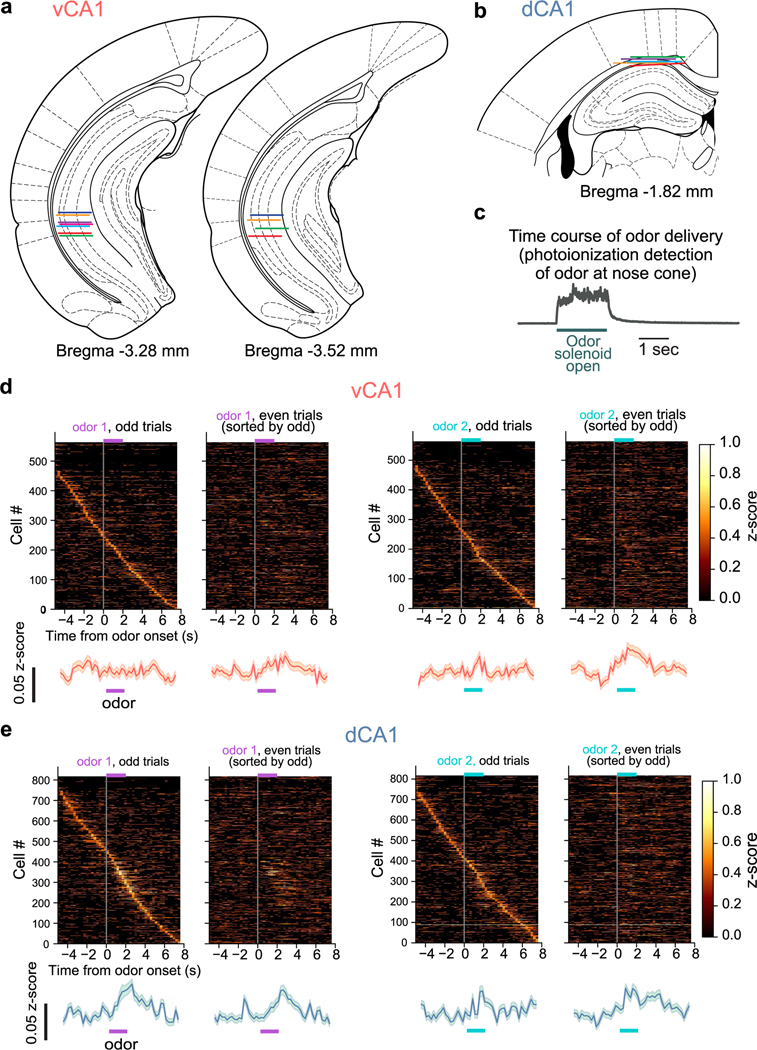
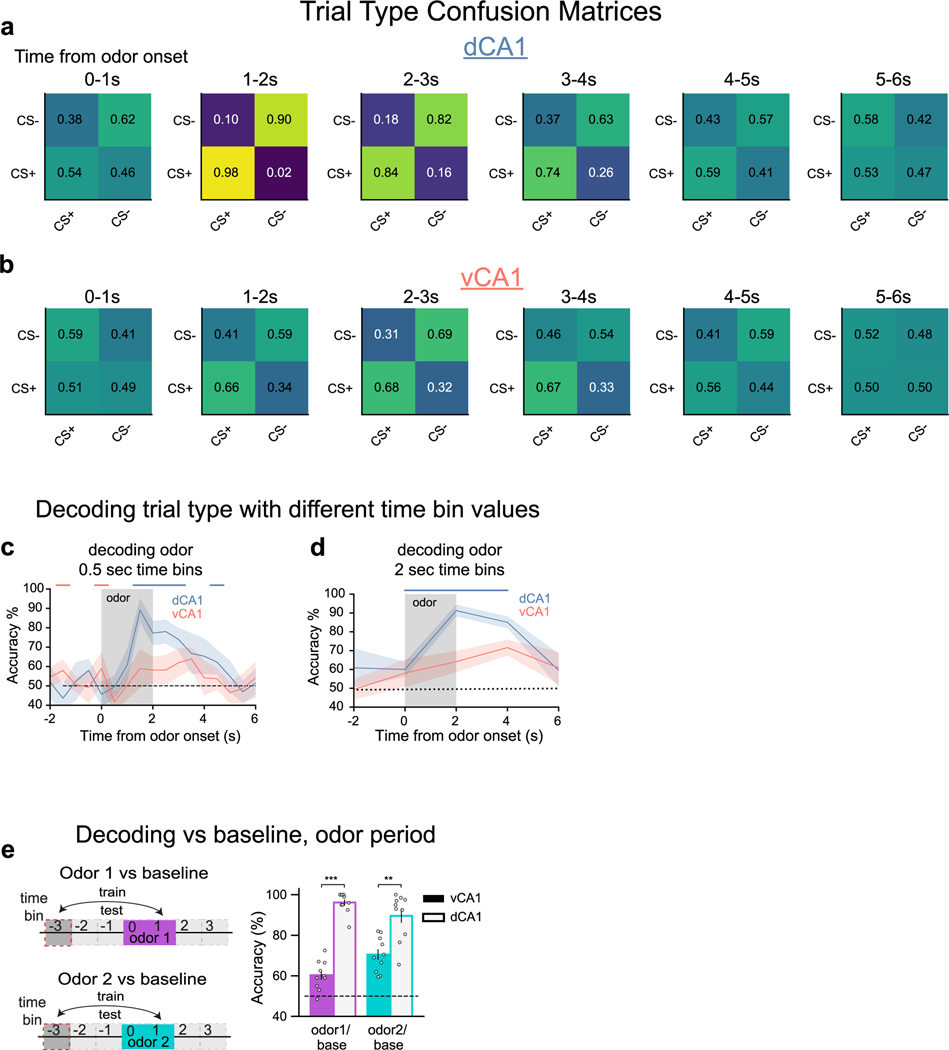
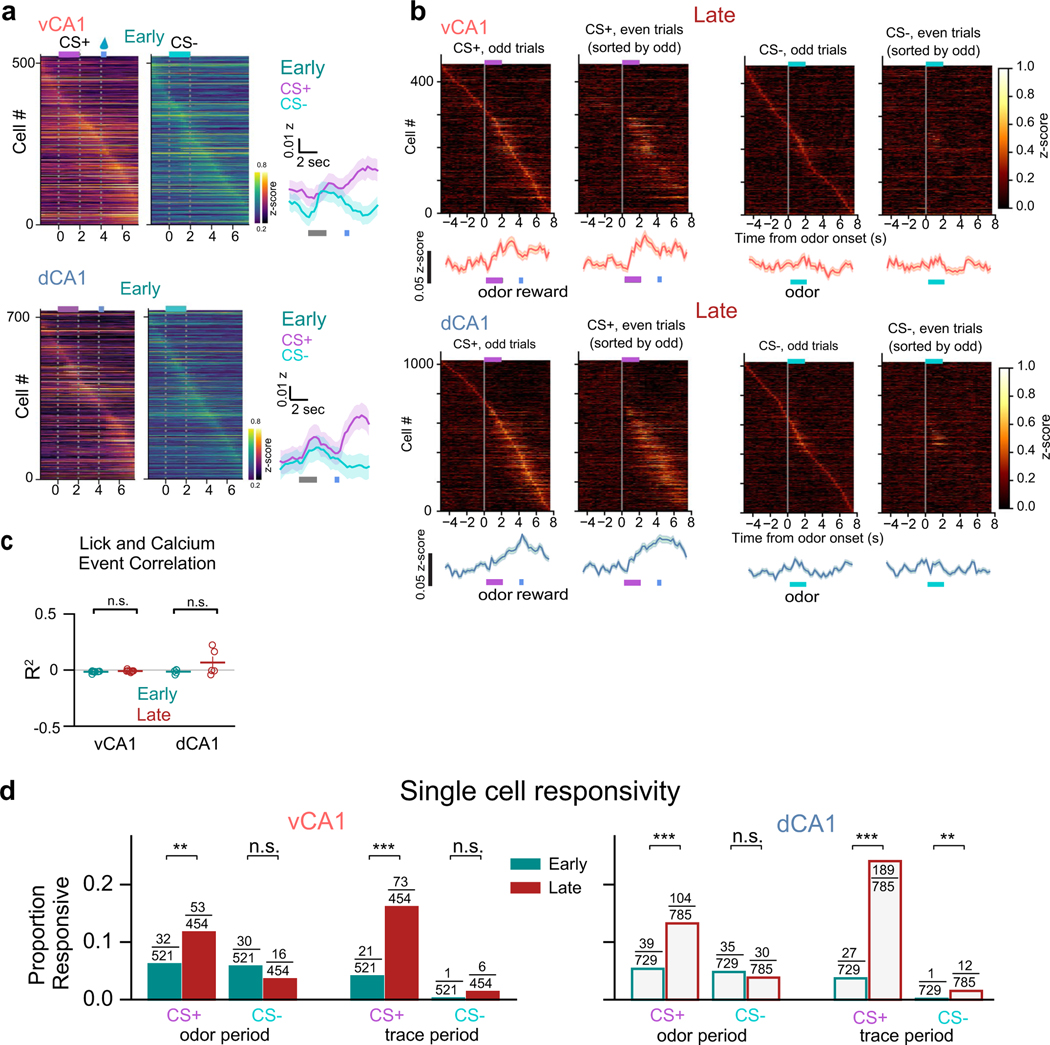
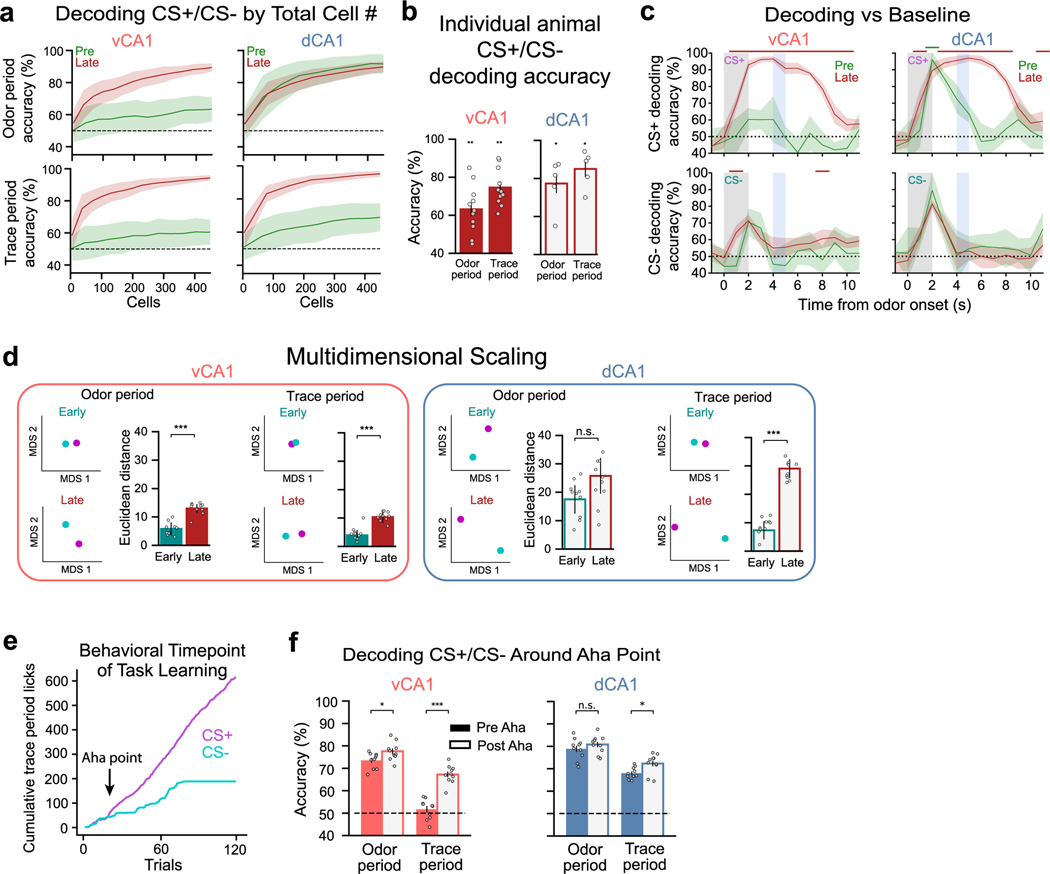
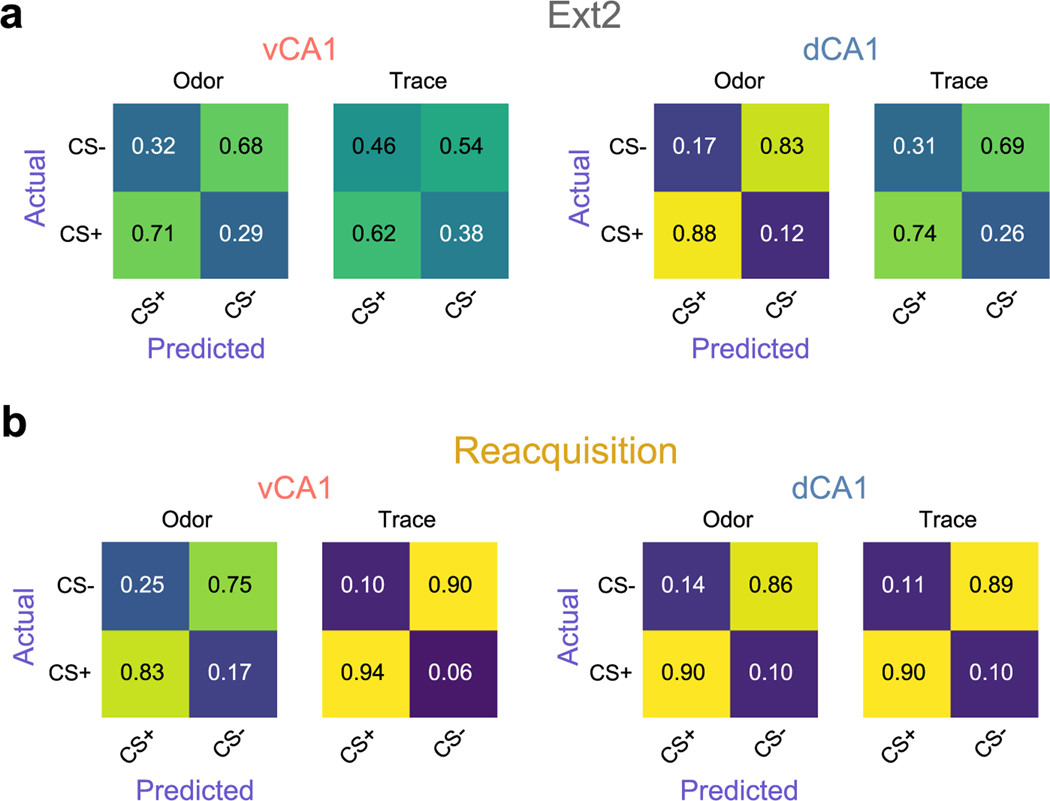
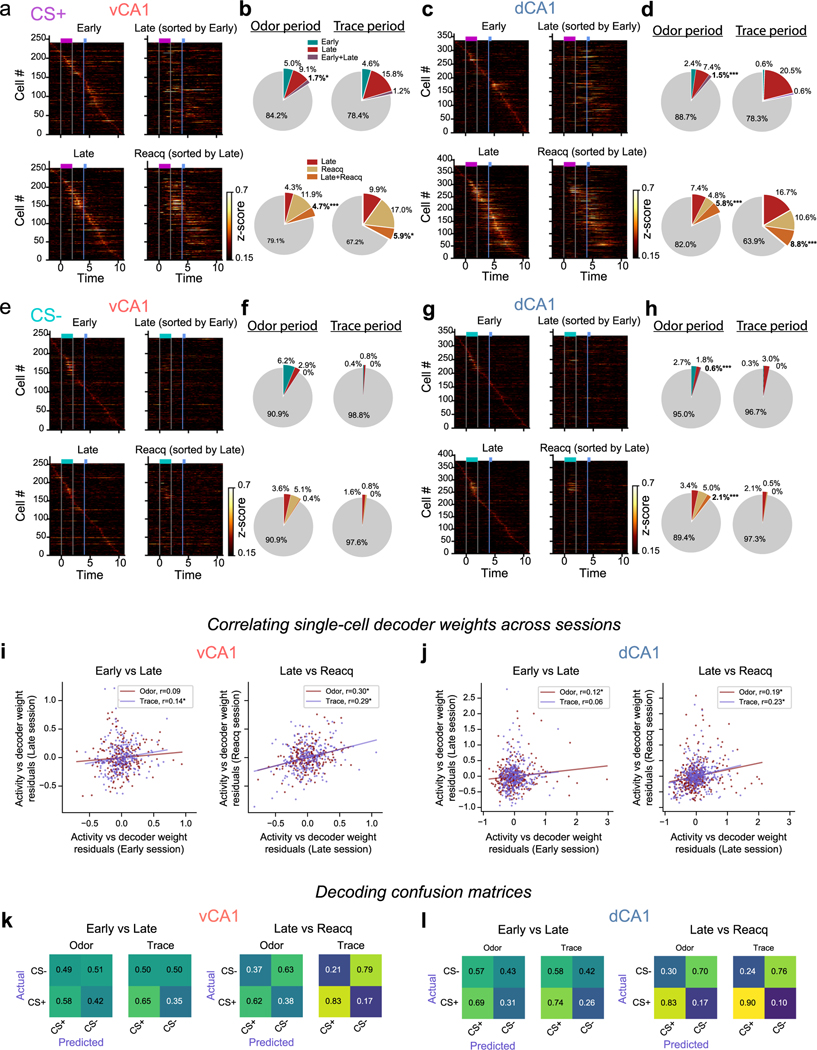
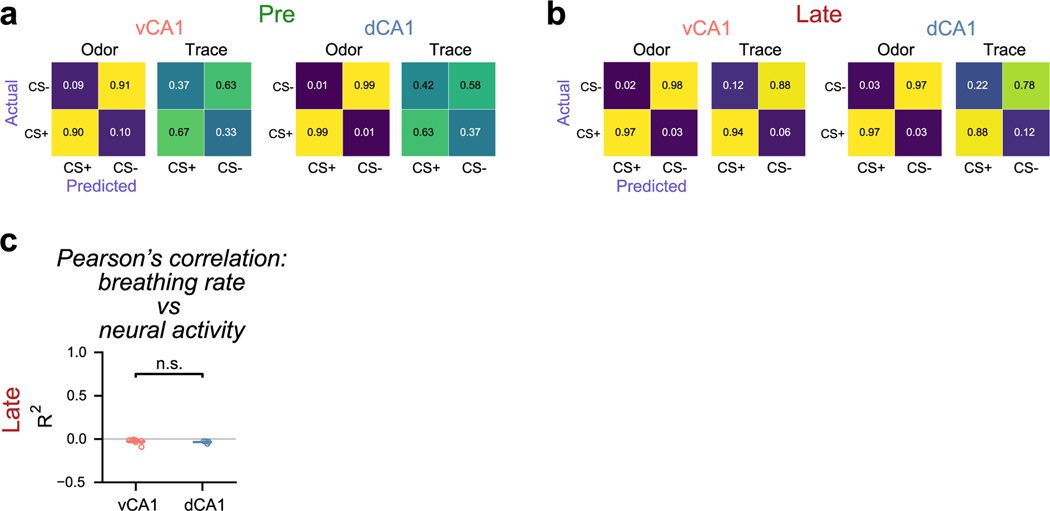
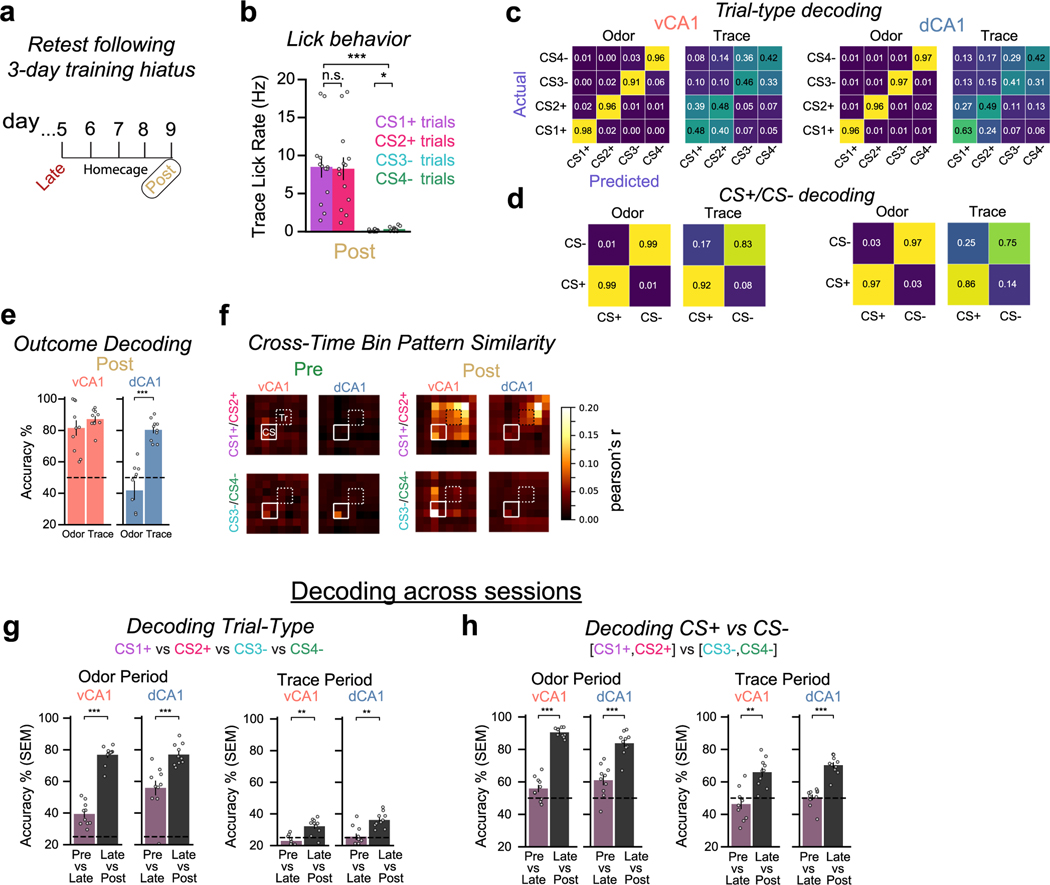
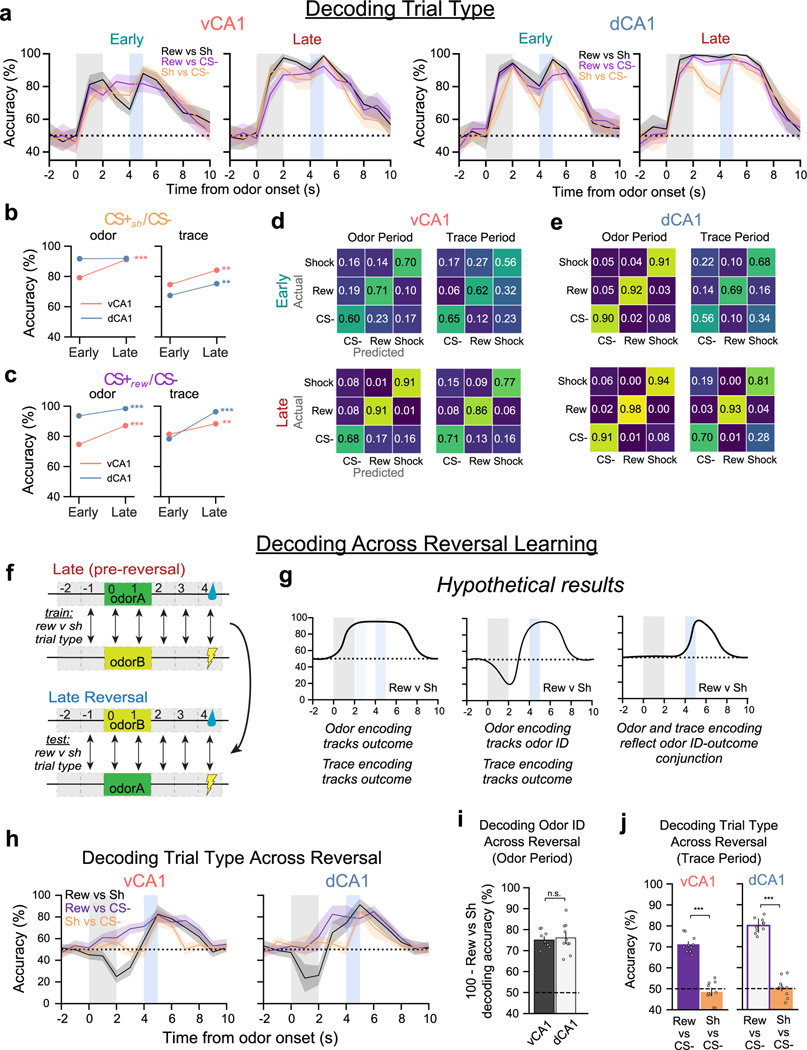
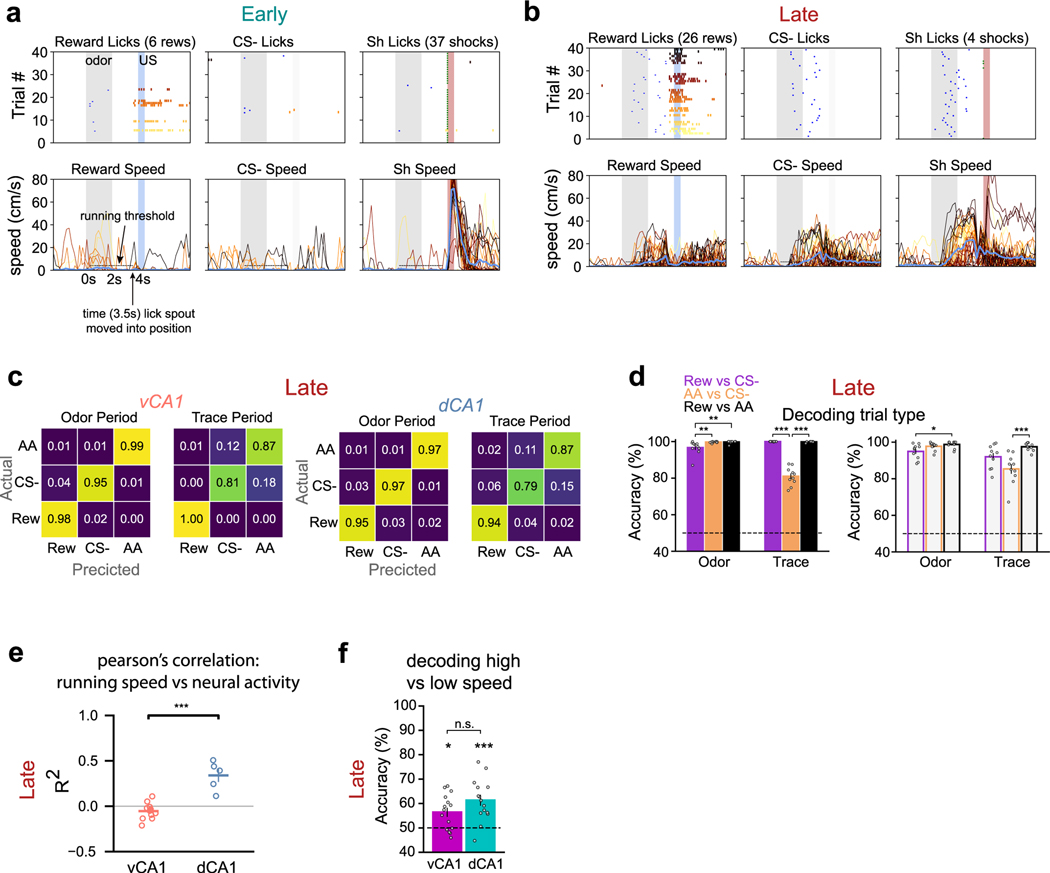
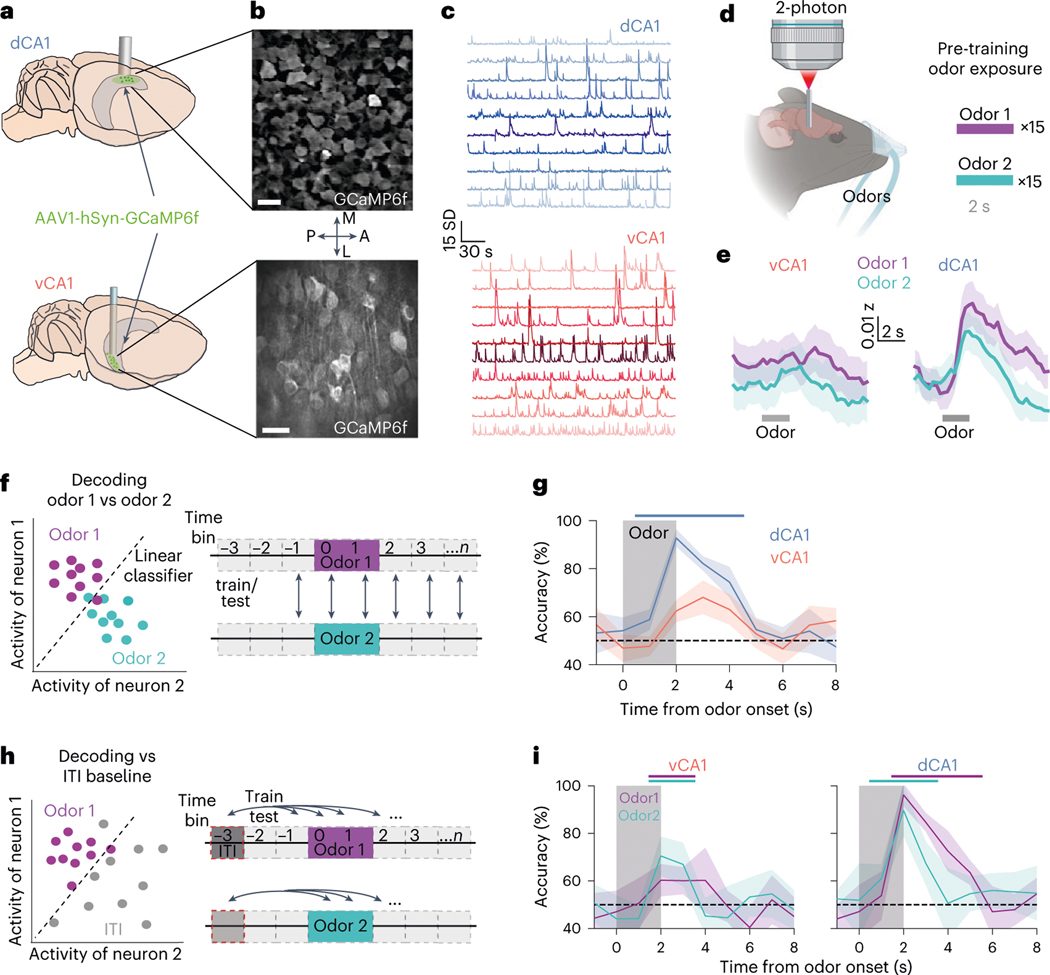
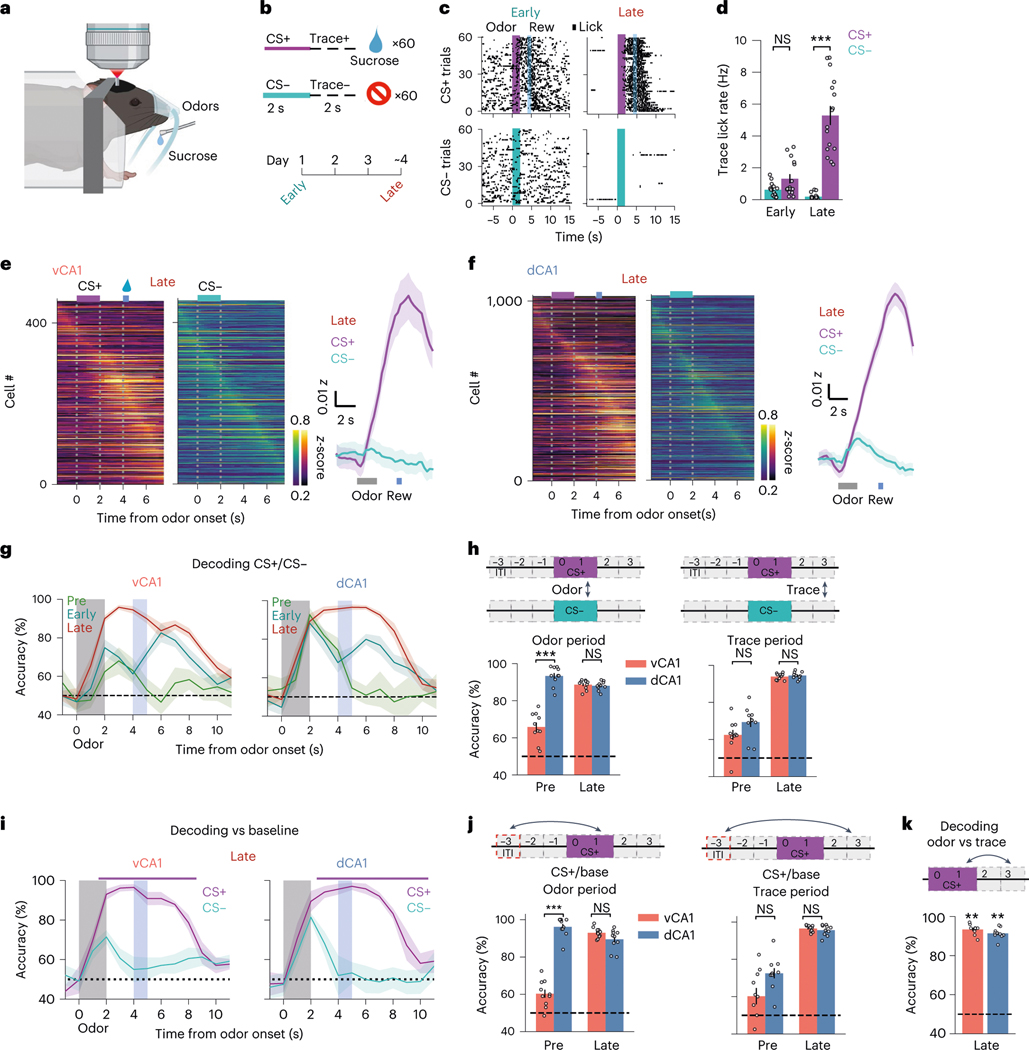
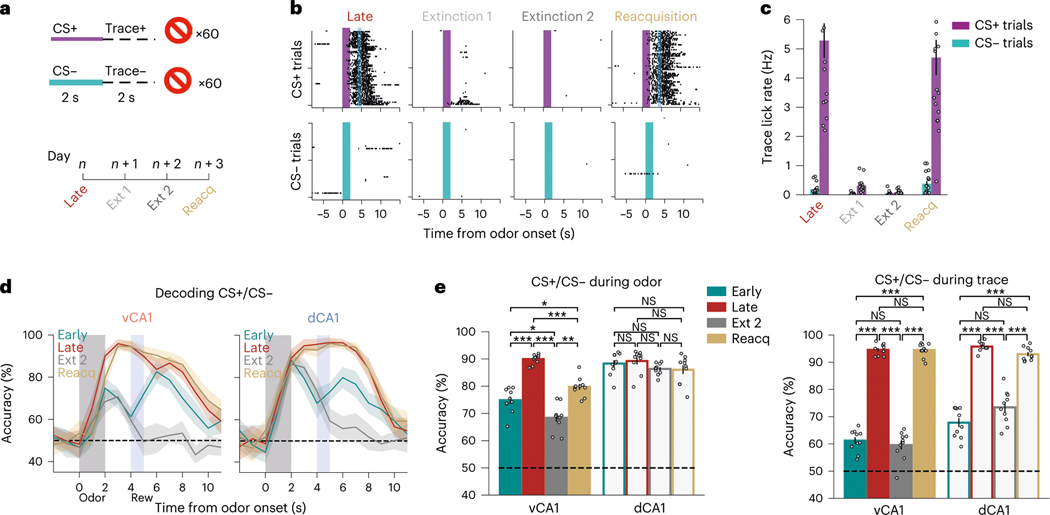
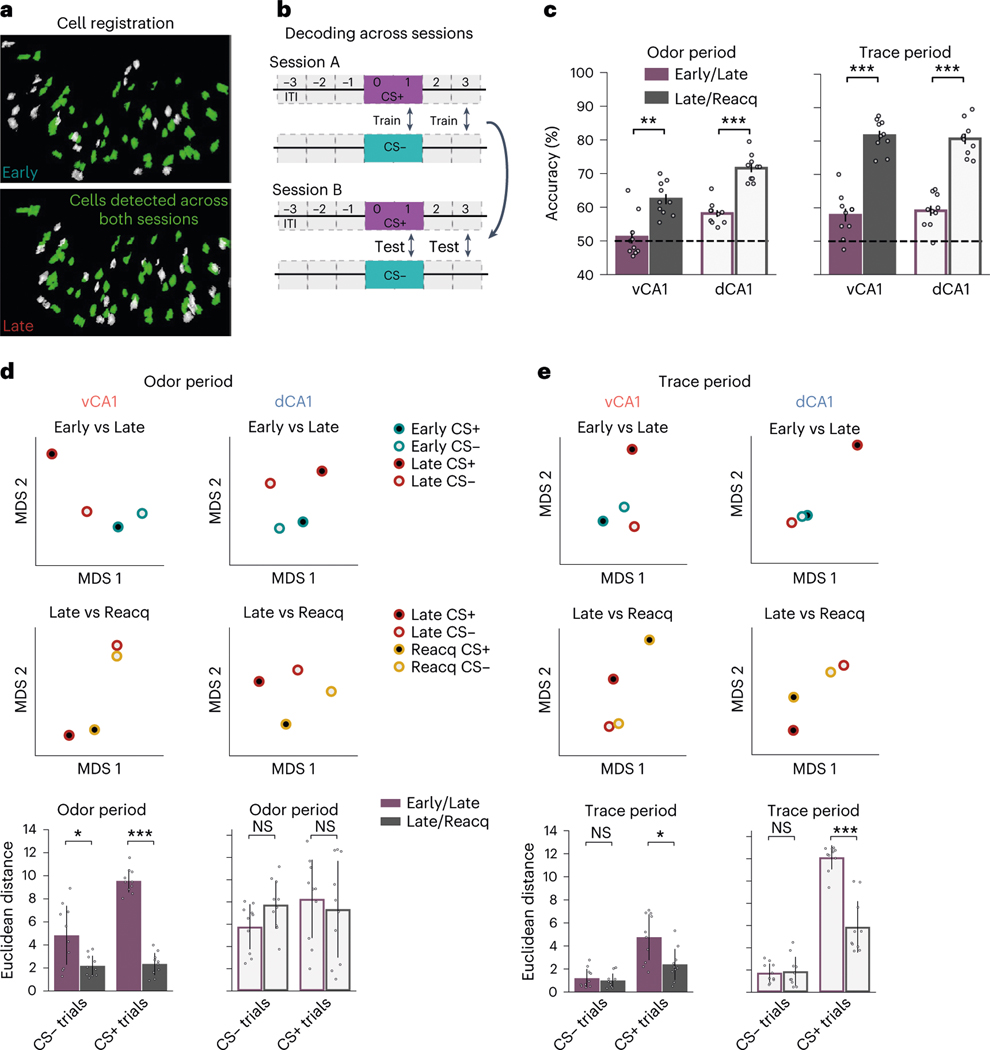
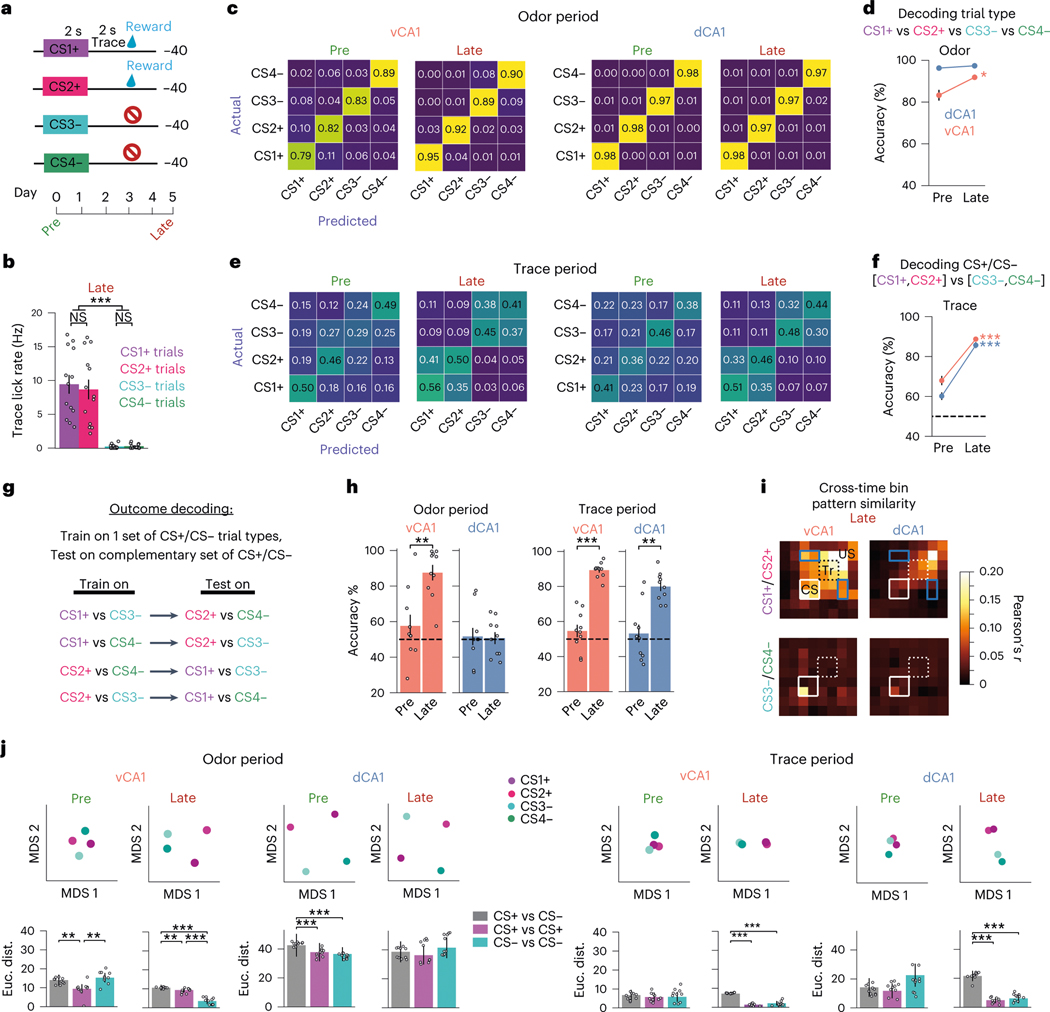
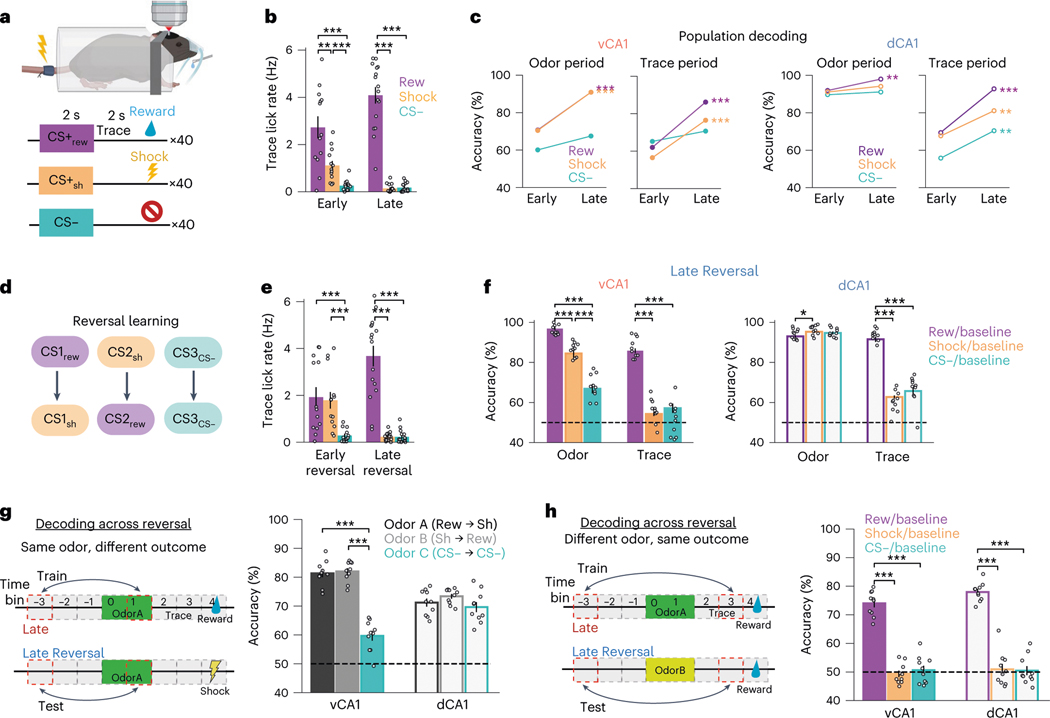
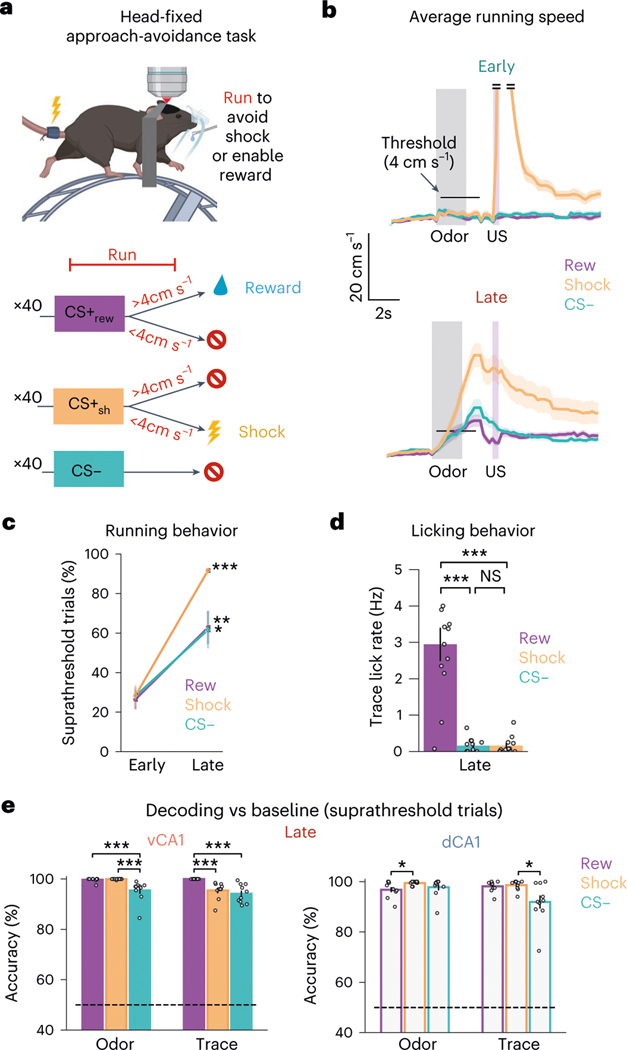
Animals associate cues with outcomes and update these associations as new information is presented. This requires the hippocampus, yet how hippocampal neurons track changes in cue-outcome associations remains unclear. Using two-photon calcium imaging, we tracked the same dCA1 and vCA1 neurons across days to determine how responses evolve across phases of odor-outcome learning. Initially, odors elicited robust responses in dCA1, whereas, in vCA1, odor responses primarily emerged after learning and embedded information about the paired outcome. Population activity in both regions rapidly reorganized with learning and then stabilized, storing learned odor representations for days, even after extinction or pairing with a different outcome. Additionally, we found stable, robust signals across CA1 when mice anticipated outcomes under behavioral control but not when mice anticipated an inescapable aversive outcome. These results show how the hippocampus encodes, stores and updates learned associations and illuminates the unique contributions of dorsal and ventral hippocampus.


Conflict of interest statement

Competing interests

The authors declare no competing interests.

Figures

Extended Data Fig. 1 |
Extended Data Fig. 1 |. Implant localization and pre-training neural activity.
a, b. Reconstructed GRIN lens implant locations for all vCA1 (A) and dCA1 (B) animals used in odor-based studies. Colored lines indicate the estimated location of the lens impression left on the tissue. Atlas images adapted from. c. Time course of odor presence at the nose cone. d. Cross-validated neural activity during the Pre session. Each trial type (odor1 or odor2) was separated into odd and even trials, and vCA1 neural activity was z-scored. For each time bin, z-scores were averaged across all trial subsets, and sorted by peak firing rate latency during odd trials. Line is population mean, shading is ±SEM. e. same as d, but for dCA1.
Extended Data Fig. 2 |
Extended Data Fig. 2 |. Population decoding of odor presentations prior to training.
a, b. Decoding confusion matrices. Actual trial type is on y-axis, trial type predicted by classifier is denoted by x-axis. Odor delivery period = 0–2 s; trace period = 2–4 s; sucrose delivery = 4 s (CS+trials only). c, d. Decoding trial type when using different time bin durations over which cell activity is averaged. Regardless of time bin duration used, dCA1 shows significantly higher decoding accuracy than vCA1 both during and soon after odor presentation. (n = 10 decoding iterations, n-matched 454 cells from 11 vCA1 and 5 dCA1 mice, two-sided Mann-Whitney U, color coded bars indicate p < 0.01). e. Odor-period decoding. Population activity during the last second of odor delivery was used to decode odor 1 or odor 2 from baseline. (n = 10 decoding iterations, n-matched 454 cells from 11 vCA1 and 5 dCA1 mice, two-sided Mann-Whitney U, error bars mean ± SEM, ** p < 0.01, *** p < 0.001). See Supplementary Table 1 for all statistical analysis details.
Extended Data Fig. 3 |
Extended Data Fig. 3 |. Learning-related changes in neural activity.
a. (left) Mean z-scored fluorescent signals for all recorded cells during the Early session, ordered by peak time bin. See Fig. 2e, f for Late session. (right) Line is mean, shading is ±SEM). b. Cross-validated neural activity. Each trial type (CS+ or CS-) was separated into odd and even trials, and neural activity was z-scored. For each time bin, z-scores were averaged across all trial subsets, and sorted by peak firing rate latency during odd trials. Population mean is shown directly below heatmap (line is mean, shading is ±SEM). c. Linear regression of lick rates and Ca2+ in vCA1 and dCA1 during Early and Late associative learning sessions (see Methods). We found that neural activity is not significantly correlated to lick rates (n = 11 vCA1 and 5 dCA1 mice, unpaired two-sided t-test, p > 0.05, error bars are mean ± SEM). d. Proportion of responsive cells of the total population whose activity was significantly modulated during odor- or trace-period compared to pre-odor baseline. Fisher’s exact test. Statistical power for the pre-training session (Pre) was too low for meaningful analysis (only 15 trials/trial-type in Pre vs 60 trials/trail-type in Early and Late). (n’s denoted on graph, two sided Fisher’s exact test, ** p < 0.01, *** p < 0.001,) See Supplementary Table 1 for all statistical analysis details.
Extended Data Fig. 4 |
Extended Data Fig. 4 |. Learning-related changes in population decoding.
a. Relationship between trial-type decoding accuracy and total number of cells (line is mean, shading is ±SD). b. Trial-type decoding accuracy for individual animals during the Late session. (n = 11 vCA1 mice, 5 dCA1, two-sided Mann-Whitney U test vs chance, error bars mean ± SEM). c. Population-activity decoding accuracy for CS+ or CS- trials from baseline (n = 10 decoding iterations from n-matched of 454 cells from 11 vCA1 and 5 dCA1 mice, two sided Mann-Whitney U test, color coded bar is p < 0.01, line is mean, shading is ±SD). d. Visualization of population activity pattern similarity for CS + and CS- trials via MDS dimensionality reduction. Dot plots show a sample MDS run, bar charts plot the average of 10 runs (n = 10 MDS iterations, two sided Mann-Whitney U test, error bars mean ± SEM). e. Sample cumulative licking during the trace period for CS+ and CS- trials from the Early and second day of learning. The Aha point, in this example at trial 20, represents the first moment the difference between the cumulative licking in CS+ and CS- trials exceeded the learning threshold (see Methods). f. Trial-type decoding accuracy during odor or trace periods using 30 CS+ and CS- trials before and after the Aha point. In vCA1, decoding accuracy significantly increases after the aha point for the odor and trace periods (n = 11 vCA1 5 dCA1 mice, two sided Mann-Whitney U test). Before the aha point, decoding during trace is not significantly different from chance (n = 11 vCA1 5 dCA1 mice, two-sided Wilcoxon test, p > 0.05). In dCA1, aha decoding does not significantly increase during the odor period and increases by a small but significant amount during trace period (n = 11 vCA1 5 dCA1 mice,two sided Mann-Whitney U test). dCA1 trace period decoding before the aha point is already significantly above chance (n = 11 vCA1 5 dCA1 mice, two-sided Wilcoxon test, p < 0.05). Error bars mean ± SEM. * p < 0.05, ** p < 0.01, *** p < 0.001. See Supplementary Table 1 for statistical analysis details.
Extended Data Fig. 5 |
Extended Data Fig. 5 |. Confusion matrices for extinction and reacquisition sessions.
Decoding confusion matrices for Extinction day 2 (a) and Reacquisition sessions (b).
Extended Data Fig. 6. |
Extended Data Fig. 6. |. Tracking Single-cell and population dynamics across training reveals stability of task encoding accompanies learning.
a, c. Activity during CS+ trials for neurons registered across specific session pairs. For each time bin, activity z-scores for each neuron were averaged across all trials within a session, and neurons were sorted by peak firing rate latency during the indicated session. b, d. Quantification of cells with increased responsiveness to different task epochs. Individual cells show high remapping of responsiveness to CS+ task epochs across Early and Late sessions, but increased stability from Late to Reacquisition. Proportion of cells responsive across two sessions was compared to the expected distribution of overlap based on the proportion of responsive cells in each individual session (n = 241 cells from 11 vCA1 mice and 337 cells from 4 dCA1 mice for Early vs Late and n = 253 cells from 10 vCA1 mice and 377 cells from 5 dCA1 mice for Late vs Reacquisition. Level of significance for 10,000 shufflings). e-h. Same as in a-d, but for CS- trials (n = 241 cells from 11 vCA1 mice and 337 cells from 4 dCA1 mice for Early vs Late and n = 253 cells from 10 vCA1 mice and 377 cells from 5 dCA1 mice for Late vs Reacquisition. i, j. Comparison of weights assigned to individual cells during decoding analysis; higher weight indicates greater importance for encoding. As activity is correlated with assigned weight, we plotted weights values after regressing out the components explained by the activity. We find an increased correlation of weight values after learning (Late and Reacquisition) compared to initial training (Early/Late), supporting a stabilization of task representations accompanies learning. (n = 241 cells from 11 vCA1 mice and 337 cells from 4 dCA1 mice for Early vs Late and n = 253 cells from 10 vCA1 mice and 377 cells from 5 dCA1 mice for Late vs Reacquisition, linear least- squares regression ). k, l. Confusion matrices for across-session decoding. * p < 0.05, ** p < 0.01, *** p < 0.001. See Supplementary Table 1 for all statistical analysis details.
Extended Data Fig. 7 |
Extended Data Fig. 7 |. Confusion matrices for CS+ vs CS- trial type classification and breathing correlations.
a, b. Confusion matrices for CS+ vs CS- trial type classification. c. Breathing rate was not correlated with calcium event activity in either hippocampal region. Data points represent individual animals (n = 11 vCA1, 5 dCA1 imaging sessions, unpaired two-sided t-test, p > 0.05, error bars are mean ± SEM). Data taken from Late session. See Supplementary Table 1 for all statistical analysis details.
Extended Data Fig. 8 |
Extended Data Fig. 8 |. Task representations show increased stability with learning following a break in training.
a. In the 2-odor task, Late and Reacquisition sessions were separated by multiple extinction sessions. To assess how task representations may change across a similar time period, but with no additional task experience, following learning of the 4-odor task, mice were kept in their homecage and rerun on the learned task 4 days later (Post). b. Mean lick rate during the trace period for all animals (n = 8 vCA1, 5 dCA1 mice,, two sided Mann-Whitney U test, * p < 0.05, *** p < 0.001, error bars mean ± SEM). c, d. Trial-type and CS+ vs CS- decoding accuracies were similar for the Post session (shown here) compared to Late (Fig. 5c and Extended Data Fig. 7a, b; Analyses used 150 cells for each region). e As in Late session, odor and outcome information were multiplexed in vCA1 during the odor delivery period, while outcome information was present in both vCA1 and dCA1 during trace (n = 10 decoding iterations from n-matched 150 cells from 8 vCA1 and 5 dCA1 mice, two sided Mann-Whitney U test, *** p < 0.001, error bars are mean ± SEM). f. Pearson’s correlation of activity patterns across time bins. g. Task representations showed greater stability once learned. Analyses used cells registered across all 3 sessions. (n = 10 decoding iterations from n-matched 100 cells from 8 vCA1 and 5 dCA1 mice, two sided Mann-Whitney U test, * p < 0.05, ** p < 0.01, *** p < 0.001, error bars are mean ± SEM). h. Same as in g, but decoding CS+ vs CS- across sessions. See Supplementary Table 1 for all statistical analysis details.
Extended Data Fig. 9 |
Extended Data Fig. 9 |. Odor ID and reward expectation representations remain stable across reversal learning, while shock anticipation signals fade.
a. Trial-type decoding accuracy. Rew = reward trial. Sh = shock trial. (n-matched pseudopopulation of 444 cells from 10 vCA1 and 3 dCA1 mice, line is mean and shading is ±SD). b. Change in odor-period (left) or trace-period (right) decoding accuracies for CS+ shock vs CS- trials from Early to Late sessions (±SEM). Statistics compare Early and Late sessions for a specific hippocampal region (Mann-Whitney U test). n = 10 decoding iterations from n-matched pseudopopulation of 444 cells from 10 vCA1 and 3 dCA1 mice, two sided Mann-Whitney U test, * p < 0.05, ** p < 0.01, *** p < 0.001, error bars are mean ± SEM). c. Same as in b but decoding CS+ reward from CS- trials. d, e. Confusion matrices for trial-type decoding accuracy during Early (upper) or Late (lower) sessions. f. Schematic illustrating trial-type decoding across reversal learning. g. Hypothetical results for decoding CS+ reward from CS+ shock trials across reversal learning (for this set of results, stable encoding of US identity across reversal is assumed). Because data classes were labeled with respect to the outcome of a trial, and not the odor identity, stable neural representations of odor identity will manifest as cross-session decoding accuracies that are below chance (middle graph). h. Actual results for decoding trial type across reversal learning. The below chance decoding accuracy for CS+ reward vs CS+ shock during the odor period indicates representations of odor identity dominate the population activity during this time. (n-matched pseudopopulation of 281 cells from 10 vCA1 and 3 dCA1 mice, line is mean and error bars are ±SD). i-j. Across-reversal odor ID decoding accuracy during the odor period (i) and trial type during trace period ( j) (n-matched pseudopopulation of 281 cells from 10 vCA1 and 3 dCA1 mice, two sided Mann-Whitney U test, *** p < 0.001, error bars are mean ± SEM). See Supplementary Table 1 for all statistical analysis details.
Extended Data Fig. 10 |
Extended Data Fig. 10 |. Headfixed active avoidance task results.
a. Lick (top) and running (bottom) behavior from an example mouse during the first day of training. Trial number is color-coded, yellow to black. During the first day of training, the mouse had very few trials with suprathreshold running, leading to few rewards and numerous shock deliveries. Shock delivery resulted in rapid, transient running. Vertical grey bar = odor delivery period; vertical blue/red bar = time of sucrose/shock delivery onset (on applicable trials). Blue ticks = time point when running exceeded threshold. Green ticks denote trials where shock was delivered. Light blue trace = average running speed. Sh = shock odor trial. b. Same as in a, but Late session for the same mouse. c. Confusion matrices for Late session, suprathreshold trials, n = 340 cells from vCA1 and dCA1. d. Pairwise decoding for trial type. While active avoidance trials are well discriminated from rewarded trials, decoding accuracy was lower for AA vs CS- trials during the trace period (n-matched pseudopopulation of 340 cells from 8 vCA1 and 4 dCA1 mice, two sided Mann-Whitney U test, * p < 0.05, ** p < 0.01, *** p < 0.001, error bars are mean ± SEM). e. Running was not correlated with vCA1 neural activity, but was moderately correlated with dCA1 activity (±SEM, Mann-Whitney U test). Data are from Late session. (n = 11 vCA1, 5 dCA1 imaging sessions, unpaired two-sided t-test, *** p < 0.001, error bars are mean ± SEM). f. To further assess how running may have contributed to our results, we trained a linear classifier to decode high vs low speed running trials during time bins outside of the task (5–10 seconds post odor delivery). While running speed could be decoded above chance in both regions, decoding was relatively weak. Significance stars above individual bars report significance level versus 50% chance decoding accuracy (n = 5 time bins,, two sided Wilcoxon signed-rank test, * p < 0.05, *** p < 0.001 error bars are mean ± SEM). See Supplementary Table 1 for all statistical analysis details.
Fig. 1 |
Fig. 1 |. Before conditioning, odor stimuli are more strongly represented in dCA1 versus vCA1.
a, AAV expressing GCaMP6f was targeted to dCA1 or vCA1, and a GRIN lens was implanted above the injection site. b,c, Sample FOVs demonstrating GCaMP expression (b) and time series (c) data of denoised fluorescent traces. Scale bar in b = 25 μm. d, Calcium signals were imaged while mice received 30 trials of 2-second odor exposures (15 of each odor). e, Population mean (±s e.m.) of z-scored fluorescent signals occurring around the onset of odor 1 (purple) or odor 2 (cyan). Gray bar is the odor delivery period. n = 11 vCA1 and 5 dCA1 mice. f, Left: simplified schematic of decoding procedure with two neurons. Dots represent the single-trial ‘population’ activity vector during odor delivery. Linear classifiers were trained to distinguish population activity patterns during odor 1 trials versus odor 2 trials for each 1-second time bin. g, Decoding accuracy for odor 1 versus odor 2 trials (line is mean; shading is ±s d ). Colored-coded bar denotes time bins where accuracy is significantly higher for dCA1 compared to vCA1 (P < 0.01, two-sided Mann–Whitney U-test; n = 10 decoding iterations using 454 cells for each region). See Supplementary Table 1 for all statistical analysis details. h, Left: decoding schematic. Dots represent the single-trial ‘population’ activity vector during baseline (gray) or odor delivery (purple) periods. Right: Linear classifiers were trained to distinguish population activity patterns occurring during baseline from those occurring at time bin t. i, Same as g above but decoding versus baseline for each time bin t (line is mean; shading is ±s.d.). Color-coded bars above graphs denote time bins for each odor where decoding accuracy is significantly greater than chance (P < 0.01, two-sided Mann–Whitney U-test; n = 10 decoding iterations from n-matched 454 cells). Although there was no difference in how well each odor could be discriminated from baseline activity for dCA1, we did observe a significant difference between odors for vCA1 (dCA1: Mann–Whitney U-test = 70 5, P = 0 13; vCA1: Mann–Whitney U-test = 18, P = 0.017). AAV, adeno-associated virus.
Fig. 2 |
Fig. 2 |. Discrimination training enhances task representations.
a,b, Task schematics. Calcium activity was imaged during learning of an odor discrimination task. c, Lick rasters for an individual animal across learning. d, Mean lick rates during the 2-second pre-reward (trace) period for all animals (n = 16 mice: 11 vCA1, 5 dCA1; two-sided Mann–Whitney U-test; error bars indicate mean ± s.e.m.). e, Left: mean z-scored fluorescent signals for all vCA1 cells during Late session, ordered by peak time bin. See Extended Data Fig. 2a for Early session. Right: population mean (shading indicates ±s.e.m.). f, Same as in e but for dCA1. g, Mean trial type decoding accuracies from ten decoding iterations, using n-matched 454 cells (line indicates mean; shading indicates ±s d ). Odor delivery period is the vertical gray bar. Sucrose delivery period (CS+ trials only) is the vertical blue bar. Odor-period encoding selectively increases in vCA1, whereas trace period representations increase in both vCA1 and dCA1. h, Decoding accuracies for CS+ versus CS− during odor (left) or trace (right) periods (n = 10 decoding iterations from n-matched 454 cells; two-sided Mann–Whitney U-test; error bars indicate mean ± s.e.m.). i, Decoding accuracies for each trial type versus ITI baseline (line indicatees mean; shading indicates ±s d ). Color-coded bar above shows periods where the CS+ decoding accuracy versus baseline is significantly greater than that of CS− (P < 0.01; two-sided Mann–Whitney U-test; n = 10 decoding iterations using 454 cells). Note the low decoding accuracy for CS− trials during the odor period in vCA1 animals, suggesting that trial type decoding in g is largely being driven by increased responsiveness to the behaviorally meaningful CS+ trials. j, Same as h but decoding CS+ versus ITI baseline (n = 10 decoding iterations using n-matched 454 cells; two-sided Mann–Whitney U-test; error bars indicate mean ± s.e.m.). k, Decoding results for distinguishing odor-versus trace period-activity (mean ± s.e.m.; two-sided Mann–Whitney U-test; n = 10 decoding iterations using 454 cells). Population activity patterns during odor and trace periods could be well distinguished from one another in both areas. *P < 0.05, **P < 0.01, ***P < 0.001. See Supplementary Table 1 for all statistical analysis details. NS, not significant.
Fig. 3 |
Fig. 3 |. Learned odor representations are sensitive to extinction but can be rapidly reinstated.
a, Task schematic. After acquisition of the cue–outcome discrimination task, mice were run through 2 days of extinction training where reward was omitted from all trials. The next day, animals underwent a Reacquisition session where the odor–sucrose contingency was restored. b, Lick rasters from an individual animal. Mice displayed a near absence of licking during the second day of extinction training and rapid resumption of anticipatory licking during the Reacquisition session, illustrating an intact memory of the task structure. c, Mean trace period lick rates (error bars ± s.e.m.) across all animals (n = 11 vCA1 and 5 dCA1). d, Trial-type decoding accuracies (mean of ten decoding iterations; line indicates mean; shading indicates ±s.d.). Analyses used 454 cells for each region. Early and Late are as in Fig. 2g and are shown for reference. e, Trial-type decoding accuracies during odor (left) or trace (right) periods (n = 10 decoding iterations using n-matched 454 cells; two-sided Mann–Whitney U-test; error bars indicate mean ± s.e.m.). Odor period decoding accuracy tracked with odor value in vCA1 but not in dCA1. Trace period accuracy tracked reward expectation in both hippocampal regions. *P < 0.05, **P < 0.01, ***P < 0.001. See Supplementary Table 1 for all statistical analysis details. NS, not significant.
Fig. 4 |
Fig. 4 |. Task representations stabilize with learning.
a, Example of cells from the same FOV registered across Early and Late sessions. b, Across-session trial-type decoding schematic. A linear decoder was trained to discriminate CS+ versus CS− population activity during one session (session A), and classification accuracy was tested using CS+ and CS− activity patterns from a different session (session B). The reciprocal direction (train on session B, test on session A) was also analyzed, and final decoding results reflect the average of both directions. c, Across-session decoding results (n = 10 decoding iterations from n-matched 241 cells; two-sided Mann–Whitney U-test; error bars indicate mean ± s.e.m.). Decoding performance is significantly higher for odor and trace periods after task acquisition (Late/Reacquisition) versus during learning (Early/Late), indicating a stabilization of task representations after learning. Despite high odor period decoding accuracy in dCA1 for Early and Late sessions individually (Fig. 3e), decoding across these sessions was comparatively low. Thus, although dCA1 activity distinguishes odors robustly at all training points, odor representations are transformed with learning. d, To analyze within-session and across-session similarity between trial-type population activity patterns, we projected the hyper-dimensional neural data onto two-dimensional space via MDS (Methods). Here, the relationship between activity patterns is represented in geometrical space; the closer two points are in space, the more similar their activity patterns are. Top: two-dimensional dot plots showing an individual MDS run. Bottom: average Euclidean distance between specified points. In vCA1, CS+ odor representations show considerable transformation with initial learning (Early/Late) but then largely stabilize (Late/Reacquisition), whereas CS− odor representations show comparatively little change with learning. dCA1 odor representations fluctuate across all sessions (n = 10 MDS runs; two-sided Mann–Whitney U-test with Bonferroni correction; error bars indicate mean ± s d ). e, As d but for trace period. CS− trace representations show little change with learning, whereas CS+ representations show large initial changes with learning that then stabilize (n = 10 MDS runs; two-sided Mann–Whitney U-test with Bonferroni correction; error bars indicate mean ± s d ). *P < 0.05, **P < 0.01, ***P < 0.001. See Supplementary Table 1 for all statistical analysis details. NS, not significant.
Fig. 5 |
Fig. 5 |. Individual odor representations dominate dCA1, whereas vCA1 incorporates information about future outcome. Both regions represent anticipated outcome during the trace period.
a, Four-odor task schematic. b, Mean trace period lick rates during the Late session (n = 13 mice: 8 vCA1, 5 dCA1; two-sided Mann–Whitney U-test; error bars indicate mean ± s.e.m.). c, Confusion matrices for decoding trial type (150 cells per region). The y axis is the true trial type, and the x axis is predicted. The ascending diagonal is the correct classification, and other entries are incorrectly identified as the corresponding trial type. d, Average trial-type classification accuracy during odor was unchanged with learning in dCA1 but increased in vCA1 (n = 10 decoding iterations using n-matched 150 cells; two-sided Mann–Whitney U-test; error bars indicate mean ± s.e.m.). Statistical analyses compared Pre versus Late for each region. e, Same as in c but decoding using trace period activity patterns. Unlike the odor period, there is an increased incidence of parallel trial types (for example, CS1+ and CS2+) being confused during trace, indicative of similar representations. f, CS+ trial types could be better discriminated from CS− trial types with learning in both vCA1 and dCA1 (n = 10 decoding iterations using n-matched 150 cells; two-sided Mann–Whitney U-test; error bars indicate mean ± s.e.m.). g, A linear classifier was trained to discriminate activity between reward-predictive and non-predictive trial types (for example, CS1+ versus CS3−) and then tested using data from the complementary trial types (CS2+ and CS4−). h, Mean decoding accuracy for all combinations of trial type (n = 10 decoding iterations using n-matched 150 cells; two-sided Mann–Whitney U-test; error bars indicate mean ± s.e.m.). i, Pearson’s correlation of activity patterns across CS+ (top) or CS− (bottom) trials. White box denotes odor; dashed box denotes trace. vCA1 displayed elevated pattern similarity between CS1+ and CS2+ trials that spanned across all task time bins. Blue boxes denote the data points that report similarity between odor period and sucrose representations. j, Visualization of within-session pattern similarities via MDS. Top: example MDS run. Bottom: average (n = 10 MDS runs; two-sided Mann–Whitney U-test; error bars indicate mean ± s.e.m.). After training, trace period representations cluster into groups based on trial type. *P < 0.05, **P < 0.01, ***P < 0.001. See Supplementary Table 1 for all statistical analysis details. NS, not significant.
Fig. 6 |
Fig. 6 |. Aversive conditioning and reversal learning.
a, Task schematic. Three odors predicting sucrose reward (CS+rew), inescapable tail shock (CS+sh) or nothing. b, Mean trace period lick rates (n = 13: 10 vCA1, 3 dCA1 mice; two-sided Mann–Whitney U-test with Bonferroni correction; error bars indicate mean ± s.e.m.). c, Comparison of trial-type decoding accuracy for Early and Late sessions (n = 10 decoding iterations using n-matched 444 cells; two-sided Fisher’s exact test). Statistics comparisons reflect Early versus Late decoding accuracies (±s.e.m., Mann–Whitney U-test). See Extended Data Fig. 9 for confusion matrices. Odor period changes mirrored those of the two-odor task, showing increased decoding accuracy for odors with learned value. Interestingly, trace period analysis showed that decoding accuracy was lower for CS+sh trials compared to CS+rew. d, Reversal learning schematic. The identity of odors predicting sucrose and shock was swapped, whereas CS− odor remained the same. e, Mean trace lick rates across all animals (n = 13 mice: 10 vCA1, 3 dCA1; two-sided Mann–Whitney U-test with Bonferroni correction; error bars indicate mean ± s.e.m.). f, Within-session decoding accuracies for each trial type versus baseline during odor (left) or trace (right) periods (n = 10 decoding iterations using n-matched 444 cells; two-sided Mann–Whitney U-test with Bonferroni correction; error bars indicate mean ± s.e.m.). Note the near absence of decoding accuracy above chance during the trace period for CS+sh trials. g, Left: schematic showing cross-session odor versus baseline decoding for a specific odor paired with different outcomes. Right: Cross-session decoding accuracies indicate that an odor’s representation is conserved even when the outcome associated with the odor changes (n = 10 decoding iterations using n-matched 281 cells; two-sided Mann–Whitney U-test with Bonferroni correction; error bars indicate mean ± s.e.m.). h, Decoding during outcome anticipation (trace period) for a specific outcome preceded by different odors. Reward-anticipation-like signals are conserved across different predictive cues, whereas shock anticipatory coding, which is only weakly present in Late Reversal (f), is not (n = 10 decoding iterations using n-matched 281 cells; two-sided Mann–Whitney U-test with Bonferroni correction; error bars indicate mean ± s.e.m.). *P < 0.05, **P < 0.01, ***P < 0.001. See Supplementary Table 1 for all statistical analysis details.
Fig. 7 |
Fig. 7 |. Instrumental control of outcomes increases task-related representations in associative learning.
a, To assess whether the behaviorally irrelevant nature of the inescapable shock contributed to the decoding accuracy differences observed for CS+sh and CS+rew (Fig. 6), we implemented a new task: head-fixed approach-avoidance. Mice running on a wheel could escape shock delivery or enable sucrose delivery if running velocity reached ≥4 cm s−1 during the odor and trace periods. b, Mean task running velocity across all animals for each trial type (n = 12 mice: 8 vCA1, 4 dCA1; line indicates mean; shading indicates ±s d ). c, The percentage of trials with suprathreshold running significantly increased for all trial types from Early to Late sessions (n = 12 mice: 8 vCA1, 4 dCA1; two-sided Mann–Whitney U-test; error bars indicate mean ± s.e.m.). d, Mean trace lick rates across all animals (n = 12 mice: 8 vCA1, 4 dCA1; two-sided Mann–Whitney U-test with Bonferroni correction; error bars indicate mean ± s.e.m.). e, With the shock outcome behaviorally relevant, CS+sh trials can now be decoded from baseline activity with high accuracy during the trace period (n = 10 decoding iterations using n-matched 340 cells; two-sided Mann–Whitney U-test; error bars indicate mean ± s.e.m.). Subthreshold running trials were excluded from analysis. *P < 0.05, **P < 0.01, ***P < 0.001. See Supplementary Table 1 for all statistical analysis details. NS, not significant.

References

    1. Ahmed MS et al. Hippocampal network reorganization underlies the formation of a temporal association memory. Neuron 107, 283–291 (2020). - PMC - PubMed
    1. Stefanini F et al. A distributed neural code in the dentate gyrus and in CA1. Neuron 107, 703–716 (2020). - PMC - PubMed
    1. Fanselow MS & Dong H-W Are the dorsal and ventral hippocampus functionally distinct structures? Neuron 65, 7–19 (2010). - PMC - PubMed
    1. Strange BA, Witter MP, Lein ES & Moser EI Functional organization of the hippocampal longitudinal axis. Nat. Rev. Neurosci 15, 655–669 (2014). - PubMed
    1. Komorowski RW, Manns JR & Eichenbaum H. Robust conjunctive item–place coding by hippocampal neurons parallels learning what happens where. J. Neurosci 29, 9918–9929 (2009). - PMC - PubMed

Publication types