. 2023 Apr 3;6(1):362.
doi: 10.1038/s42003-023-04727-z.

Sub-millisecond conformational dynamics of the A2A adenosine receptor revealed by single-molecule FRET

Affiliations

Sub-millisecond conformational dynamics of the A2A adenosine receptor revealed by single-molecule FRET

Ivan Maslov et al. Commun Biol. .

Abstract

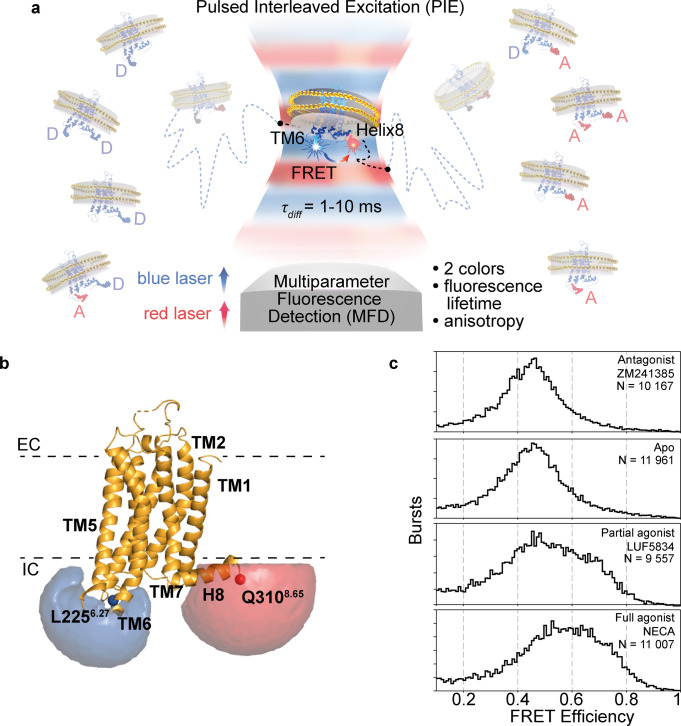
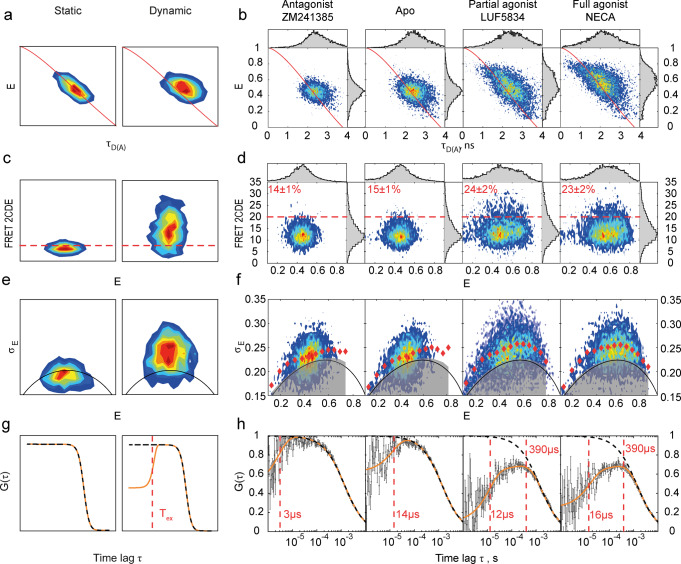
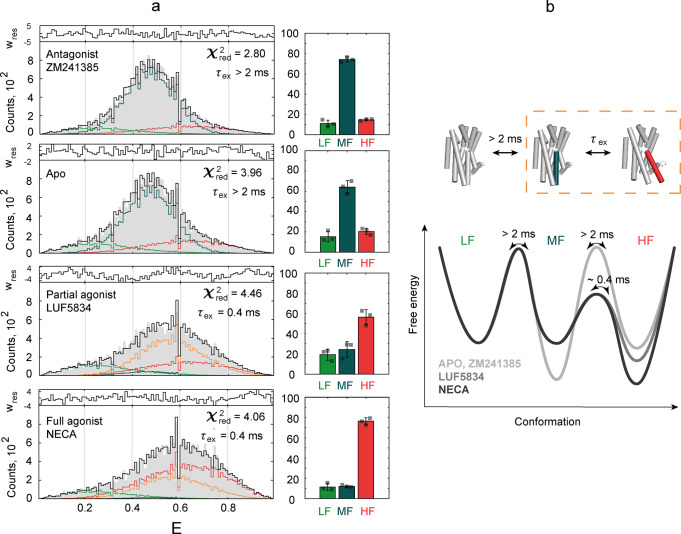
The complex pharmacology of G-protein-coupled receptors (GPCRs) is defined by their multi-state conformational dynamics. Single-molecule Förster Resonance Energy Transfer (smFRET) is well suited to quantify dynamics for individual protein molecules; however, its application to GPCRs is challenging. Therefore, smFRET has been limited to studies of inter-receptor interactions in cellular membranes and receptors in detergent environments. Here, we performed smFRET experiments on functionally active human A2A adenosine receptor (A2AAR) molecules embedded in freely diffusing lipid nanodiscs to study their intramolecular conformational dynamics. We propose a dynamic model of A2AAR activation that involves a slow (>2 ms) exchange between the active-like and inactive-like conformations in both apo and antagonist-bound A2AAR, explaining the receptor's constitutive activity. For the agonist-bound A2AAR, we detected faster (390 ± 80 µs) ligand efficacy-dependent dynamics. Our work establishes a general smFRET platform for GPCR investigations that can potentially be used for drug screening and/or mechanism-of-action studies.


Conflict of interest statement

The authors declare no competing interests.

Figures

Fig. 1
Fig. 1. Agonist-induced conformational changes in A2AAR are revealed by smFRET.
a Schematic illustration of the MFD-PIE smFRET experiment on A2AAR embedded in lipid nanodiscs and stochastically labeled with the donor (Alexa488) and the acceptor (Atto643) fluorescent dyes at TM6 and H8. Eight coexisting labeling variants of A2AAR are shown as shadowed receptors in both sides of the image, “D” and “A” correspond to donor and acceptor dyes, respectively. A2AARs diffuse in solution and stochastically cross the focal spot of an inverted fluorescence microscope. Bursts of fluorescence from donor and acceptor fluorophores are recorded within the 1–10 ms residence time of individual A2AARs crossing the focal spot. Only those receptors labeled with both, donor and acceptor, produce FRET signal. In the PIE approach, two spatially overlapped and alternatingly pulsing lasers are focused by the microscope objective to excite donor and acceptor fluorescence consecutively. Using the MFD approach, fluorescence signals of the donor and acceptor are recorded separately, and the fluorescence lifetime and anisotropy of each dye are determined. b The labeled sites (L2256.27, Q3108.65) and the volume accessible for the dyes (simulated using FPS software) are shown on the A2AAR structure (PDB: 3EML), the extracellular (EC) and intracellular (IC) membrane boundaries are obtained from the PPM web server and shown as dashed lines. c Burst-wise distributions show an agonist-induced increase in FRET efficiency in the double-labeled A2AAR. The number of bursts used for the analysis (N) is given for each condition.
Fig. 2
Fig. 2. Four complementary burst-wise analysis approaches suggest an agonist-induced increase in the sub-millisecond conformational dynamics of A2AAR.
Contour plots are two-dimensional histograms of different fluorescence burst parameter distributions. The qualitative differences between “static” and “dynamic” molecules expected in each analysis approach are shown in the drawings (a, c, e, g). The experimental data for double-labeled A2AAR are shown in the plots (b, d, f, h). a, b The FRET efficiency is plotted against donor fluorescence lifetime. The ‘static FRET’ line is shown in red. A shift of burst distribution to the right from the red line indicates dynamic FRET. c, d The FRET-2CDE dynamics score is plotted against FRET efficiency E. The FRET-2CDE = 20 threshold is indicated as red dashed lines, and the percentage of bursts with FRET-2CDE > 20 is shown in red text (mean ± SD, three technical replicas with different protein aliquots). e, f BVA dynamics scores are plotted against FRET efficiency. Red diamonds show the centers of burst subgroups equally spaced along the FRET efficiency axis. The solid black lines show mean BVA scores, and the transparent gray areas demonstrate 99.9% confidence intervals expected for static molecules, given the shot noise present in the data. g, h The cross-correlation fFCS function is plotted against time lag. Experimental points with error bars are shown in gray; the error bars are SDs obtained after splitting the photon data into ten equally sized bins and correlating each individually. The fitting curves are shown in orange; the diffusion-related terms are shown as dashed black lines; the exchange times derived from the fit are highlighted with vertical red lines. χred2 of the global fit is 1.1. The source data is available online as Supplementary Data 1. The number of fluorescence bursts used for the analysis are the same as for Fig. 1c: 10,167 for ZM241385, 11,961 for apo-state, 9557 for LUF5834, 11,007 for NECA.
Fig. 3
Fig. 3. PDA quantifies parameters of the A2AAR three-state action model by fitting FRET efficiency distributions.
a Experimental distributions of 1-ms-long time bins derived from fluorescence bursts of double-labeled A2AAR (gray area) were fitted with a three-state model. The resulting fit (black line) is a sum of distributions simulated for molecules that stay in the LF (light green line), MF (dark cyan line), or HF (red line) state during the entire simulated time bin, and the distribution for molecules that sample both MF and HF states within the time bin (orange line). The fitting residuals are shown on the top of each panel. The bar charts on the right show relative populations of the three states, with error bars representing SD of n = 3 technical replicas with different protein aliquots. Individual data points are shown as gray squares, source data are available online as Supplementary Data 2. b The three-state action model of A2AAR and corresponding energy landscapes for the apo and agonist-bound receptor demonstrate relative populations of the states and inter-state exchange times. τex = (k12 + k21)−1 is the relaxation time of the exchange between the MF and HF states (highlighted with dashed orange rectangle). TM6 is colored on the schematic (cylinder) representation of active (PDB: 5G53, red) and inactive (PDB: 3EML, dark cyan) structures of A2AAR. The landscapes of relative energy are drawn with low FRET as a reference state.

References

    1. Kristiansen K. Molecular mechanisms of ligand binding, signaling, and regulation within the superfamily of G-protein-coupled receptors: molecular modeling and mutagenesis approaches to receptor structure and function. Pharmacol. Ther. 2004;103:21–80. doi: 10.1016/j.pharmthera.2004.05.002. - DOI - PubMed
    1. Gether, U. Uncovering molecular mechanisms involved in activation of G protein-coupled receptors. Endocrine Rev.21, 90–113 (2000). - PubMed
    1. Hauser AS, Attwood MM, Rask-Andersen M, Schiöth HB, Gloriam DE. Trends in GPCR drug discovery: new agents, targets and indications. Nat. Rev. Drug Discov. 2017;16:829–842. doi: 10.1038/nrd.2017.178. - DOI - PMC - PubMed
    1. Seifert R, Wenzel-seifert K. Constitutive activity of G-protein-coupled receptors: cause of disease and common property of wild-type receptors. Naunyn-Schmiedeberg’s Arch. Pharm. 2002;366:381–416. doi: 10.1007/s00210-002-0588-0. - DOI - PubMed
    1. Kenakin T. Theoretical aspects of GPCR-ligand complex pharmacology. Chem. Rev. 2017;117:4–20. doi: 10.1021/acs.chemrev.5b00561. - DOI - PubMed

Publication types

MeSH terms