. 2023 Apr 3;9(1):7.
doi: 10.1038/s41514-023-00106-4.

Oral supplementation of nicotinamide riboside alters intestinal microbial composition in rats and mice, but not humans

Affiliations

Oral supplementation of nicotinamide riboside alters intestinal microbial composition in rats and mice, but not humans

A Augusto Peluso et al. NPJ Aging. .

Abstract

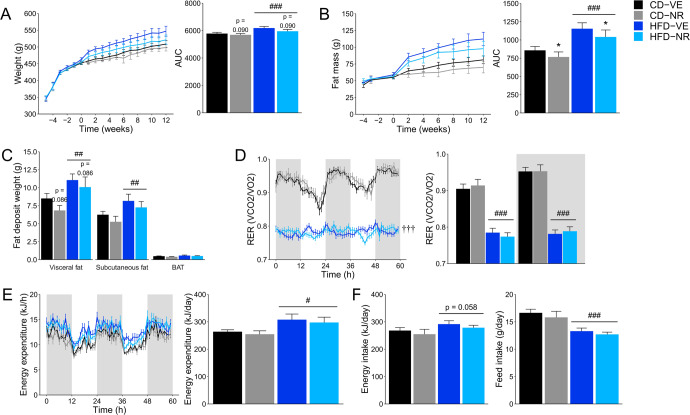
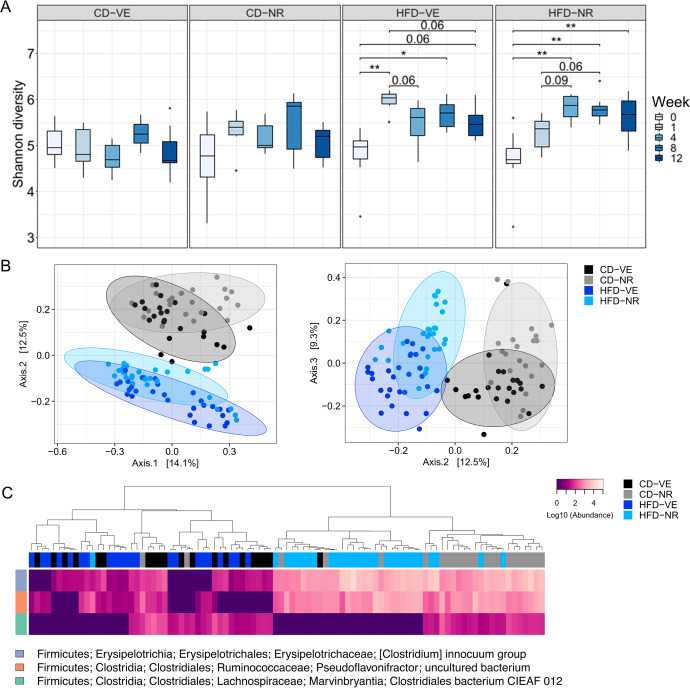
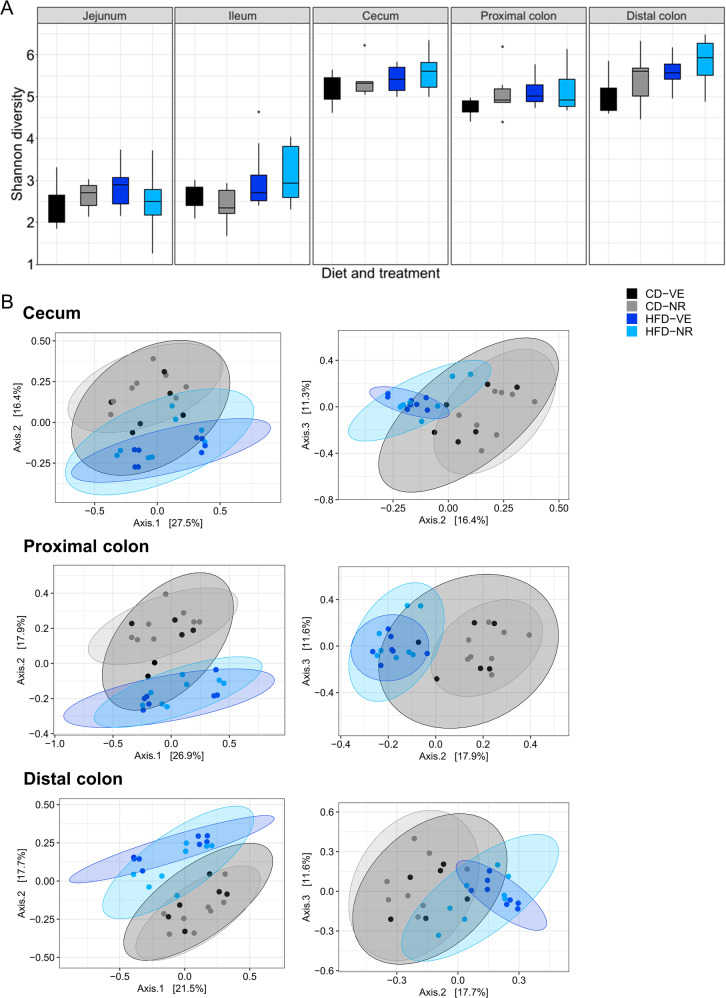
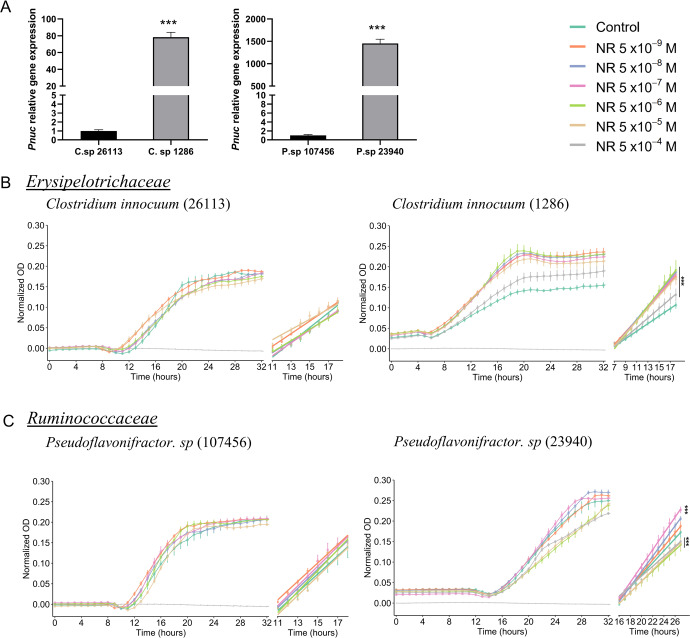
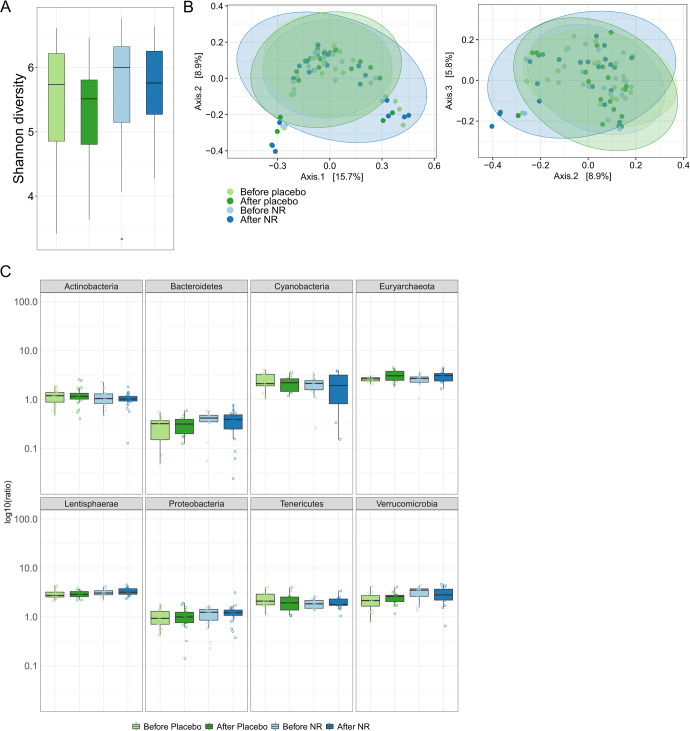
The gut microbiota impacts systemic levels of multiple metabolites including NAD+ precursors through diverse pathways. Nicotinamide riboside (NR) is an NAD+ precursor capable of regulating mammalian cellular metabolism. Some bacterial families express the NR-specific transporter, PnuC. We hypothesized that dietary NR supplementation would modify the gut microbiota across intestinal sections. We determined the effects of 12 weeks of NR supplementation on the microbiota composition of intestinal segments of high-fat diet-fed (HFD) rats. We also explored the effects of 12 weeks of NR supplementation on the gut microbiota in humans and mice. In rats, NR reduced fat mass and tended to decrease body weight. Interestingly, NR increased fat and energy absorption but only in HFD-fed rats. Moreover, 16S rRNA gene sequencing analysis of intestinal and fecal samples revealed an increased abundance of species within Erysipelotrichaceae and Ruminococcaceae families in response to NR. PnuC-positive bacterial strains within these families showed an increased growth rate when supplemented with NR. The abundance of species within the Lachnospiraceae family decreased in response to HFD irrespective of NR. Alpha and beta diversity and bacterial composition of the human fecal microbiota were unaltered by NR, but in mice, the fecal abundance of species within Lachnospiraceae increased while abundances of Parasutterella and Bacteroides dorei species decreased in response to NR. In conclusion, oral NR altered the gut microbiota in rats and mice, but not in humans. In addition, NR attenuated body fat mass gain in rats, and increased fat and energy absorption in the HFD context.


Conflict of interest statement

The authors declare no competing interests.

Figures

Fig. 1
Fig. 1. Temporal diagram design for physiological and metabolic experiments in rats.
Rats were divided into four groups (n = 8) based on body weight upon arrival and received a standard chow diet and water. During the 12-week study period, they were fed an experimental 60% high-fat diet (HFD) or a matched control diet (CD) with 10% fat ad libitum in combination with 300 mg/kg/day nicotinamide riboside (NR) or vehicle (water, VE). During this period, they were subjected to an oral glucose tolerance test (oGTT, week 6) and an insulin tolerance test (ITT, week 7). In addition, fecal samples were collected at 5 time points, intestinal content from distinct sites was taken for 16S rRNA gene sequencing, body weight gain was monitored weekly, body composition was measured every second week and gas exchange, as well as feed intake, was assessed using metabolic chambers.
Fig. 2
Fig. 2. Rat whole-body phenotype characterization.
A Body weight curve for animals over the 12 weeks study period (study start) with 4-5 weeks of acclimatization and average body weight gain over the 12 weeks. Diet effect: ###p < 0.001. B Fat mass curve for animals over the 12 weeks study period (study start) with a 3–4-week acclimatization period and the average fat mass gain average over 12 weeks. Diet effect: ###p < 0.001. NR effect: *p < 0.05. C Weight of fat deposits taken at sacrifice. Diet effect: ##p < 0.01. D Respiratory exchange ratio (RER). To the left, the measured RER over 60 h is depicted. To the right, the average RER for the dark and light phases is presented. Shading grey indicates dark phase periods. Diet effect: ###p < 0.001. Four-hour phase difference: †††p < 0.001. E Energy expenditure over 60 h in week 12 as well as daily average. Shading grey indicates dark phase periods. Diet effect: #p < 0.05. F Energy and feed intake in week 12. Diet effect: ###p < 0.001. Data are shown as mean ± SEM. n = 6–8.
Fig. 3
Fig. 3. Hepatic NAD+-related metabolites, cholesterol measurements, histological grading, triglycerides and tryptophan quantification in rats.
A Hepatic levels of NAD+, NAMN, NAAD, Me2PY/Me4PY and ADPR. Diet effect: #p < 0.05, NR effect: *p < 0.05, **p < 0.01, ***p < 0.001. B Plasma levels of HDL and LDL/VLDL. NR effect: *p < 0.05. C Lipid score (0–4) shown as median and individual values. Diet effect: ###p < 0.001. D Hepatic triglycerides quantification. Diet effect: ##p < 0.01. E Steatosis score (0–3) shown as median and individual values. F Representative hematoxylin and eosin (H&E) staining used to assess steatosis score. Scale bar: 100 µm. G Representative Oil Red staining used to assess lipid score. Scale bar: 100 µm. H Hepatic and Plasma levels of tryptophan (TRP). NR effect: **p < 0.01. Data are shown as mean ± SEM if not otherwise specified. n = 6–8. CD control diet, HFD high-fat diet, NR nicotinamide riboside, VE vehicle.
Fig. 4
Fig. 4. Energy and fatty acid absorption.
A Energy content of feces and B energy absorption. Energy absorption is depicted as the percentage of available energy from feed. Multiple comparison tests: Diet effect: (- - -) #p < 0.05, ###p < 0.001. NR effect: (……) **p < 0.01, ***p < 0.001, Interaction effect: (-.-.-.-.) $$$p < 0.001. C Fat content depicted as the percentage of available fat from feed. Multiple comparison tests: Diet effect: ###p < 0.001. D Fat absorption depicted as the percentage of available fat from feed. Multiple comparison tests: Diet effect: (- - -) ###p < 0.001. NR effect: (……) ***p < 0.001, Interaction effect: (-.-.-.-.) $$$p < 0.001. Data are shown as mean ± SEM. n = 3–4.
Fig. 5
Fig. 5. Effects of NR on the rat microbiota diversity.
A α-diversity calculated by the Shannon diversity index. *p < 0.05, **p < 0.01. Shown as median and quartiles (1st and 3rd) and the minimum and maximum by the whiskers. B PCoA plots of β-diversity based on Bray-Curtis distance matrix for the study period. Colors are according to diet and treatment groups. Axes indicate the proportion of variance explained. C Abundance heatmaps of differentially abundant features at the species level. n = 6–8.
Fig. 6
Fig. 6. Effects of NR on different intestinal sections of the rat microbiota diversity.
A α-diversity of individual intestine sections calculated by the Shannon diversity index. Shown as median and quartiles (1st and 3rd) and the minimum and maximum by the whiskers. B PCoA plots of β-diversity of individual intestine sections based on Bray-Curtis distance for the study period. Colors are according to diet and treatment groups. Axes indicate the proportion of variance explained. n = 6–8.
Fig. 7
Fig. 7. Hierarchical clustering of differentially abundant species within the rat lower intestinal microbiota.
Heatmaps of individual intestinal sections based on the abundance of the features identified to be differentially abundant. n = 6–8.
Fig. 8
Fig. 8. Bacterial PnuC gene levels and growth curve.
A Relative levels of the PnuC gene in Clostridium innocuum (1286 and 26,113 strain types) and Pseudoflavonifractor sp (23,940 and 107,456 strain types) within Erysipelotrichaceae and Ruminococcaceae families, respectively. Multiple comparison test. ***p < 0.01. Data are shown as mean ± SEM. n = 4. B Bacterial growth curve and slope calculation of the exponential phase for Clostridium innocuum (1286 and 26,113 strain types). ***p < 0.01. C Bacterial growth curve and slope calculation of the exponential phase for Pseudoflavonifractor sp (23,940 and 107,456 strain types). ***p < 0.01. Data are shown as mean ± SEM of 3 independent experiments. n = 8.
Fig. 9
Fig. 9. Effects of NR on the mouse microbiota.
A α-diversity calculated by the Shannon index. Shown as median and quartiles (1st and 3rd) and the minimum and maximum by the whiskers. B PCoA plot of β-diversity based on Bray-Curtis distance matrix. Colors are according to treatment groups. Axes indicate the percentage of variation explained. PERMANOVA, p = 0.006 for clustering based on cohort. C Volcano plot displaying p-values for abundance fold-change according to ALDEx2 differential abundance test. D Abundance of differentially abundant features based on treatment. Samples are grouped according to treatment. n = 8.
Fig. 10
Fig. 10. Effects of NR on the human microbiota.
A α-diversity calculated by the Shannon index. Shown as median and quartiles (1st and 3rd) and the minimum and maximum by the whiskers. B β-diversity calculated by Bray-Curtis diversity matrix. C Firmicutes to other phyla ratios after treatment intervention in humans. Shown as median and quartiles (1st and 3rd) and the minimum and maximum by the whiskers. n = 20 per group.

References

    1. Hruby A, Hu FB. The epidemiology of obesity: a big picture. Pharmacoeconomics. 2015;33:673–689. doi: 10.1007/s40273-014-0243-x. - DOI - PMC - PubMed
    1. Yoshino J, Baur JA, Imai S-I. NAD+ intermediates: the biology and therapeutic potential of NMN and NR. Cell Metab. 2018;27:513–528. doi: 10.1016/j.cmet.2017.11.002. - DOI - PMC - PubMed
    1. Trammell SA, Yu L, Redpath P, Migaud ME, Brenner C. Nicotinamide riboside is a major NAD+ precursor vitamin in cow milk. J. Nutr. 2016;146:957–963. doi: 10.3945/jn.116.230078. - DOI - PMC - PubMed
    1. Ummarino S, et al. Simultaneous quantitation of nicotinamide riboside, nicotinamide mononucleotide and nicotinamide adenine dinucleotide in milk by a novel enzyme-coupled assay. Food Chem. 2017;221:161–168. doi: 10.1016/j.foodchem.2016.10.032. - DOI - PubMed
    1. Chi Y, Sauve AA. Nicotinamide riboside, a trace nutrient in foods, is a vitamin B3 with effects on energy metabolism and neuroprotection. Curr. Opin. Clin. Nutr. Metab. Care. 2013;16:657–661. doi: 10.1097/MCO.0b013e32836510c0. - DOI - PubMed

LinkOut - more resources