. 2023 Apr 3;13(1):5420.
doi: 10.1038/s41598-023-32568-7.

Rewiring of the 3D genome during acquisition of carboplatin resistance in a triple-negative breast cancer patient-derived xenograft

Affiliations

Rewiring of the 3D genome during acquisition of carboplatin resistance in a triple-negative breast cancer patient-derived xenograft

Mikhail G Dozmorov et al. Sci Rep. .

Erratum in

Abstract

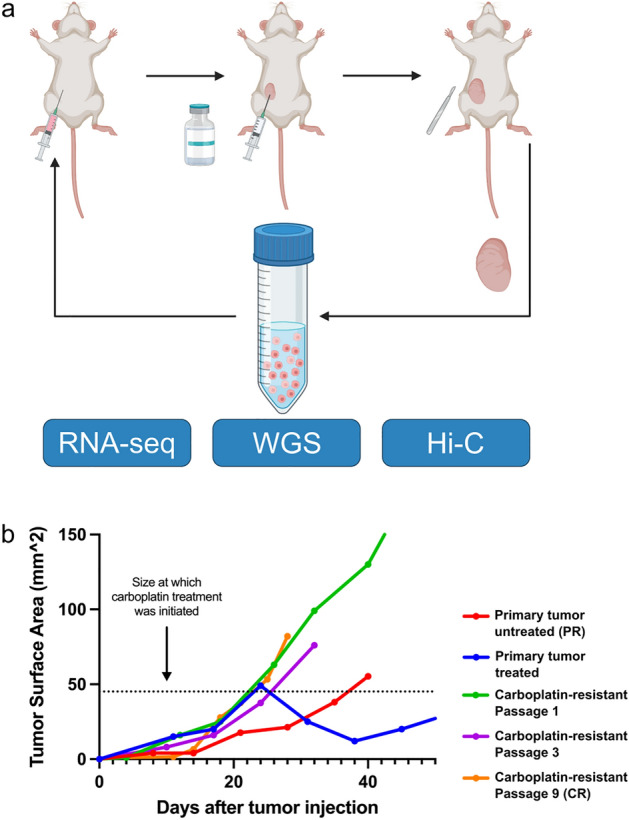
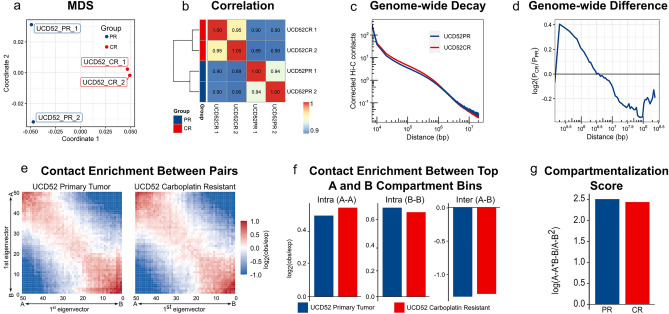
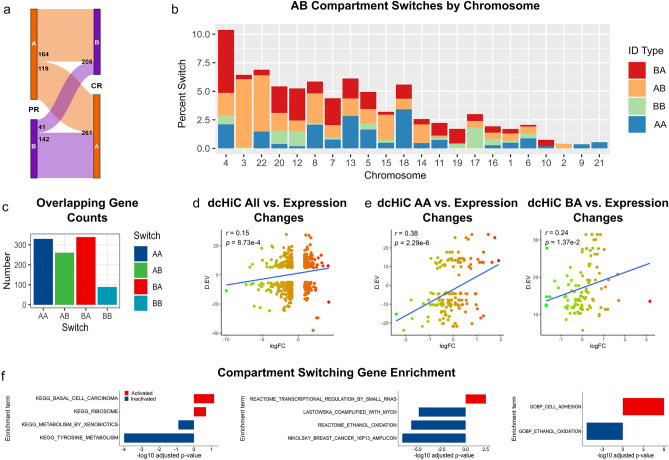
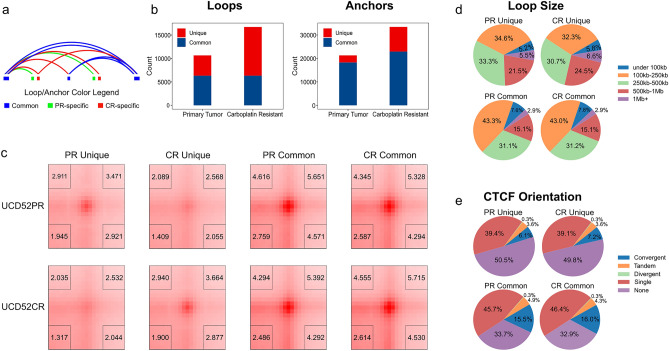
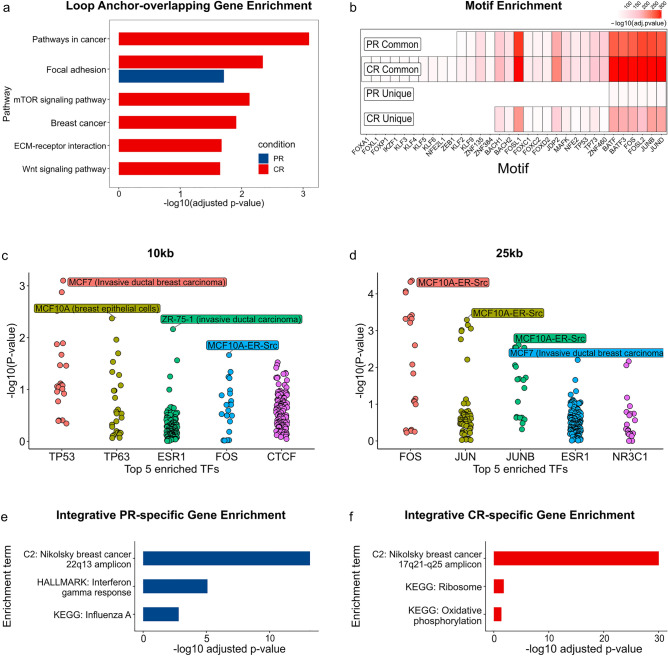
Changes in the three-dimensional (3D) structure of the genome are an emerging hallmark of cancer. Cancer-associated copy number variants and single nucleotide polymorphisms promote rewiring of chromatin loops, disruption of topologically associating domains (TADs), active/inactive chromatin state switching, leading to oncogene expression and silencing of tumor suppressors. However, little is known about 3D changes during cancer progression to a chemotherapy-resistant state. We integrated chromatin conformation capture (Hi-C), RNA-seq, and whole-genome sequencing obtained from triple-negative breast cancer patient-derived xenograft primary tumors (UCD52) and carboplatin-resistant samples and found increased short-range (< 2 Mb) interactions, chromatin looping, formation of TAD, chromatin state switching into a more active state, and amplification of ATP-binding cassette transporters. Transcriptome changes suggested the role of long-noncoding RNAs in carboplatin resistance. Rewiring of the 3D genome was associated with TP53, TP63, BATF, FOS-JUN family of transcription factors and led to activation of aggressiveness-, metastasis- and other cancer-related pathways. Integrative analysis highlighted increased ribosome biogenesis and oxidative phosphorylation, suggesting the role of mitochondrial energy metabolism. Our results suggest that 3D genome remodeling may be a key mechanism underlying carboplatin resistance.


Conflict of interest statement

The authors declare no competing interests.

Figures

Figure 1
Figure 1
Development of a PDX-model of acquired carboplatin resistance in triple-negative breast cancer. (a) UCD52 PDX tumors were grown in female NSG mice. Once tumors reached 25–50 mm2 in size, mice were treated with carboplatin. After tumor growth resumed, tumors were harvested, prepared into a single-cell suspension, and passaged into a new recipient mouse. Single-cell suspensions were also used for Hi-C, WGS, and RNA-seq. (b) Plot depicts growth rates of untreated and treated primary (PR) UCD52 tumors as well as passage number 1, 3, and 9 carboplatin resistant (CR) tumors. N = 1 or 2 per passage number. Image created with BioRender.com.
Figure 2
Figure 2
Differentially expressed transcripts and their functional significance. Differentially expressed protein-coding genes (a) and lncRNAs (b). Red/blue colors correspond to genes up- or downregulated in the CR condition. Top 20 most significant up- and downregulated transcripts are listed in the corresponding panels and selected transcripts are highlighted. (c) Most significant GSEA enrichments using KEGG, Gene Ontology, and Hallmark MSigDb collections. (d) Functions, phenotypes, and signatures enriched in lncRNAs upregulated in carboplatin resistance. Each panel corresponds to enrichment categories from the LncSEA analysis. All panels show −log10(p-value) except “Cancer Phenotype” showing gene counts.
Figure 3
Figure 3
Whole Genome Sequencing coverage differences between the CR and PR conditions. (a) Count and size of large deletions and duplications in the CR condition identified by the Circular Binary Segmentation algorithm. (b) An example of large deletions and duplications on chromosome 17 with a portion containing ABC transporters zoomed-in. (c) Correlation of gene expression and coverage changes, genomewide and ABC transporters only. Genes with small changes (less than 1SD of the change distribution) were excluded. (d) Gene sets from MSigDb enriched in deleted (blue) or duplicated (red) genes.
Figure 4
Figure 4
Replicability and compartmentalization changes in carboplatin resistance. (a) Multi-dimensional scaling (chromosome-specific HiCRep measures, averaged for each pairwise comparison) and (b) a heatmap of Pearson Correlation Coefficients for replicates at 1 Mb resolution. (c) Distance-dependent chromatin interaction decay curves (X-axis—distance on log10 scale, Y-axis—corrected chromatin contacts on log10 scale) and (d) differences between them (Y-axis—log2 ratio of contact probabilities for CR vs. PR conditions). (e) Compartmentalization saddle plots (500 kb resolution), (f) contact enrichments between top A and B compartment bins (Methods), and (g) overall compartmentalization score in the CR versus PR condition comparison.
Figure 5
Figure 5
Chromatin state changes in carboplatin resistance. (a) Genomewide flow chart and (b) chromosome-specific proportions of the genome switching states between active A and inactive B compartments in the CR versus PR comparison at FDR < 0.3. (c) Number of genes overlapping chromatin state switching regions. (d) Correlation between gene expression- (X-axis) and chromatin state (eigenvector) changes (Y-axis). Only changes larger than 1SD or (e) changes within AA or BA switches were considered. (f) Most significant GSEA enrichments using KEGG, curated gene sets, and Gene Ontology MSigDb collections.
Figure 6
Figure 6
Condition-specific and common loops and anchors. (a) Differences between loops and anchors. Common loops (blue arcs) and PR/CR-specific loops (green/red arcs) may share anchors that are considered common (blue rectangles), while the other, loop-specific anchors, are considered PR/CR-specific (green/red rectangles). Adjacent anchors are considered in the same category. (b) Counts of the condition-specific and common loops and anchors. (c) Aggregate Peak Analysis of condition-specific and common loops (X-axis) in the condition-specific matrices (Y-axis). Corner numbers correspond to center-to-corner ratios. (d) Size range comparison of loop size distributions, (e) Proportions of loops with various CTCF configurations at boundaries.
Figure 7
Figure 7
Functions and transcription factors enriched in condition-specific loop anchors. (a) Most significant hypergeometric enrichments of genes overlapping condition-specific loop anchors in KEGG pathways. Blue/red colors indicate PR/CR-specific enrichments. (b) MEME motif enrichment analysis at 10 kb resolution. Red gradient represents the enrichment level of transcription factor motifs (X-axis) in the condition-specific and common loop anchors (Y-axis). (c,d) Transcription factor enrichment analysis at 10 kb and 25 kb resolutions (UniBind). X-axis—transcription factors, Y-axis—−log10(enrichment p value), each dot represents cell/tissue-specific set of ChIP-seq peaks. (e,f) Most significant hypergeometric enrichments of genes supported by at least four pieces of evidence in the CR/PR condition. All analyses were performed on open chromatin regions (ATAC-seq) overlapping the condition-specific and common loop anchors.

References

    1. Lieberman-Aiden, E. et al. Comprehensive mapping of long-range interactions reveals folding principles of the human genome. Science326, 289–293 (2009). - PMC - PubMed
    1. Beagan, J. A. & Phillips-Cremins, J. E. On the existence and functionality of topologically associating domains. Nat. Genet.52, 8–16 (2020). - PMC - PubMed
    1. Chang, L.-H., Ghosh, S. & Noordermeer, D. TADs and their borders: Free movement or building a wall?. J. Mol. Biol.432, 643–652 (2020). - PubMed
    1. Roayaei Ardakany, A., Gezer, H. T., Lonardi, S. & Ay, F. Mustache: Multi-scale detection of chromatin loops from hi-c and micro-c maps using scale-space representation. Genome Biol.21, 256 (2020). - PMC - PubMed
    1. Rao, S. S. P. et al. A 3D map of the human genome at kilobase resolution reveals principles of chromatin looping. Cell159, 1665–1680 (2014). - PMC - PubMed

Publication types