Meta-Analysis
. 2023 Apr;55(4):559-567.
doi: 10.1038/s41588-023-01343-9. Epub 2023 Apr 3.

Genetic effects on the timing of parturition and links to fetal birth weight

Pol Solé-Navais  1 Christopher Flatley  2 Valgerdur Steinthorsdottir  3 Marc Vaudel  4 Julius Juodakis  2 Jing Chen  5   6 Triin Laisk  7 Abigail L LaBella  8 David Westergaard  9   10   11 Jonas Bacelis  2 Ben Brumpton  12 Line Skotte  13 Maria C Borges  14   15 Øyvind Helgeland  4   16 Anubha Mahajan  17   18 Matthias Wielscher  19   20 Frederick Lin  21 Catherine Briggs  22 Carol A Wang  23   24 Gunn-Helen Moen  12   15   25   26 Robin N Beaumont  27 Jonathan P Bradfield  28 Abin Abraham  29 Gudmar Thorleifsson  3 Maiken E Gabrielsen  12 Sisse R Ostrowski  30   31 Dominika Modzelewska  2 Ellen A Nohr  32 Elina Hypponen  33   34 Amit Srivastava  6   35 Octavious Talbot  21 Catherine Allard  36 Scott M Williams  37 Ramkumar Menon  38 Beverley M Shields  27 Gardar Sveinbjornsson  3 Huan Xu  6   35 Mads Melbye  12   31   39   40 William Lowe Jr  21 Luigi Bouchard  41   42 Emily Oken  22 Ole B Pedersen  31   43 Daniel F Gudbjartsson  3   44 Christian Erikstrup  45   46 Erik Sørensen  30 Early Growth Genetics ConsortiumEstonian Biobank Research TeamDanish Blood Donor Study Genomic ConsortiumRolv T Lie  39   47 Kari Teramo  48   49 Mikko Hallman  50   51 Thorhildur Juliusdottir  3 Hakon Hakonarson  52   53   54   55 Henrik Ullum  56 Andrew T Hattersley  27 Line Sletner  57 Mario Merialdi  58 Sheryl L Rifas-Shiman  22 Thora Steingrimsdottir  59   60 Denise Scholtens  21 Christine Power  61 Jane West  62 Mette Nyegaard  63 John A Capra  64 Anne H Skogholt  12 Per Magnus  39 Ole A Andreassen  25   65   66 Unnur Thorsteinsdottir  3   59 Struan F A Grant  53   67   68   69 Elisabeth Qvigstad  25   70 Craig E Pennell  23   24 Marie-France Hivert  22   71 Geoffrey M Hayes  21 Marjo-Riitta Jarvelin  19   72   73   74 Mark I McCarthy  17   18 Deborah A Lawlor  14   15   75 Henriette S Nielsen  10   31   76 Reedik Mägi  7 Antonis Rokas  8   77   78 Kristian Hveem  12   79   80 Kari Stefansson  3   59 Bjarke Feenstra  13 Pål Njolstad  4   81 Louis J Muglia  6   35 Rachel M Freathy  14   27 Stefan Johansson  4   82 Ge Zhang #  6   35 Bo Jacobsson #  83   84
Collaborators, Affiliations
Meta-Analysis

Genetic effects on the timing of parturition and links to fetal birth weight

Pol Solé-Navais et al. Nat Genet. 2023 Apr.

Erratum in

  • Author Correction: Genetic effects on the timing of parturition and links to fetal birth weight.
    Solé-Navais P, Flatley C, Steinthorsdottir V, Vaudel M, Juodakis J, Chen J, Laisk T, LaBella AL, Westergaard D, Bacelis J, Brumpton B, Skotte L, Borges MC, Helgeland Ø, Mahajan A, Wielscher M, Lin F, Briggs C, Wang CA, Moen GH, Beaumont RN, Bradfield JP, Abraham A, Thorleifsson G, Gabrielsen ME, Ostrowski SR, Modzelewska D, Nohr EA, Hypponen E, Srivastava A, Talbot O, Allard C, Williams SM, Menon R, Shields BM, Sveinbjornsson G, Xu H, Melbye M, Lowe W Jr, Bouchard L, Oken E, Pedersen OB, Gudbjartsson DF, Erikstrup C, Sørensen E; Early Growth Genetics Consortium; Estonian Biobank Research Team; Danish Blood Donor Study Genomic Consortium; Lie RT, Teramo K, Hallman M, Juliusdottir T, Hakonarson H, Ullum H, Hattersley AT, Sletner L, Merialdi M, Rifas-Shiman SL, Steingrimsdottir T, Scholtens D, Power C, West J, Nyegaard M, Capra JA, Skogholt AH, Magnus P, Andreassen OA, Thorsteinsdottir U, Grant SFA, Qvigstad E, Pennell CE, Hivert MF, Hayes GM, Jarvelin MR, McCarthy MI, Lawlor DA, Nielsen HS, Mägi R, Rokas A, Hveem K, Stefansson K, Feenstra B, Njolstad P, Muglia LJ, Freathy RM, Johansson S, Zhang G, Jacobsson B. Solé-Navais P, et al. Nat Genet. 2023 Jul;55(7):1250. doi: 10.1038/s41588-023-01412-z. Nat Genet. 2023. PMID: 37165137 Free PMC article. No abstract available.

Abstract

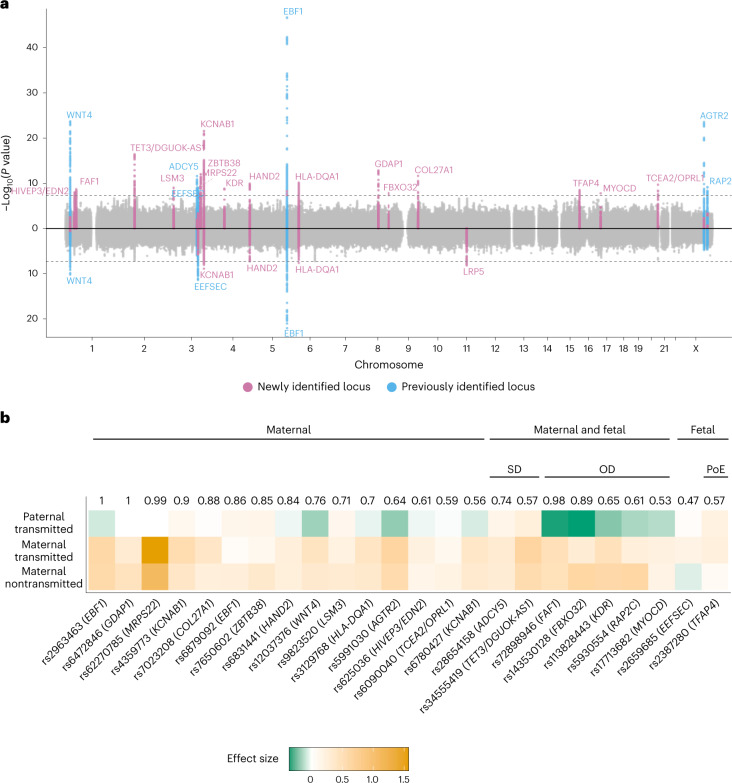
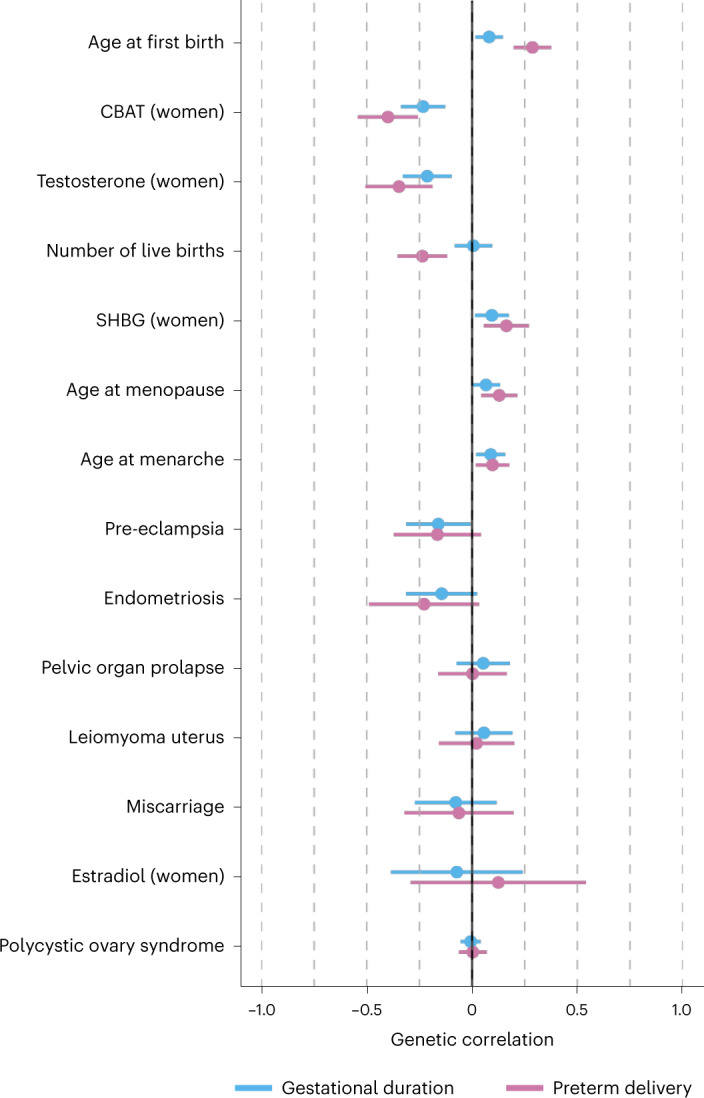
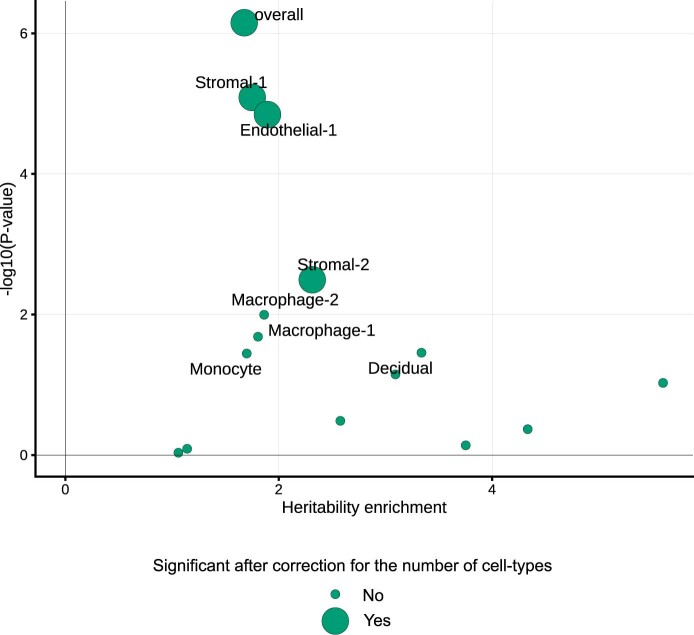
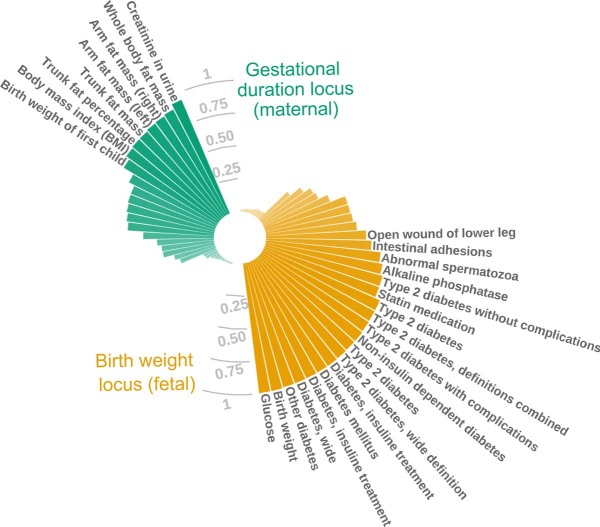
The timing of parturition is crucial for neonatal survival and infant health. Yet, its genetic basis remains largely unresolved. We present a maternal genome-wide meta-analysis of gestational duration (n = 195,555), identifying 22 associated loci (24 independent variants) and an enrichment in genes differentially expressed during labor. A meta-analysis of preterm delivery (18,797 cases, 260,246 controls) revealed six associated loci and large genetic similarities with gestational duration. Analysis of the parental transmitted and nontransmitted alleles (n = 136,833) shows that 15 of the gestational duration genetic variants act through the maternal genome, whereas 7 act both through the maternal and fetal genomes and 2 act only via the fetal genome. Finally, the maternal effects on gestational duration show signs of antagonistic pleiotropy with the fetal effects on birth weight: maternal alleles that increase gestational duration have negative fetal effects on birth weight. The present study provides insights into the genetic effects on the timing of parturition and the complex maternal-fetal relationship between gestational duration and birth weight.


Conflict of interest statement

As of January 2020, A.M. is an employee of Genentech and a holder of Roche stock. The views expressed in this article are those of the author(s) and not necessarily those of the NHS, NIHR or Department of Health. M.I.M. has served on advisory panels for Pfizer, Novo Nordisk and Zoe Global; has received honoraria from Merck, Pfizer, Novo Nordisk and Eli Lilly; and has received research funding from Abbvie, AstraZeneca, Boehringer Ingelheim, Eli Lilly, Janssen, Merck, Novo Nordisk, Pfizer, Roche, Sanofi Aventis, Servier and Takeda. As of June 2019, M.I.M. is an employee of Genentech and a holder of Roche stock. D.A.L. receives support from several national and international government and charitable research funders, as well as from Medtronic and Roche Diagnostics for research unrelated to that presented here. H.S. obtained speaker fees from Ferring Pharmaceuticals, Merck A/S, AstraZeneca and Cook Medical. V.S., G.T., G.S., D.F.G., U.T. and K.S. are employees of deCODE genetics/Amgen. The remaining authors declare no competing interests.

Figures

Fig. 1
Fig. 1. GWAS of the timing of parturition and dissection of maternal–fetal effects.
a, Miami plot illustrating the GWAS for gestational duration (top) and preterm delivery (bottom). The x-axis shows the chromosome position and the y-axis the two-sided P-value of the fixed-effect inverse-variance weighted meta-analysis. The dashed line represents the genome-wide significance threshold (P = 5 × 10⁻⁸). Each genome-wide significant locus is labeled by its nearest protein-coding gene. b, Clustering of the effect origin for the index SNPs for gestational duration using transmitted and nontransmitted parental alleles (n = 136,833). Numbers depicted above the heatmap are the highest probability observed for that SNP, and group names define the cluster to which the highest probability refers to. The probabilities were estimated using model-based clustering. Heatmap represents effect size and effect direction for the parental transmitted and nontransmitted alleles. For comparison purposes, the maternal alleles with positive effects were chosen as reference alleles. Three major groups were identified according to the highest probability: maternal-only effect, fetal-only effect and maternal and fetal effect. Within variants with both maternal and fetal effects, two clusters were observed: same (SD) or opposite (OD) effect direction from maternal and fetal genomes. One of the fetal effects was further clustered as having a parent-of-origin effect (PoE), specifically, an effect from the maternal transmitted allele.
Fig. 2
Fig. 2. Polygenic prediction of gestational duration.
Mean (95% CI) gestational duration for each decile of the gestational duration polygenic score (n = 3,943). Only spontaneous deliveries were considered. PGS, polygenic score.
Fig. 3
Fig. 3. Genetic correlations between gestational duration and preterm delivery and other female reproductive traits.
a, Genetic correlations between gestational duration (n = 195,555) and preterm delivery (18,797 cases, 260,246 controls) and other female reproductive traits were estimated using LD-score regression. Dots are the genetic correlation estimate, and error bars are the 95% CI. The direction of the genetic correlations with preterm delivery was flipped so that term deliveries were considered as cases and preterm deliveries as controls. Hence, the direction of the genetic correlations of preterm delivery matches that of gestational duration, providing a clear comparison of the 95% CI.
Fig. 4
Fig. 4. Genetic relationship between gestational duration and birth weight.
a, Distribution of the relative difference in effect size before and after conditioning the effect on birth weight by the maternal effect on gestational duration using approximate multitrait COJO analysis. After conditioning, we split the genome into approximately LD-independent regions and selected the SNPs with the lowest P value on birth weight (P < 5 × 10⁻⁶) from each region (n SNPs maternal effect = 87; n SNPs fetal effect = 108). Fetal, pink; maternal, blue. b,c, Scatterplot for two-sample Mendelian randomization analysis for the maternal effect of gestational duration on birth weight (b, maternal effects; c, fetal effects). Each dot represents one of the gestational duration index SNPs. Effect sizes and standard errors (horizontal or vertical error bars) from the index SNPs for gestational duration derived from the maternal nontransmitted alleles were obtained from the meta-analysis of parent-offspring data (n = 136,833). The maternal-only and the fetal-only effects on birth weight were extracted from a previous GWAS meta-analysis (n = 210,248 and 297,356, respectively). The x-axis shows the SNP effect of the maternal nontransmitted alleles on gestational duration (days), and the y-axis the effect on birth weight (z-scores). Horizontal and vertical error bars represent the standard error. The solid line depicts the inverse-variance weighted method estimate, and the dashed line the MR-Egger estimate. Colors represent the clustering of the SNP effects on gestational duration, performed using model-based clustering.
Extended Data Fig. 1
Extended Data Fig. 1. SNP-heritability enrichment of gestational duration for genes differentially expressed during labor in different cell types of the myometrium and overall.
LD-score regression was used to partition heritability and estimate the heritability enrichment for each cell type and overall. We calculated LD scores (European individuals from phase 3 of the 1000 Genomes project) for sets of genes differentially expressed at labor (± 100 kb) for each cell type separately and for the overall set of genes differentially expressed in the myometrium. Each dot represents a cell type, the x-axis shows the heritability enrichment, and the y-axis the -log10(P-value) of a two-sided test. Larger dots denote significant heritability enrichment after Bonferroni correction for multiple comparisons (that is, number of cell types; P-value < 0.05/15). See Online Methods for a cautionary note regarding the comparison of different cell-type enrichment P-values.
Extended Data Fig. 2
Extended Data Fig. 2. Ternary plot representing the probabilities of having maternal, fetal or maternal, and fetal effect for each index SNP.
The sum of all probabilities for each index SNP is 1. Lines are colored according to the axis they belong to. All points in a horizontal line (green) have the same probability of ‘fetal-only effect’, points on a line (yellow) parallel to the right side of the triangle have the same probability of a ‘Maternal-only effect’, and lines (black) parallel to the left side of the triangle have the same probability of a ‘Maternal and fetal effect’. Probabilities were obtained using Gaussian Mixture models clustering using the effect size and standard error estimates of the parental transmitted and nontransmitted alleles (n = 136,833 parent-offsprings). While five different clusters were identified, the fetal effect was broken down into two groups (parent-of-origin and independent of parent-of-origin), and the maternal and fetal effects also into two groups (same or opposite maternal and fetal direction). For this figure, probability of a ‘Fetal only effect’ is the sum of the two groups with fetal effect, and ‘Maternal and fetal effect’ is the sum of the probabilities of the two clusters with maternal and fetal effects.
Extended Data Fig. 3
Extended Data Fig. 3. Colocalization between the maternal effects on gestational duration (green) and fetal effects on birth weight (yellow) and other phenotypes from UK Biobank and FinnGen at the ADCY5 locus.
Posterior probability of colocalization between the maternal effect on gestational duration (rs28654158) and the fetal-only effect on birth weight (rs11708067) with traits from UK Biobank and FinnGen. Only traits with a posterior probability of colocalization ≥ 0.01 are plotted, and names are only shown if the posterior probability is > 0.5. Maternal locus on gestational duration was centered around rs28654158 (± 1.5 Mb), and the fetal locus on birth weight around rs11708067 (± 1.5 Mb).
Extended Data Fig. 4
Extended Data Fig. 4. Association between testosterone levels (women) and maternal effect on gestational duration.
Scatterplot for two-sample Mendelian randomization analysis for the effect of testosterone in nmol/L (x-axis, independent of SHBG, n = 230,454) on gestational duration in days (y-axis, maternal effect, n = 195,555). Each dot represents one of the testosterone associated SNPs. Horizontal and vertical error bars represent the 95% CI. The gray line depicts the inverse-variance weighted method estimate, and the gray-dashed line the MR-Egger estimate.

References

    1. Chawanpaiboon S, et al. Global, regional, and national estimates of levels of preterm birth in 2014: a systematic review and modelling analysis. Lancet Glob. Health. 2019;7:e37–e46. doi: 10.1016/S2214-109X(18)30451-0. - DOI - PMC - PubMed
    1. Perin J, et al. Global, regional, and national causes of under-5 mortality in 2000-19: an updated systematic analysis with implications for the Sustainable Development Goals. Lancet Child Adolesc. Health. 2022;6:106–115. doi: 10.1016/S2352-4642(21)00311-4. - DOI - PMC - PubMed
    1. Rokas A, et al. Developing a theoretical evolutionary framework to solve the mystery of parturition initiation. eLife. 2020;9:e58343. doi: 10.7554/eLife.58343. - DOI - PMC - PubMed
    1. Romero R, Dey SK, Fisher SJ. Preterm labor: one syndrome, many causes. Science. 2014;345:760–765. doi: 10.1126/science.1251816. - DOI - PMC - PubMed
    1. Zhang G, et al. Genetic associations with gestational duration and spontaneous preterm birth. N. Engl. J. Med. 2017;377:1156–1167. doi: 10.1056/NEJMoa1612665. - DOI - PMC - PubMed

Publication types