. 2023 Apr;55(4):640-650.
doi: 10.1038/s41588-023-01357-3. Epub 2023 Apr 3.

Cellular states are coupled to genomic and viral heterogeneity in HPV-related oropharyngeal carcinoma

Affiliations

Cellular states are coupled to genomic and viral heterogeneity in HPV-related oropharyngeal carcinoma

Sidharth V Puram et al. Nat Genet. 2023 Apr.

Abstract

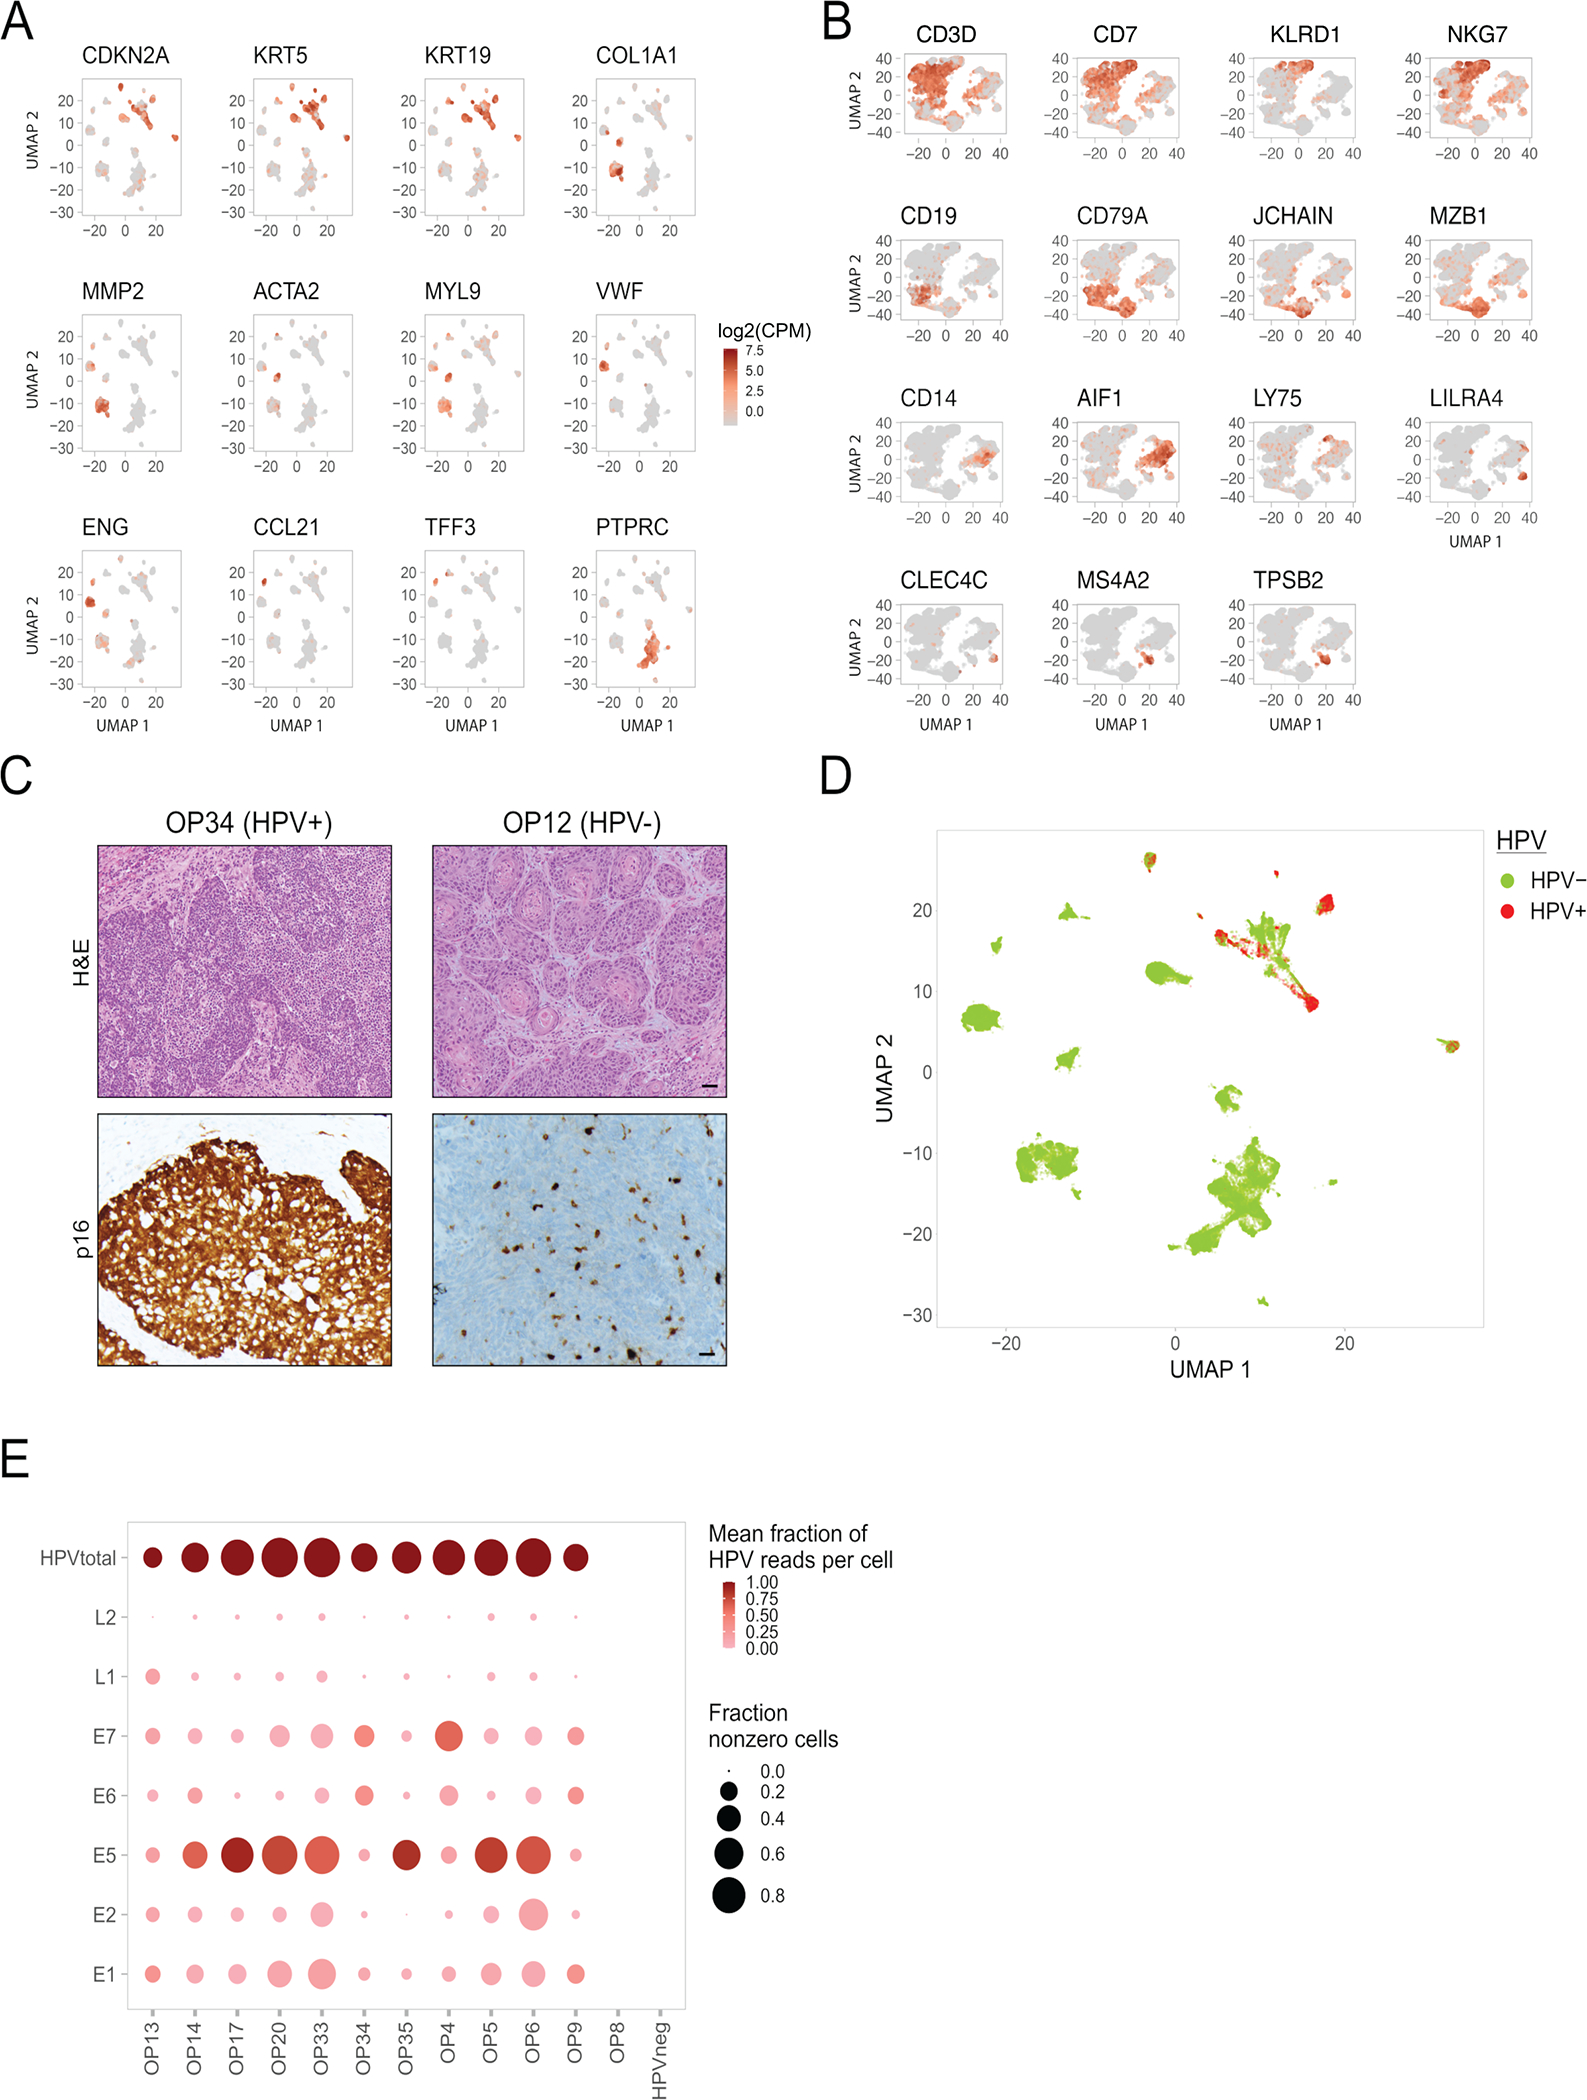
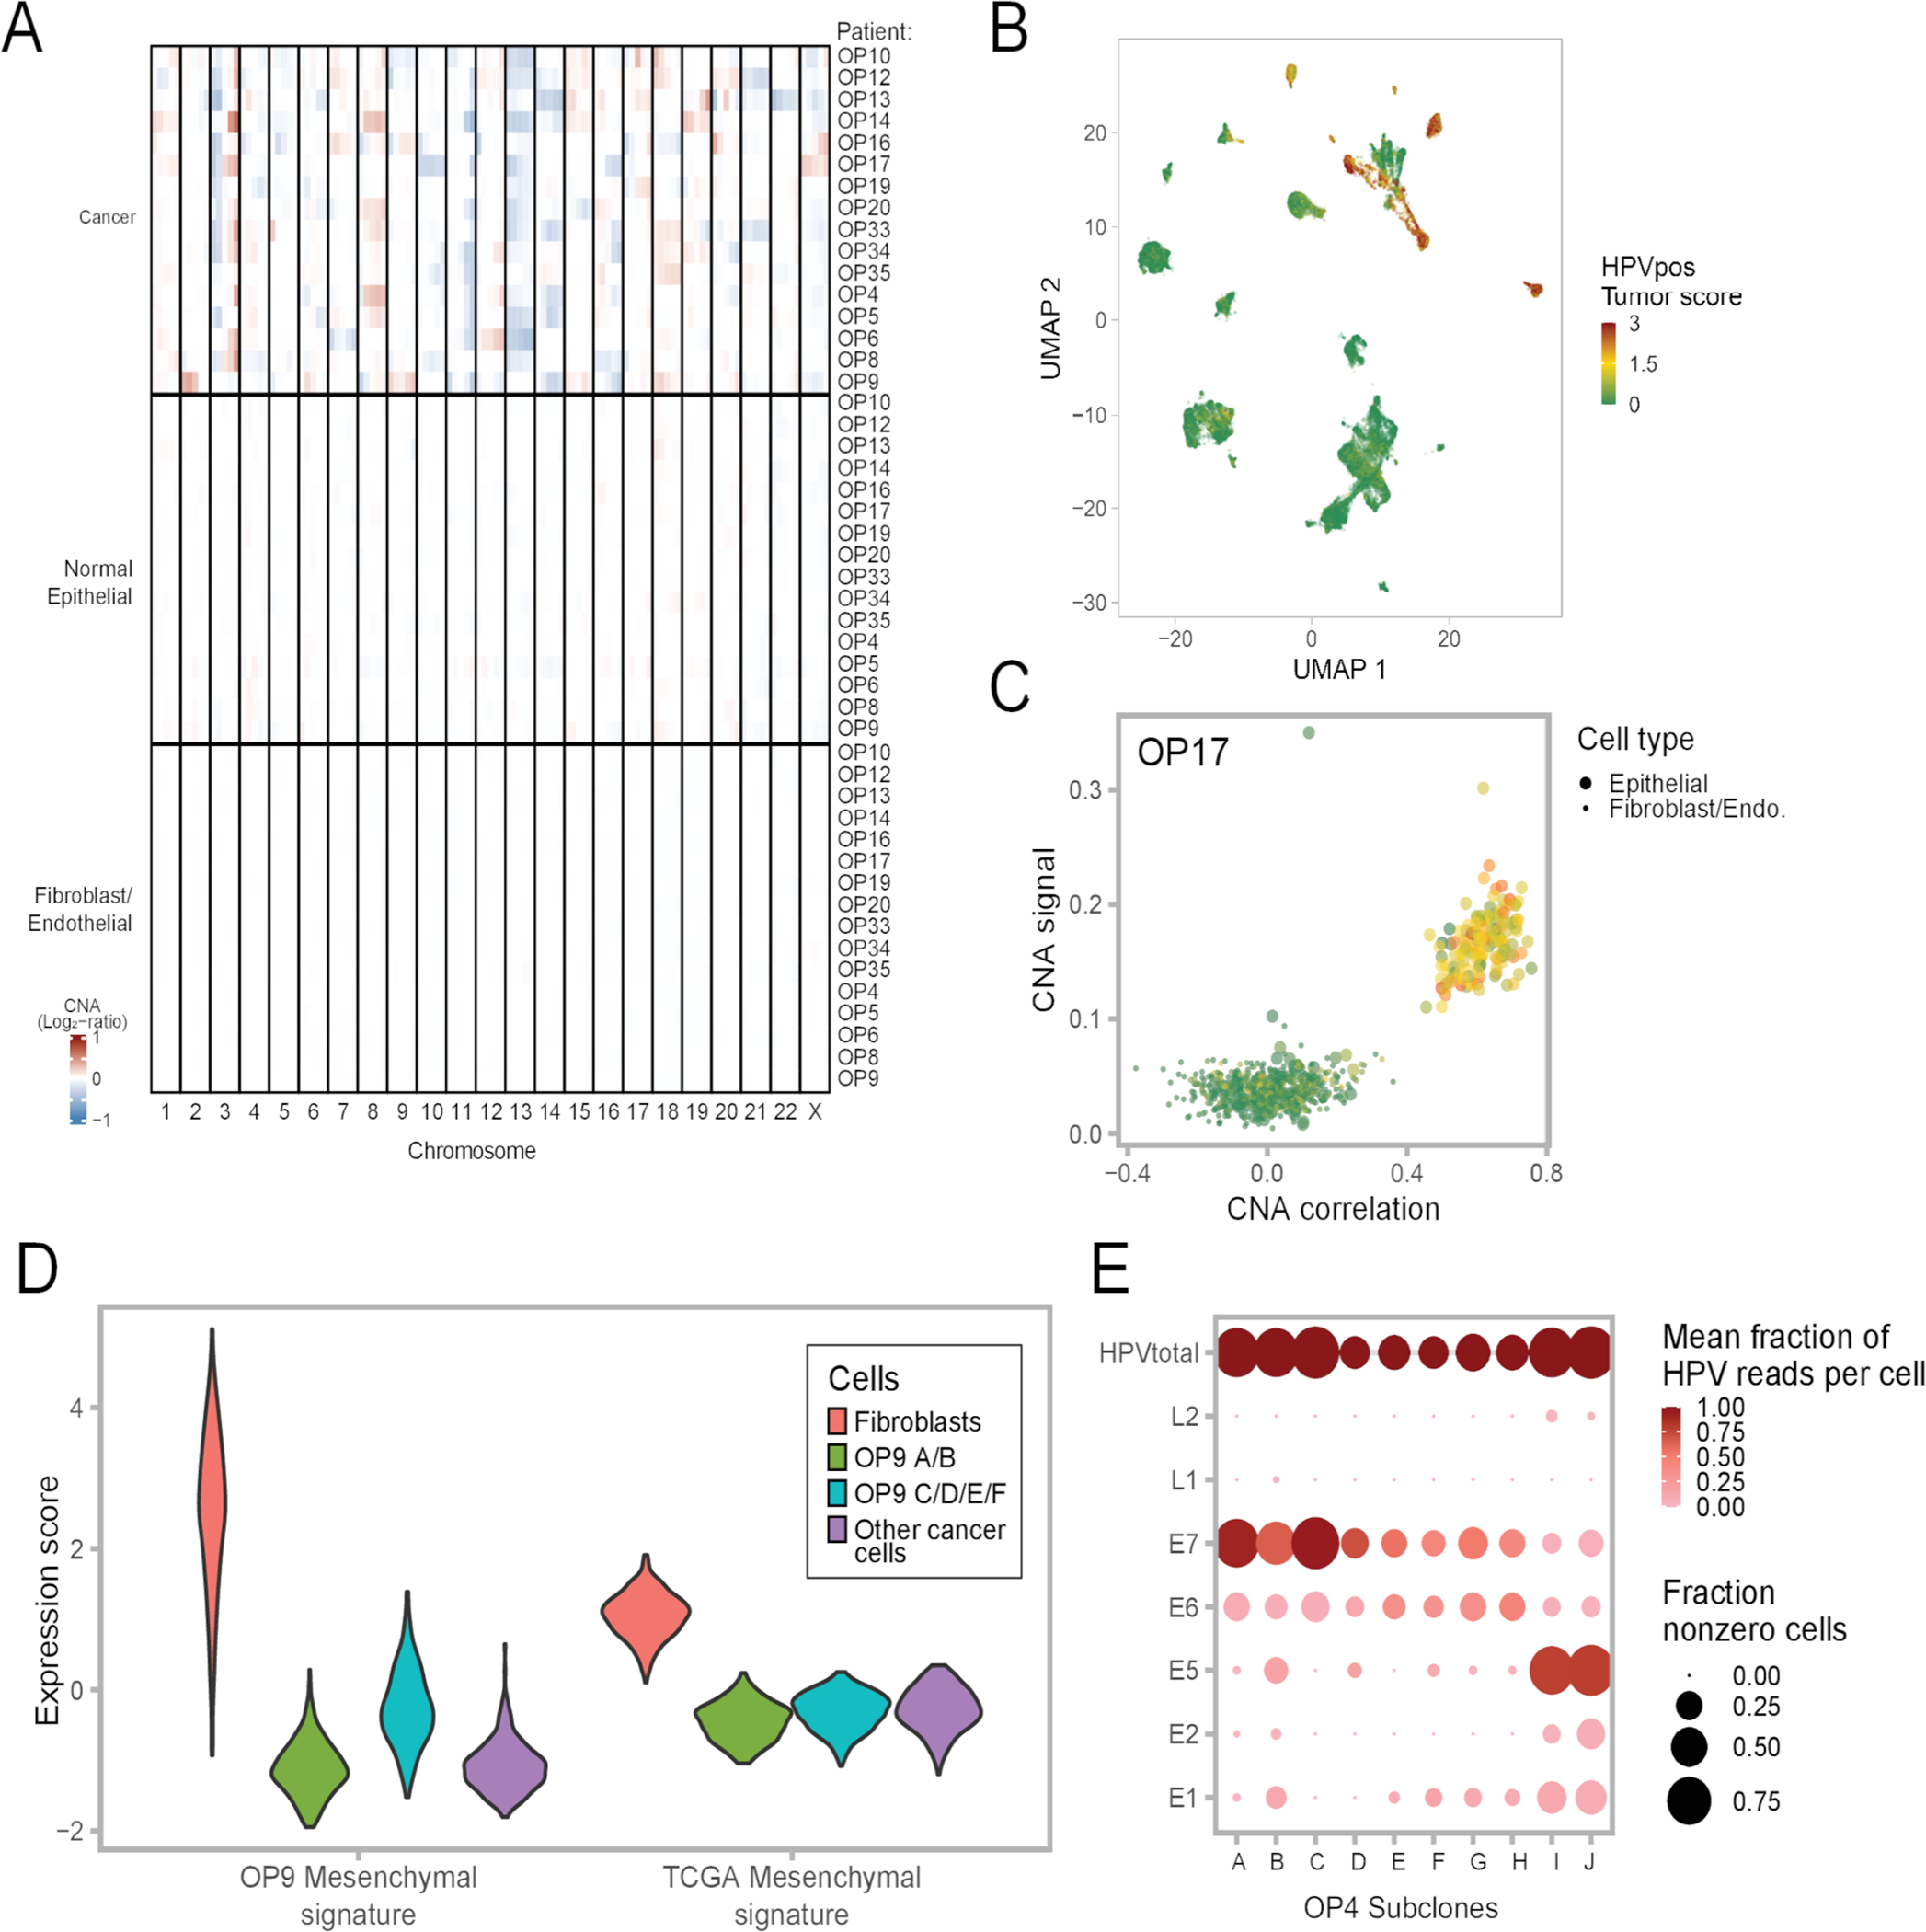
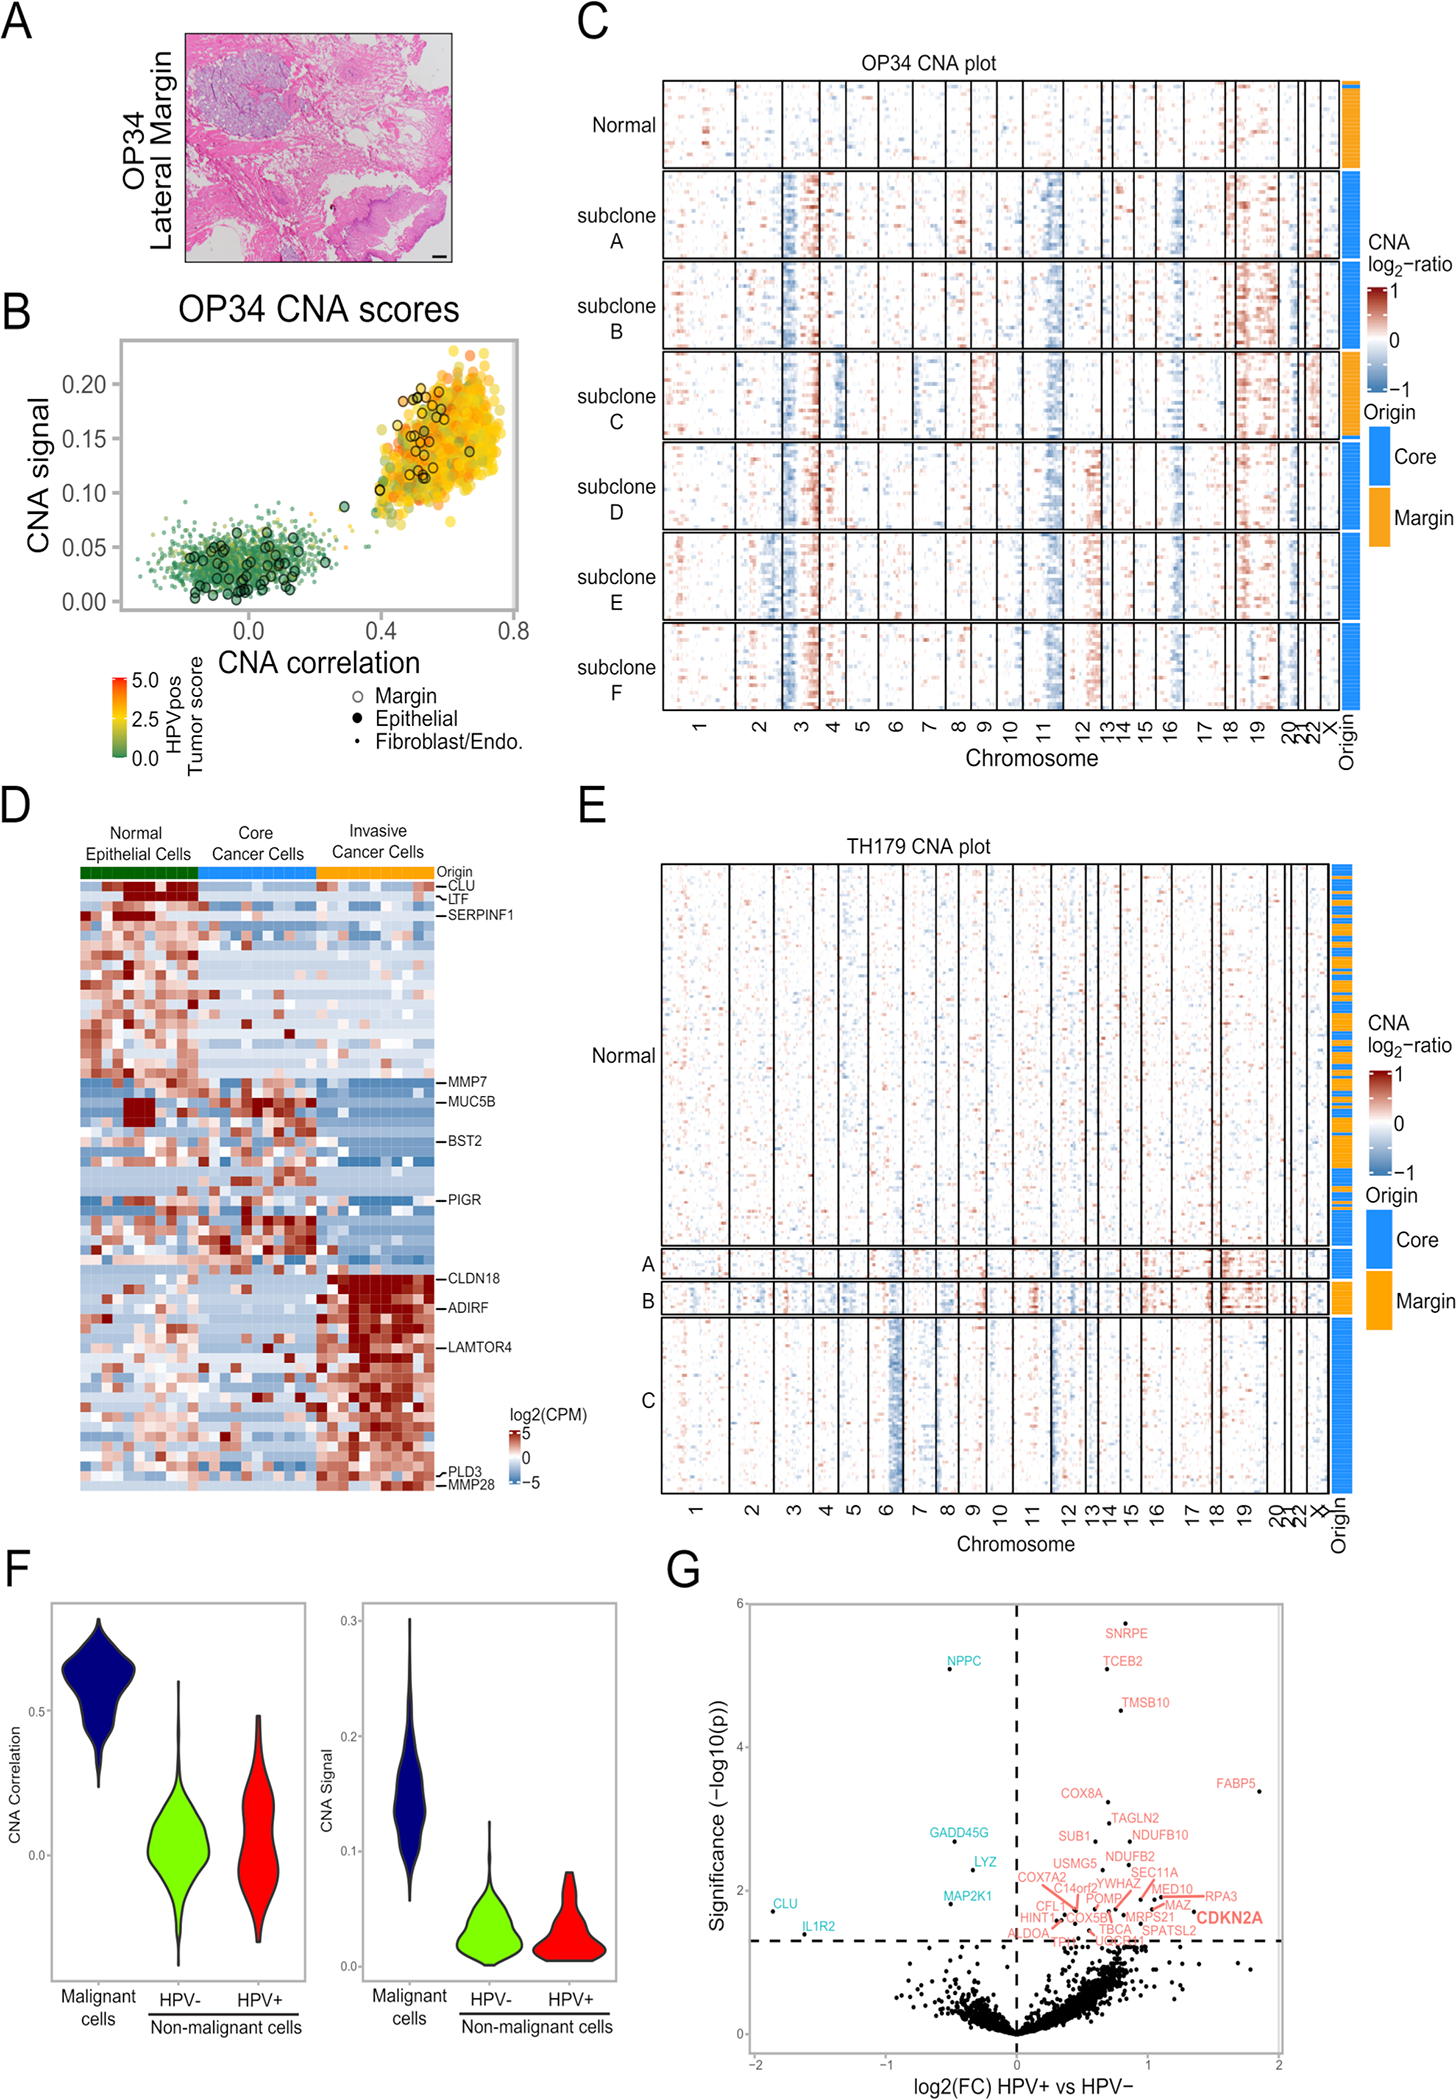
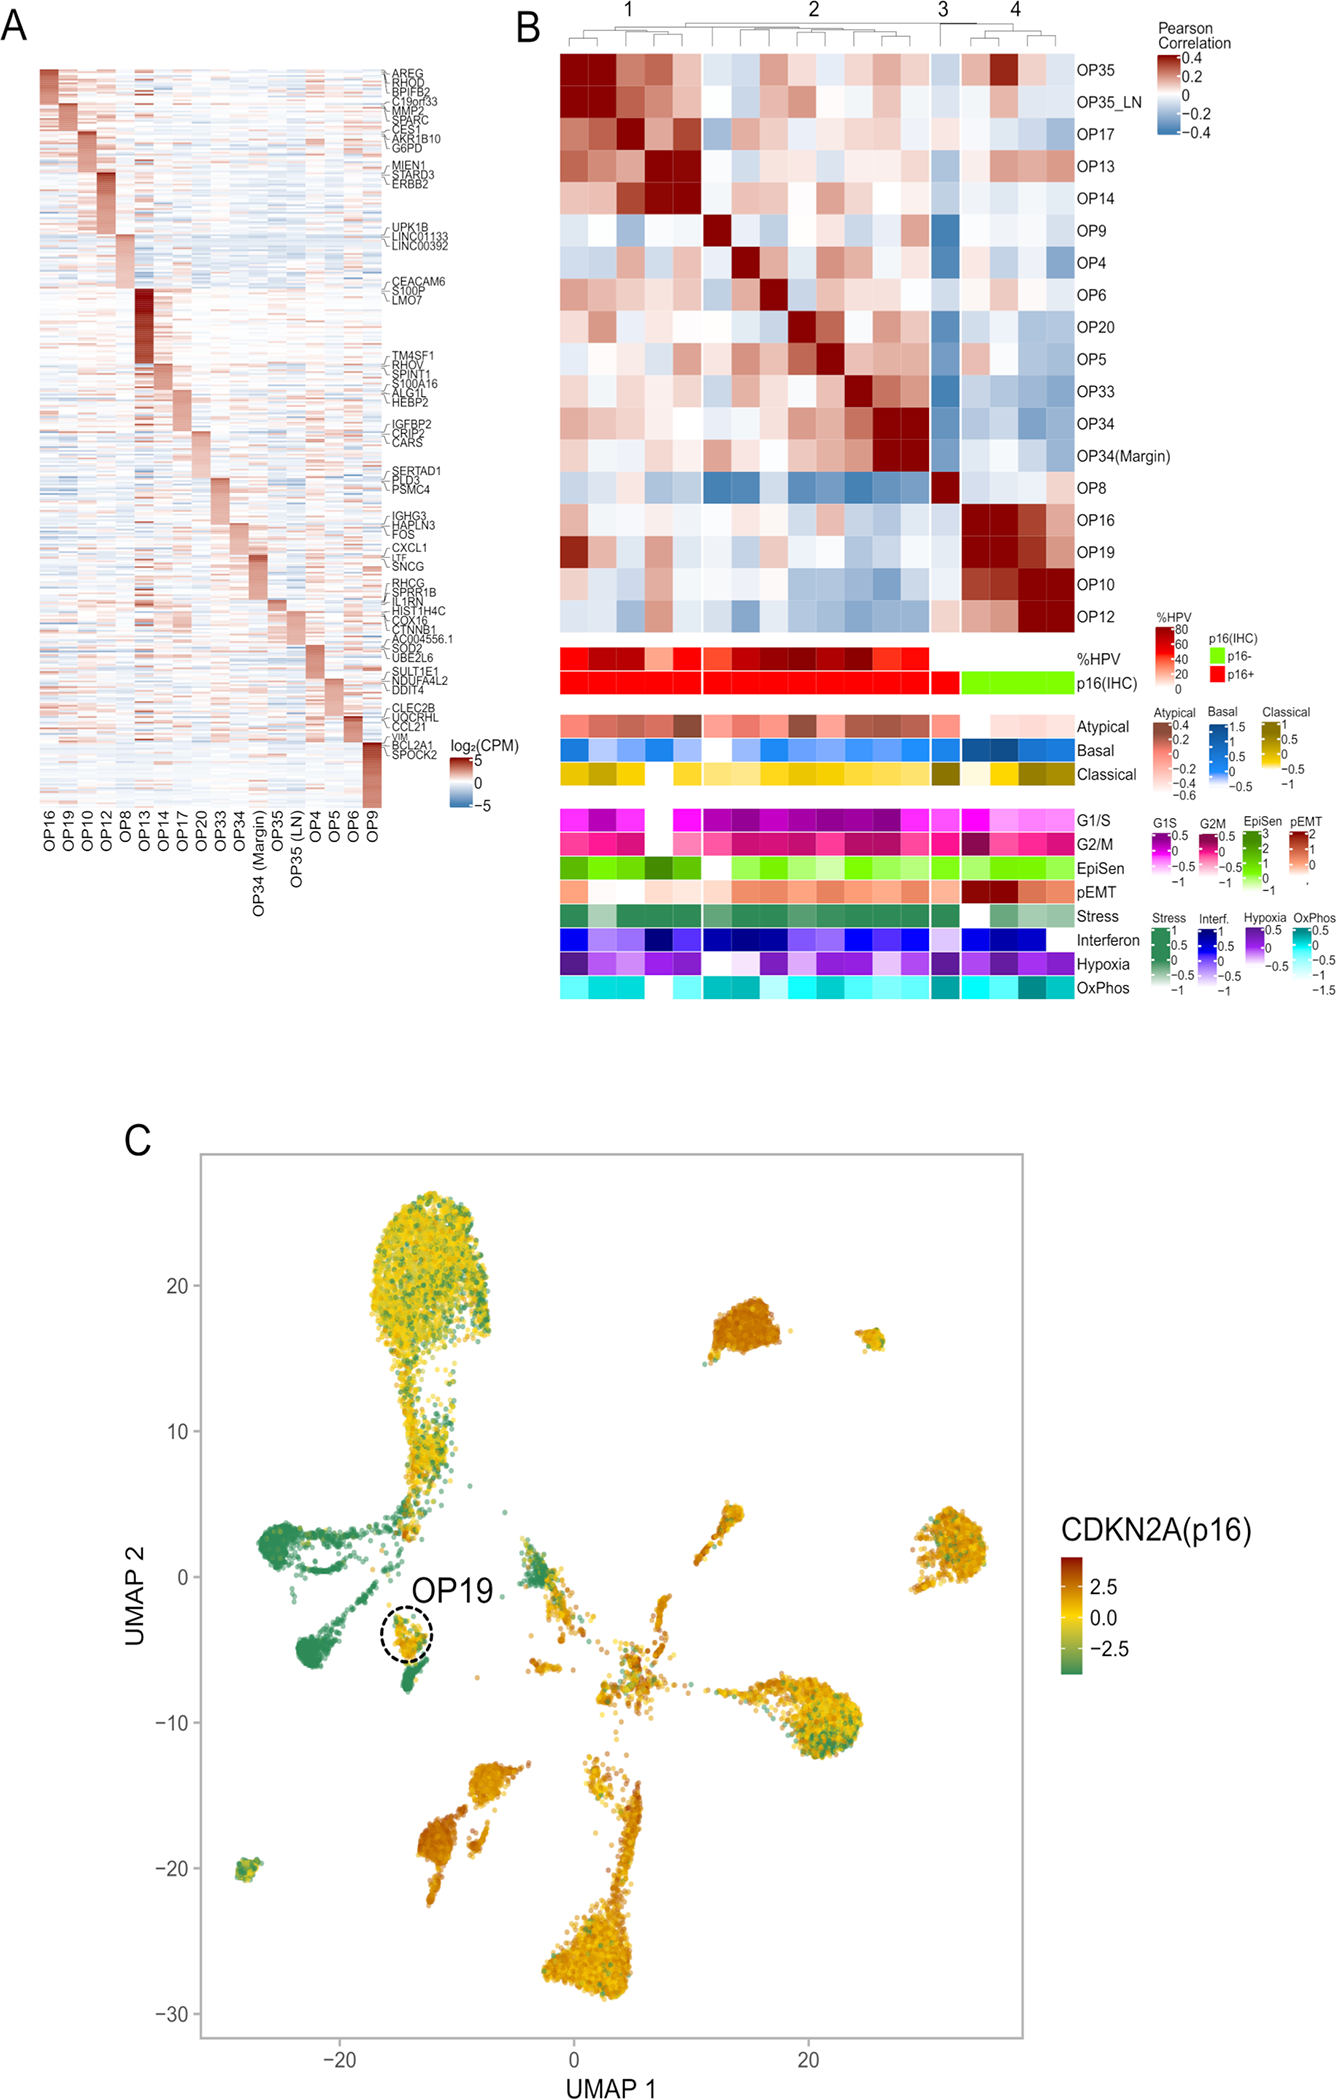
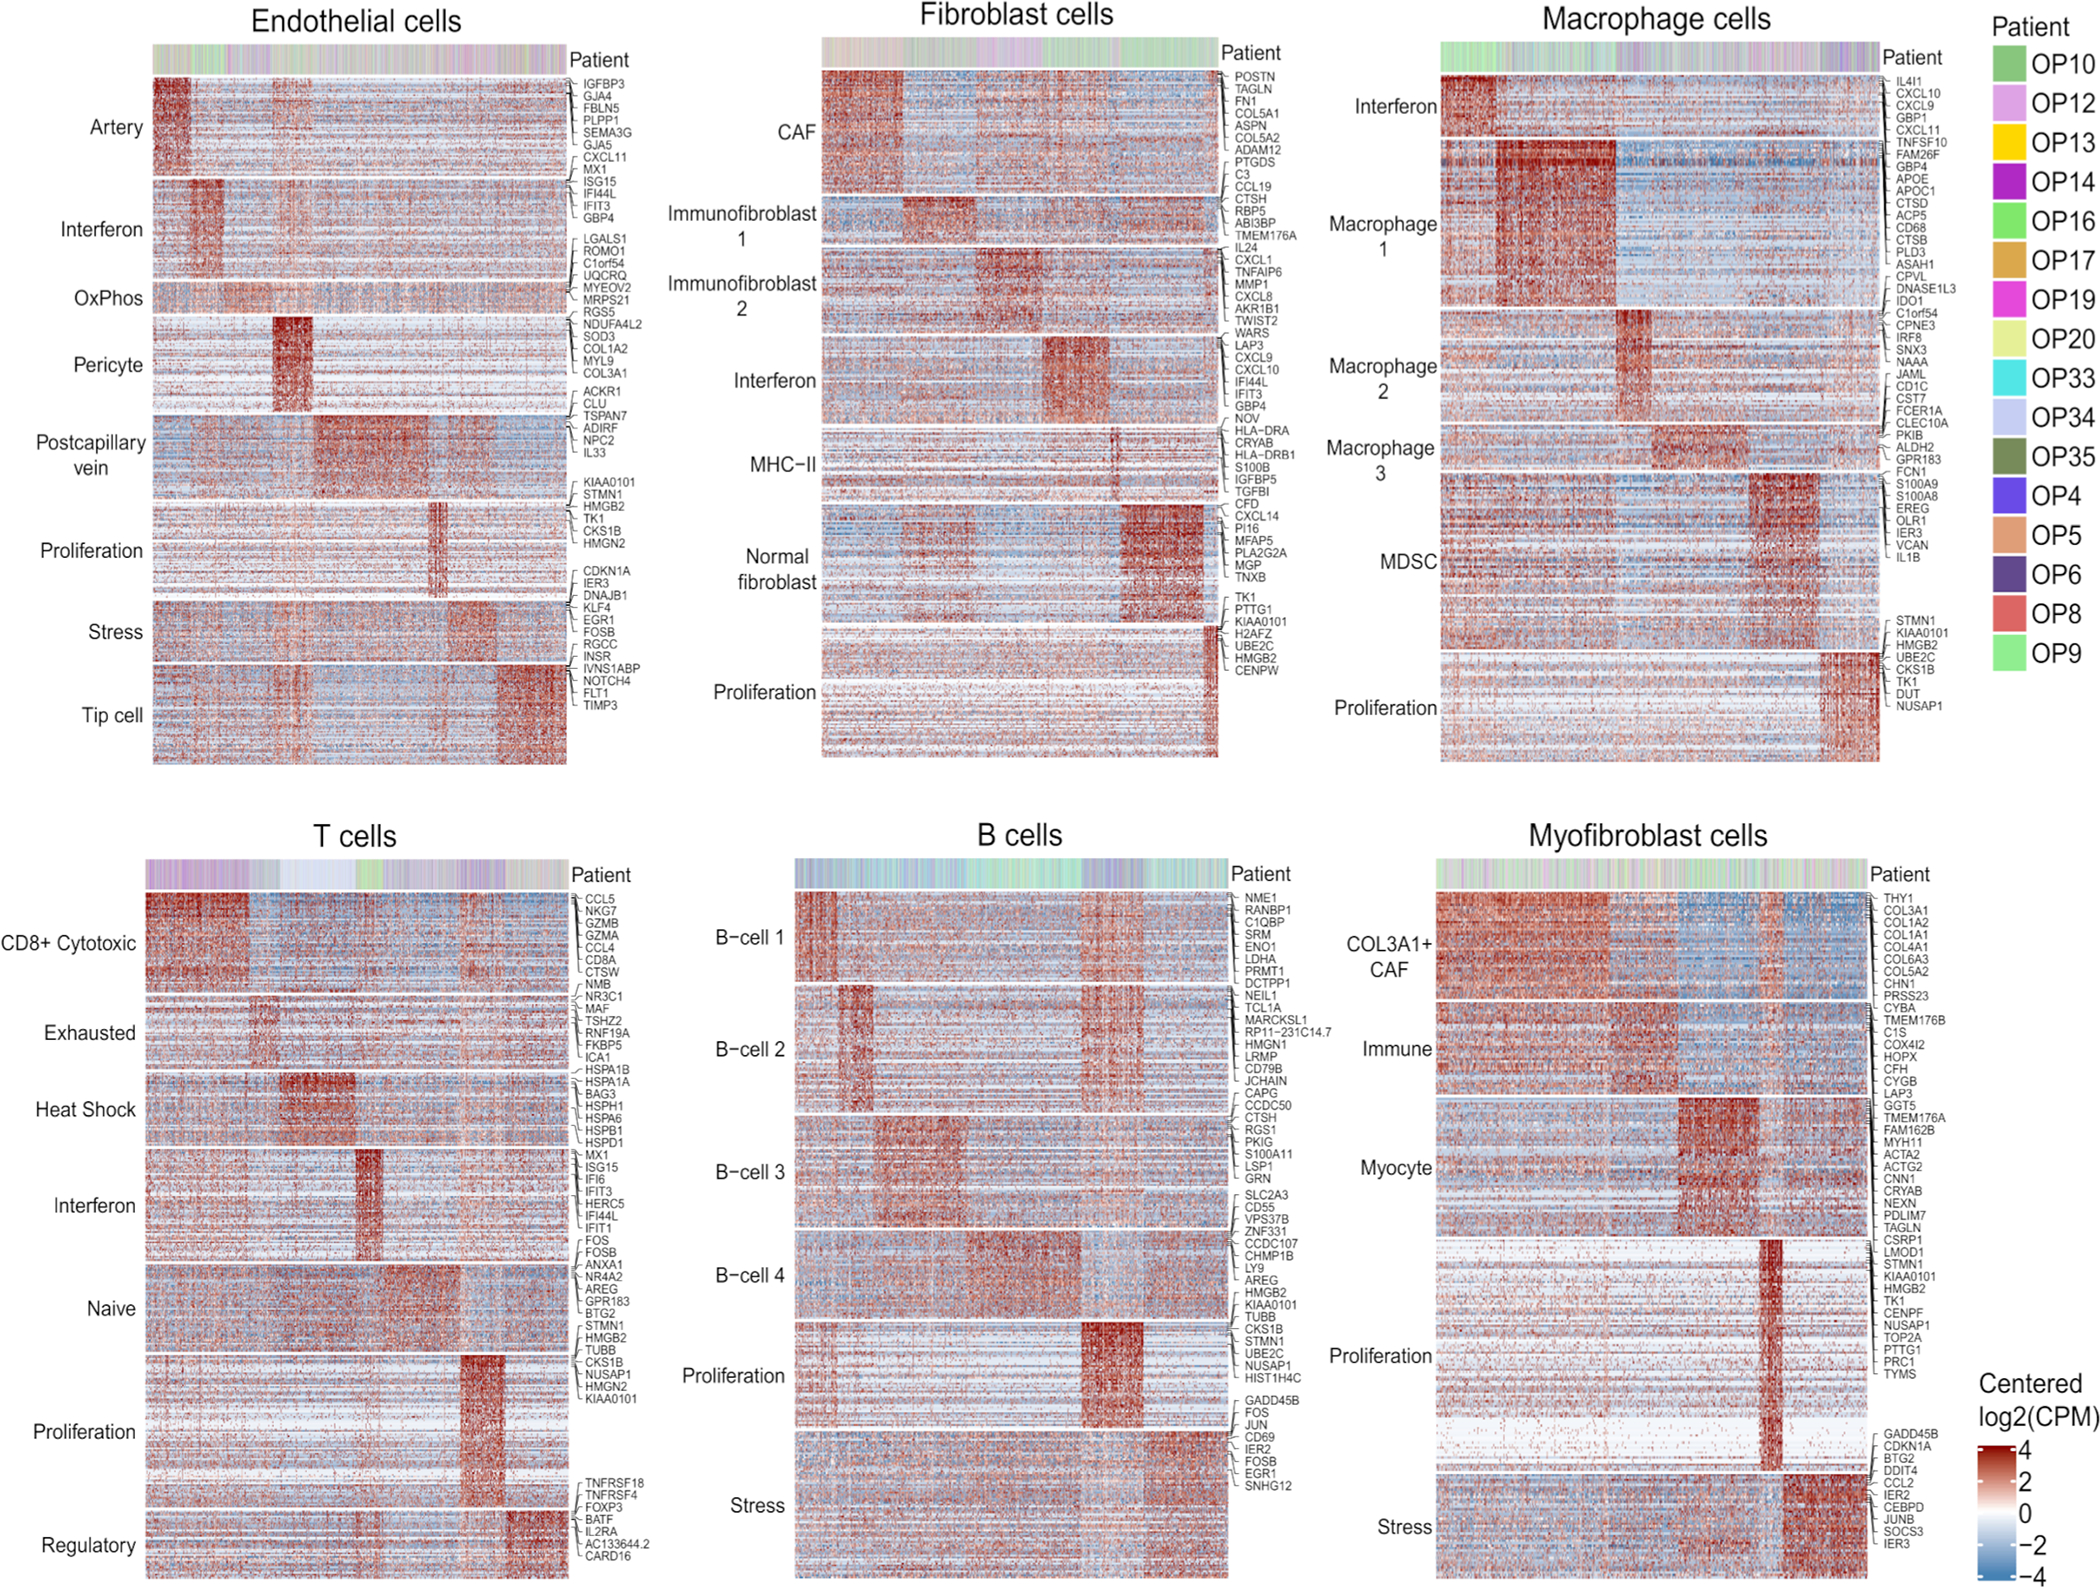
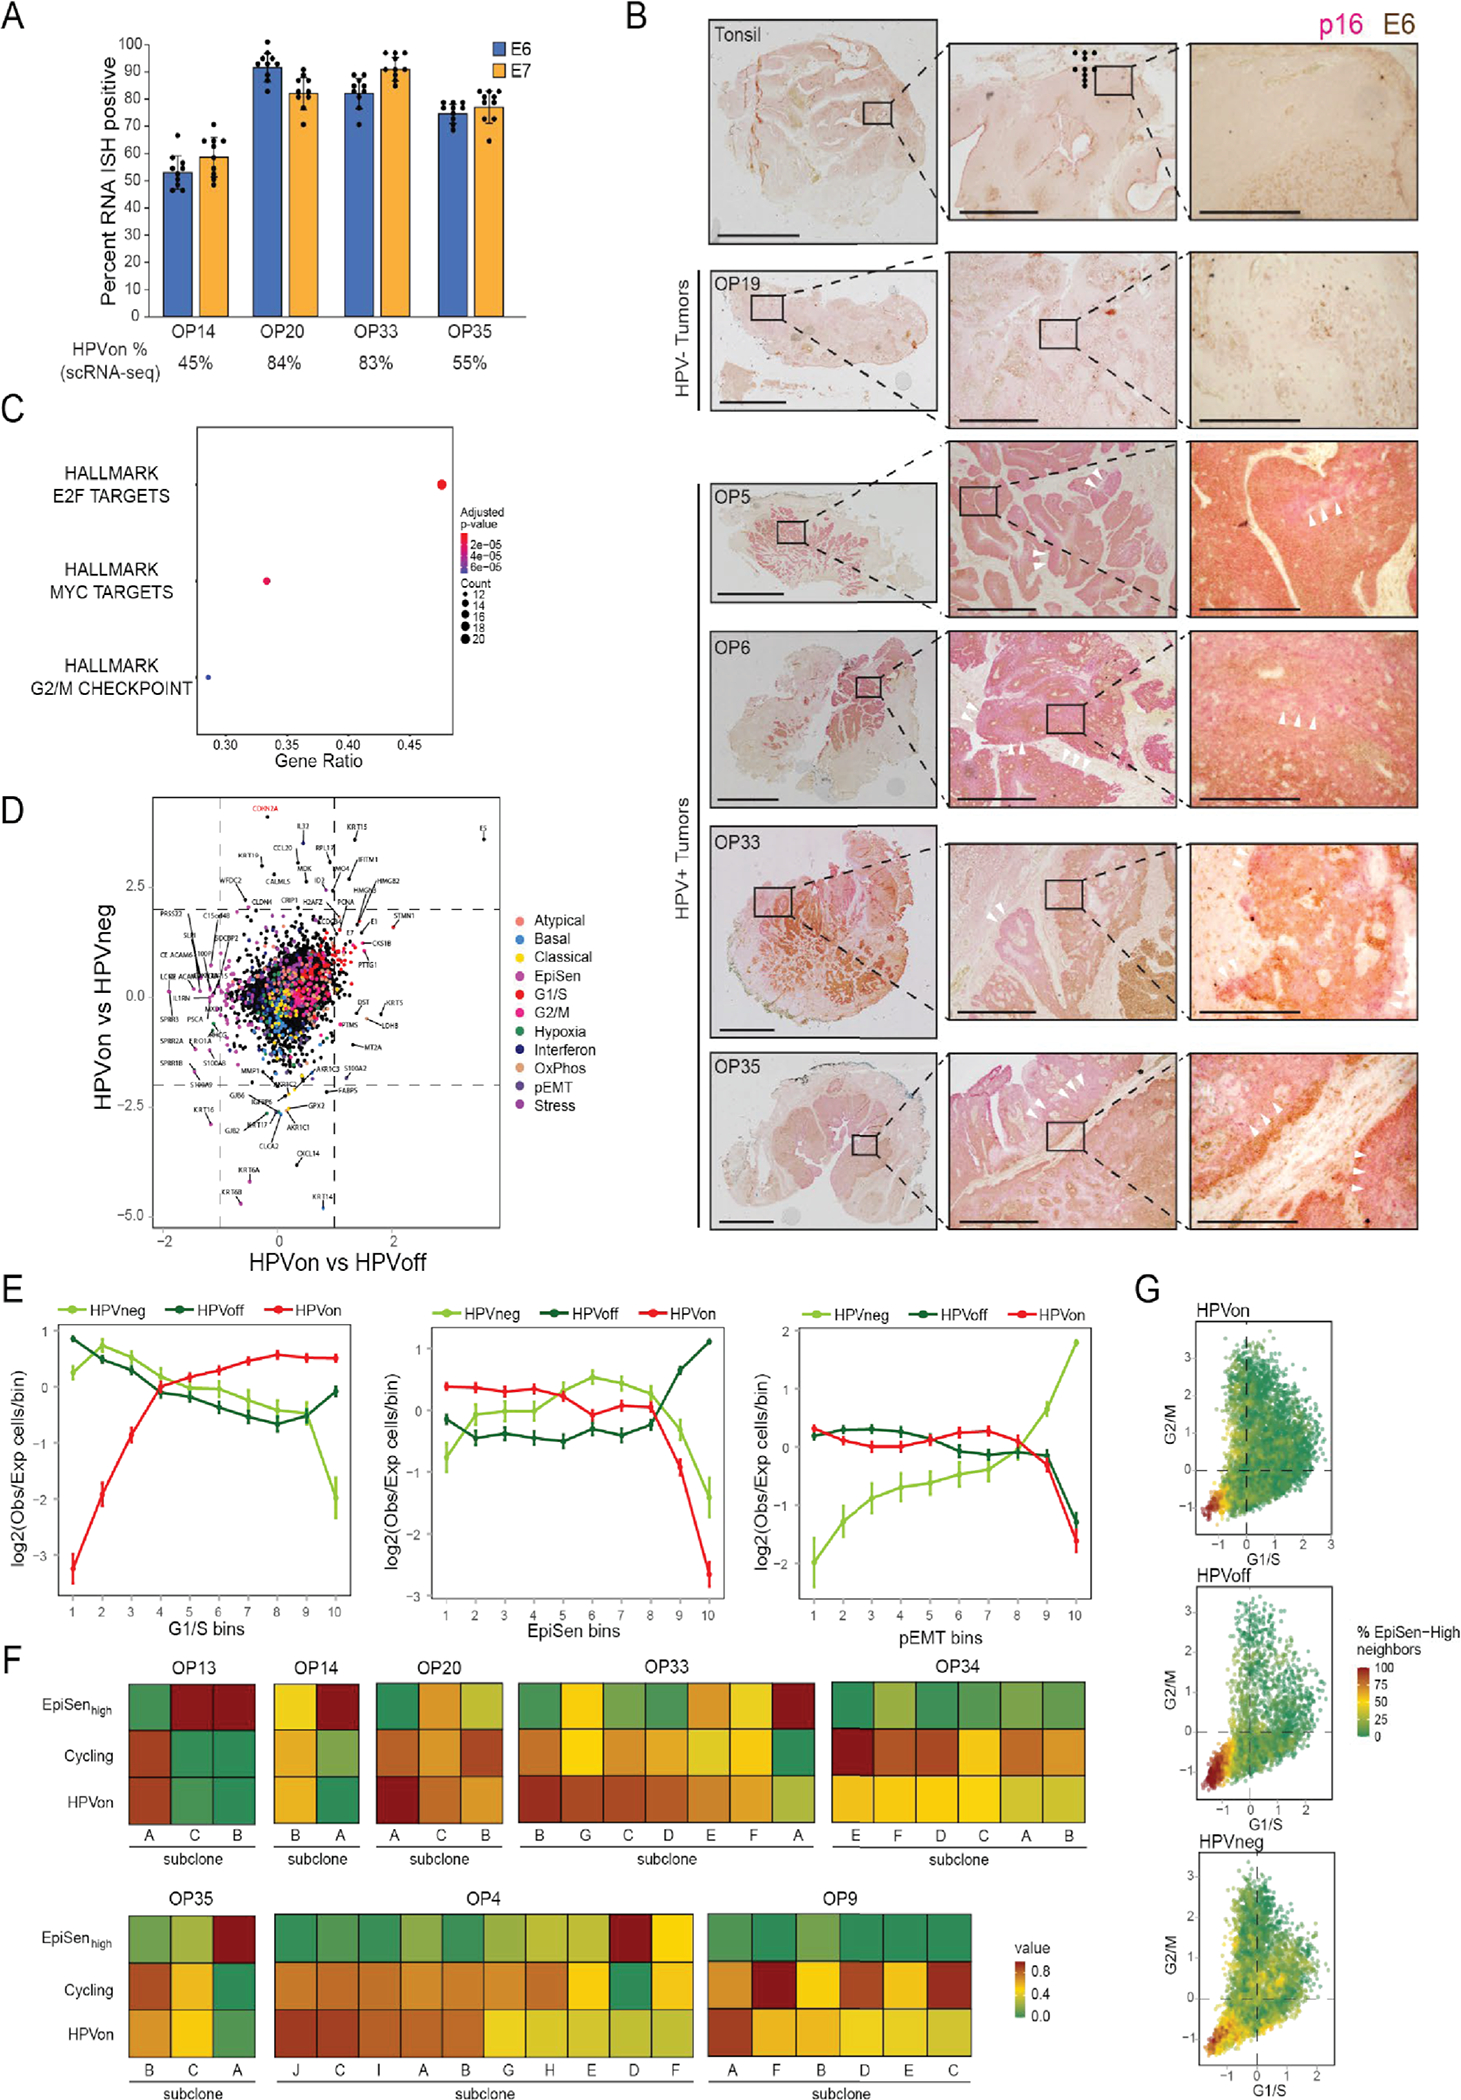
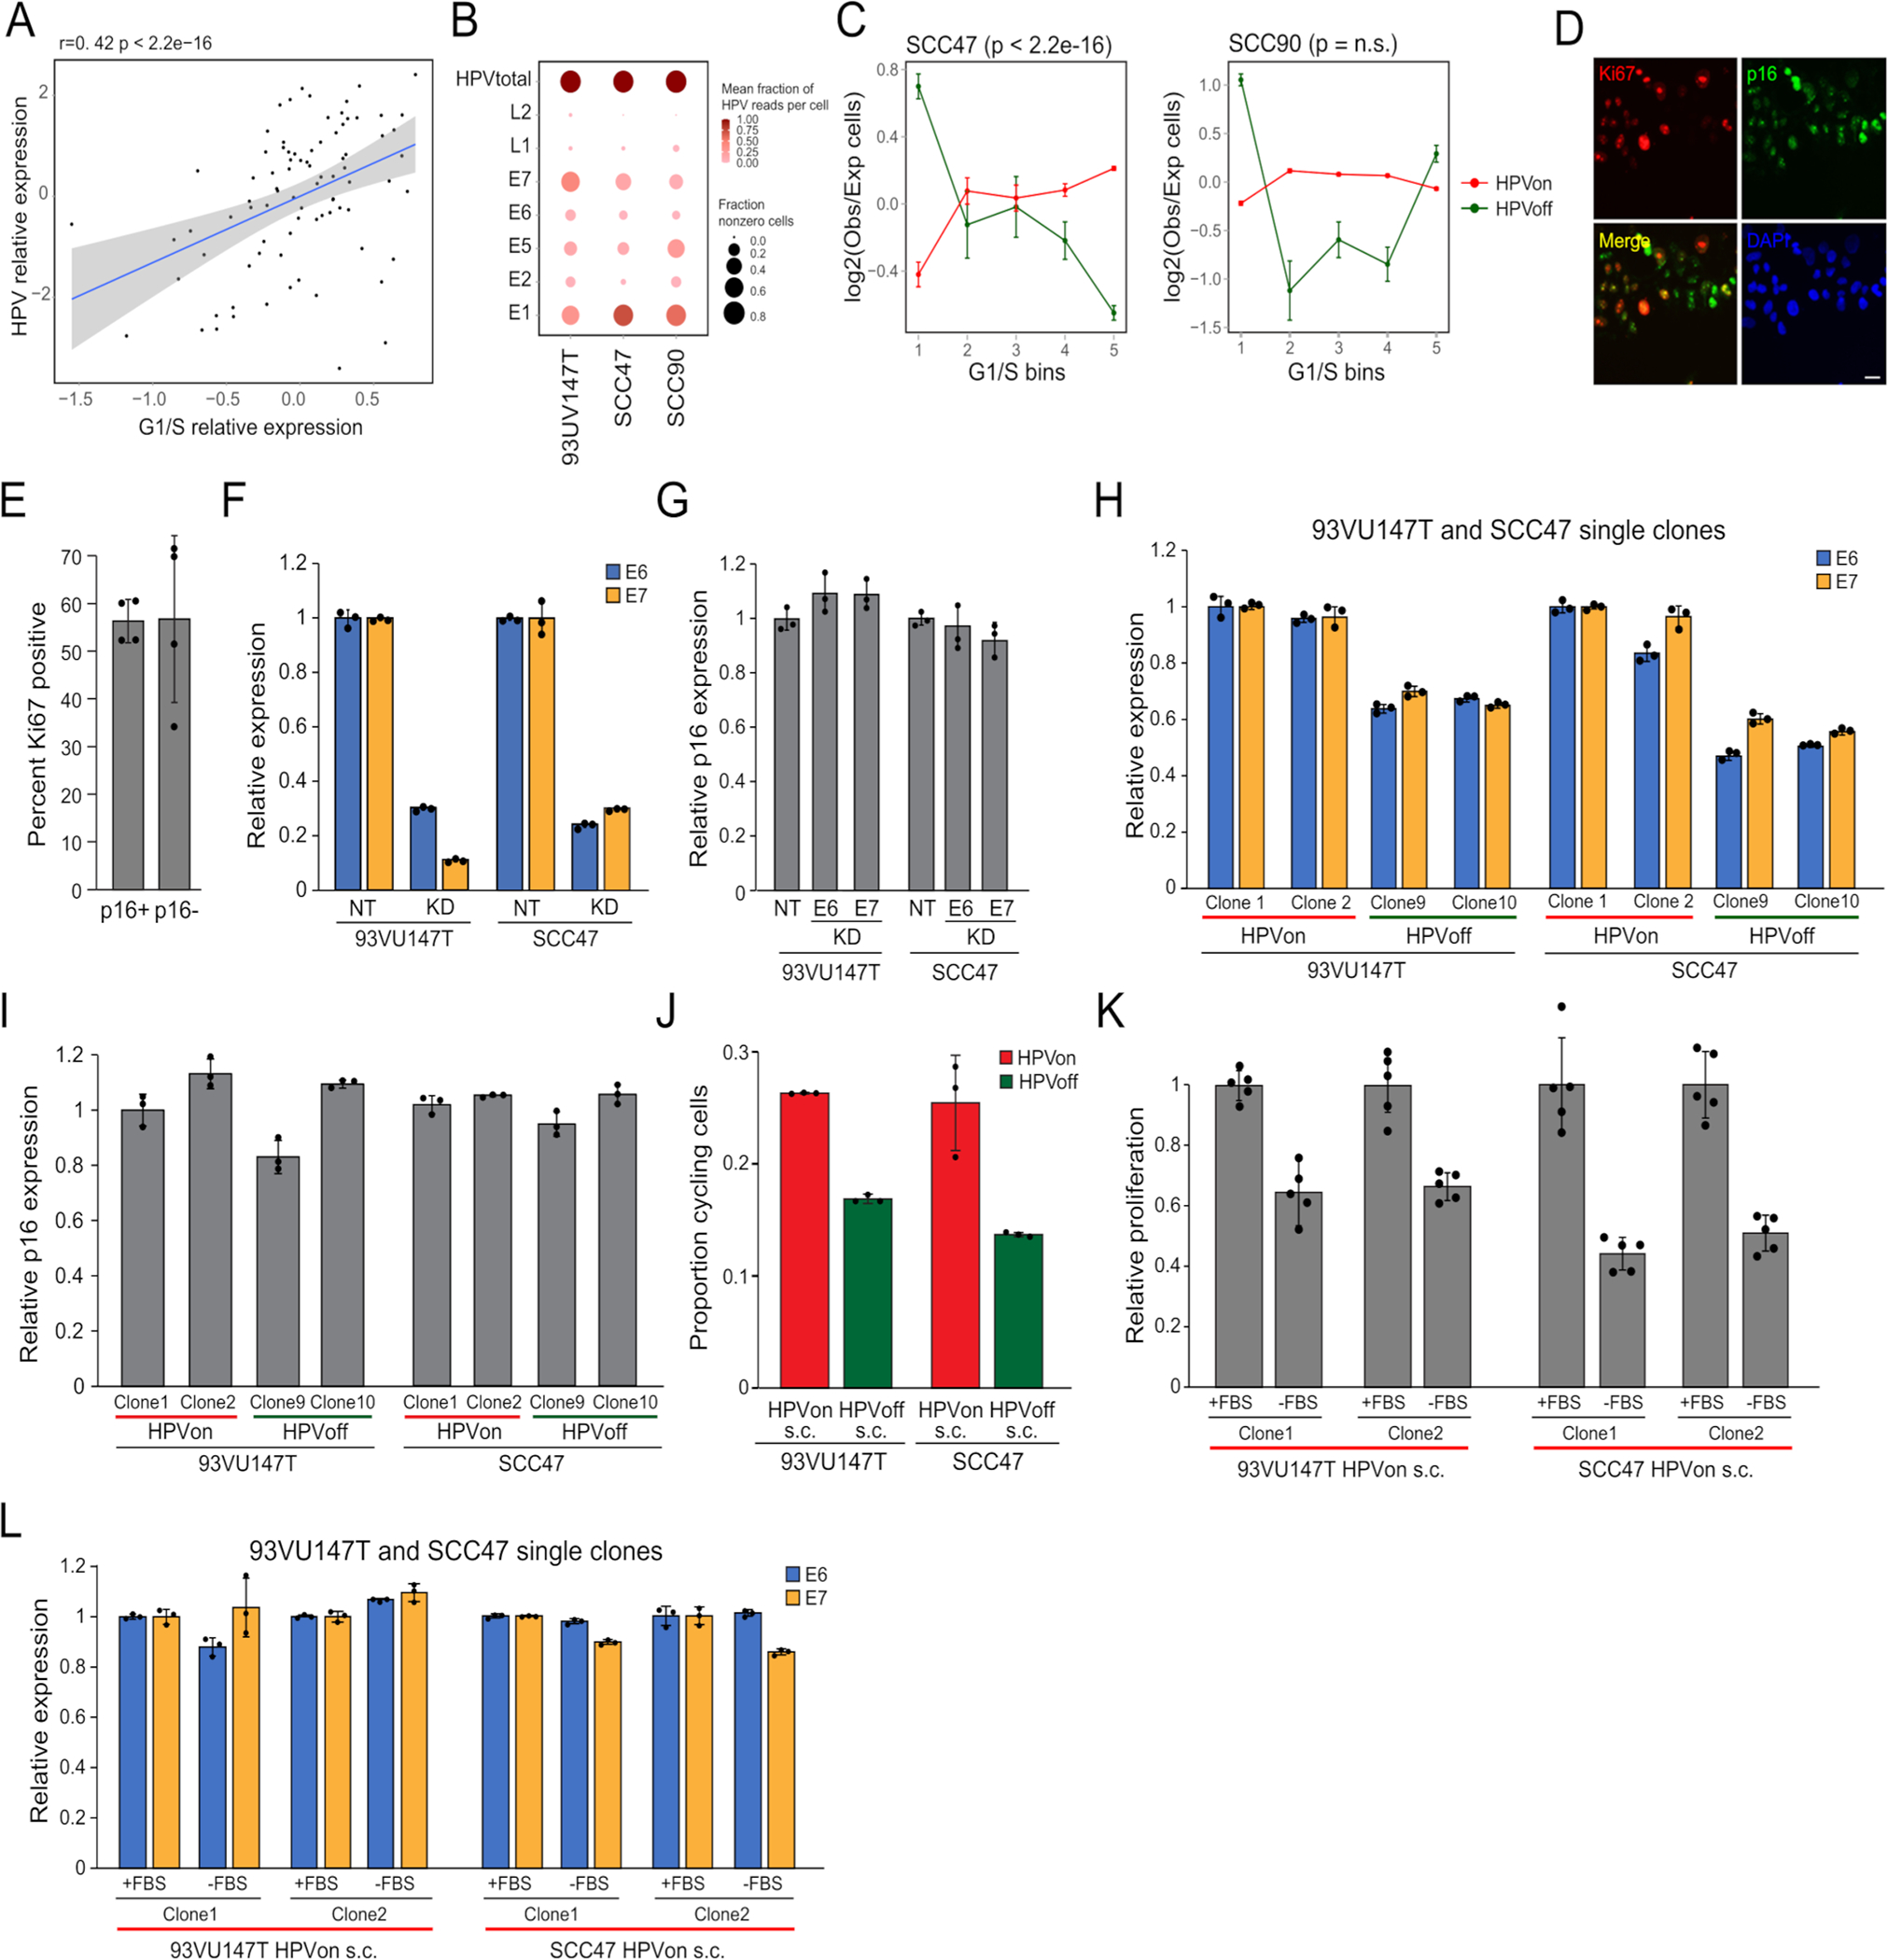
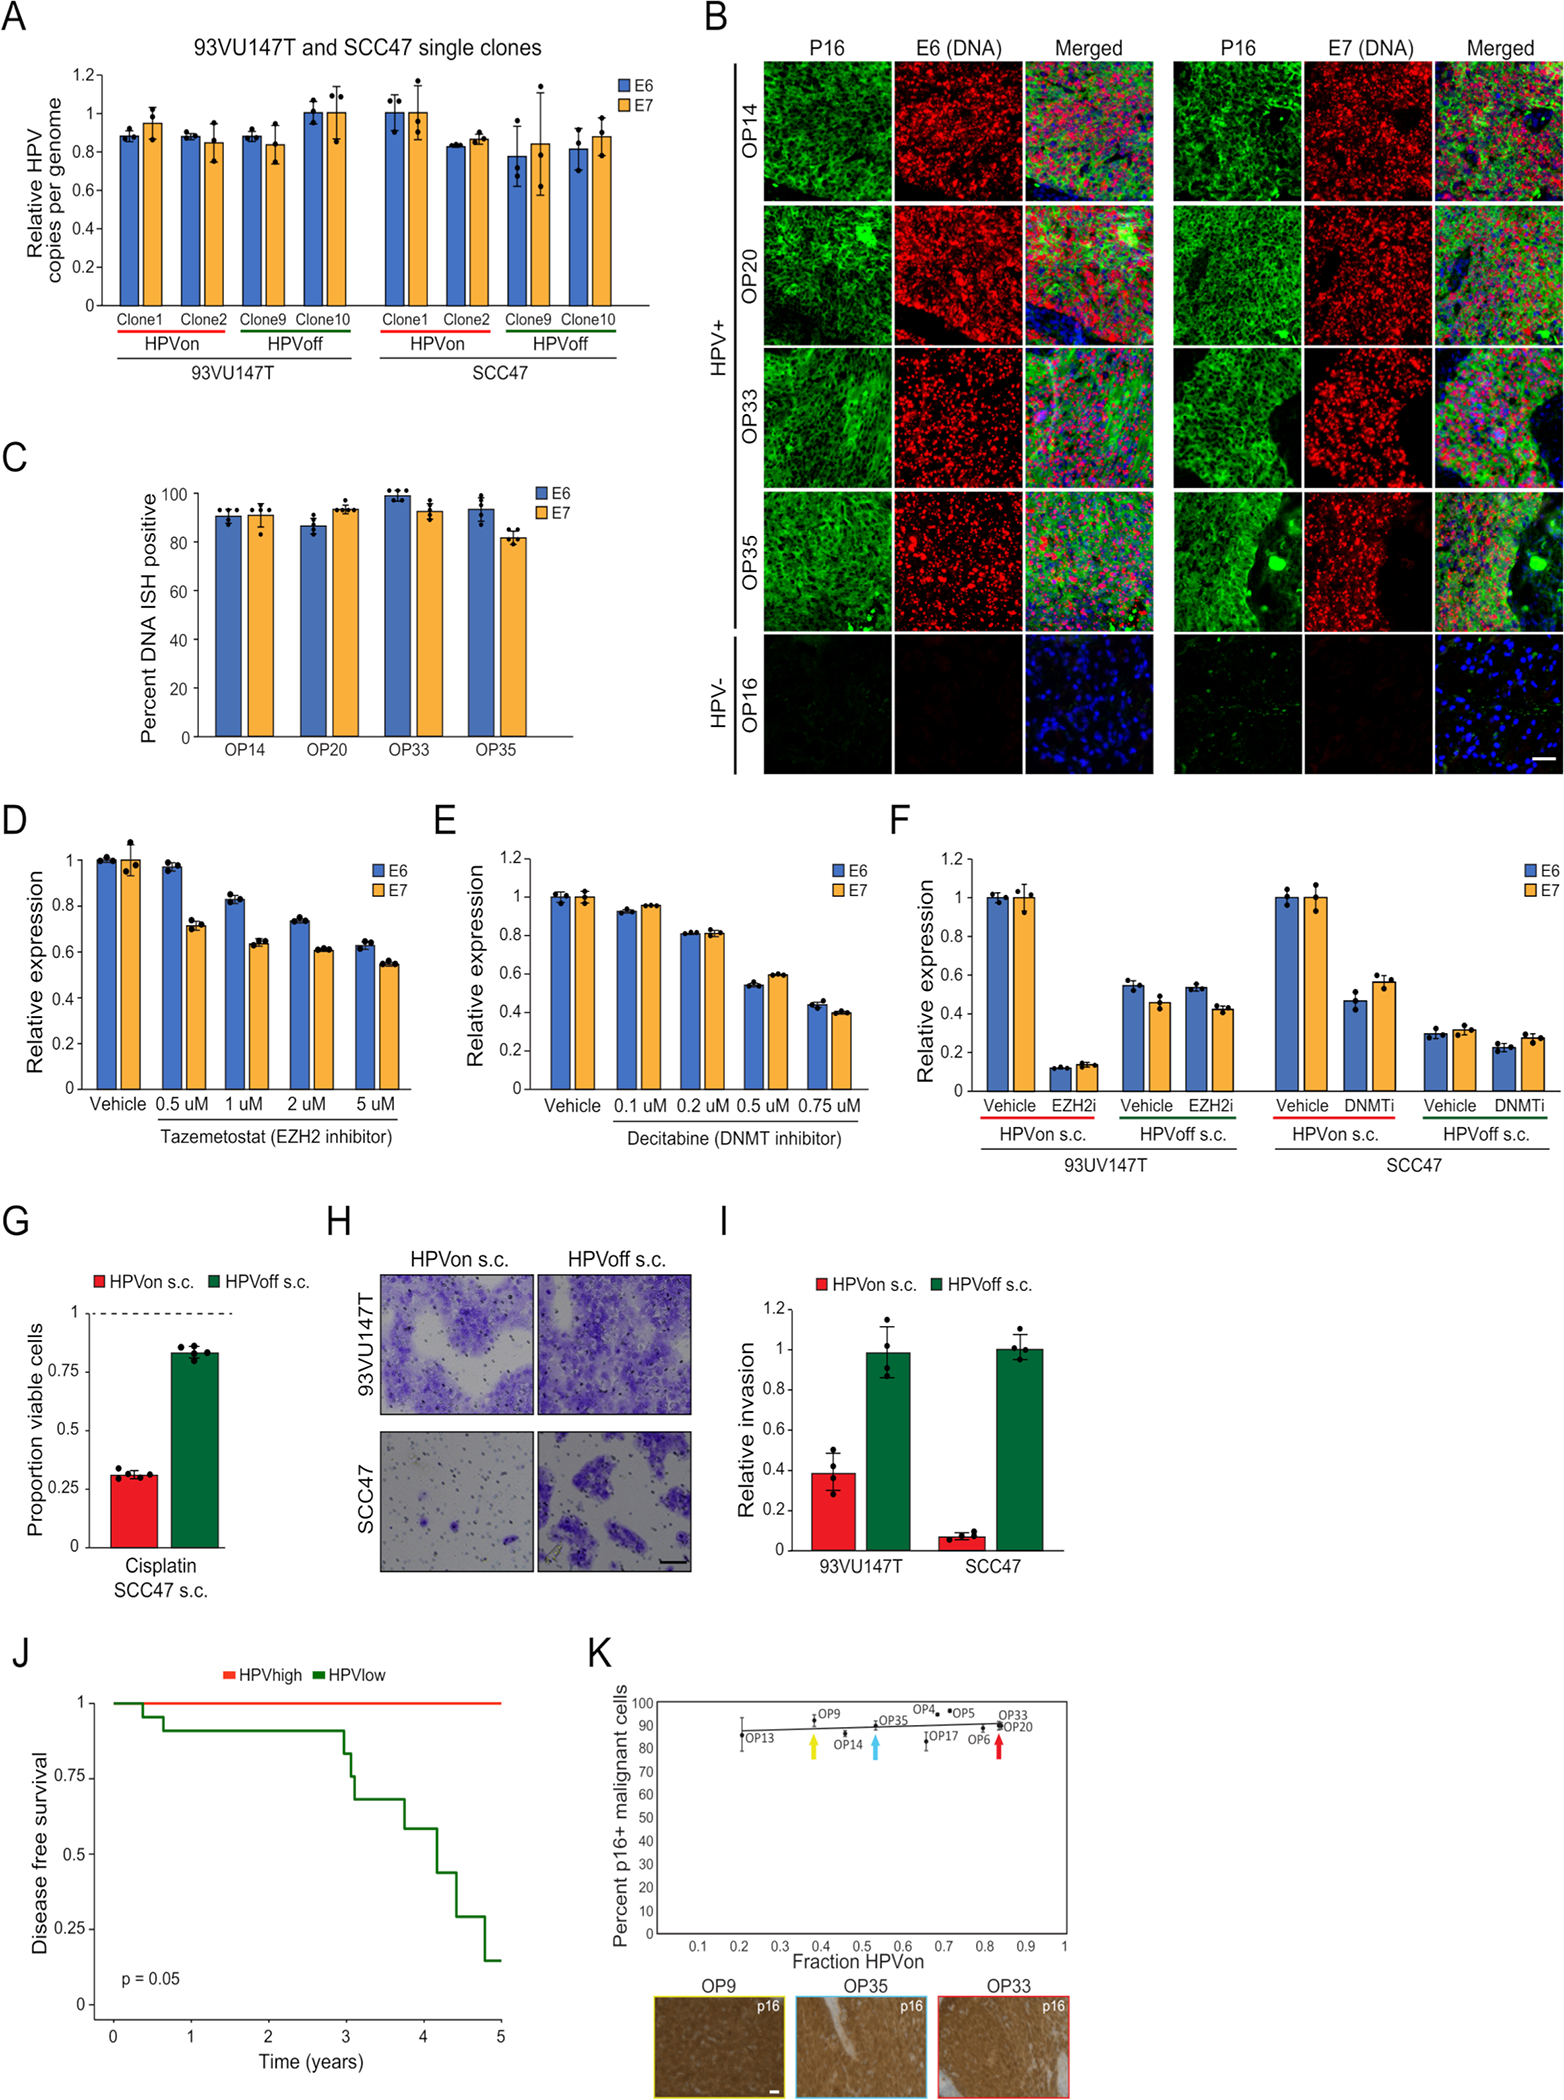
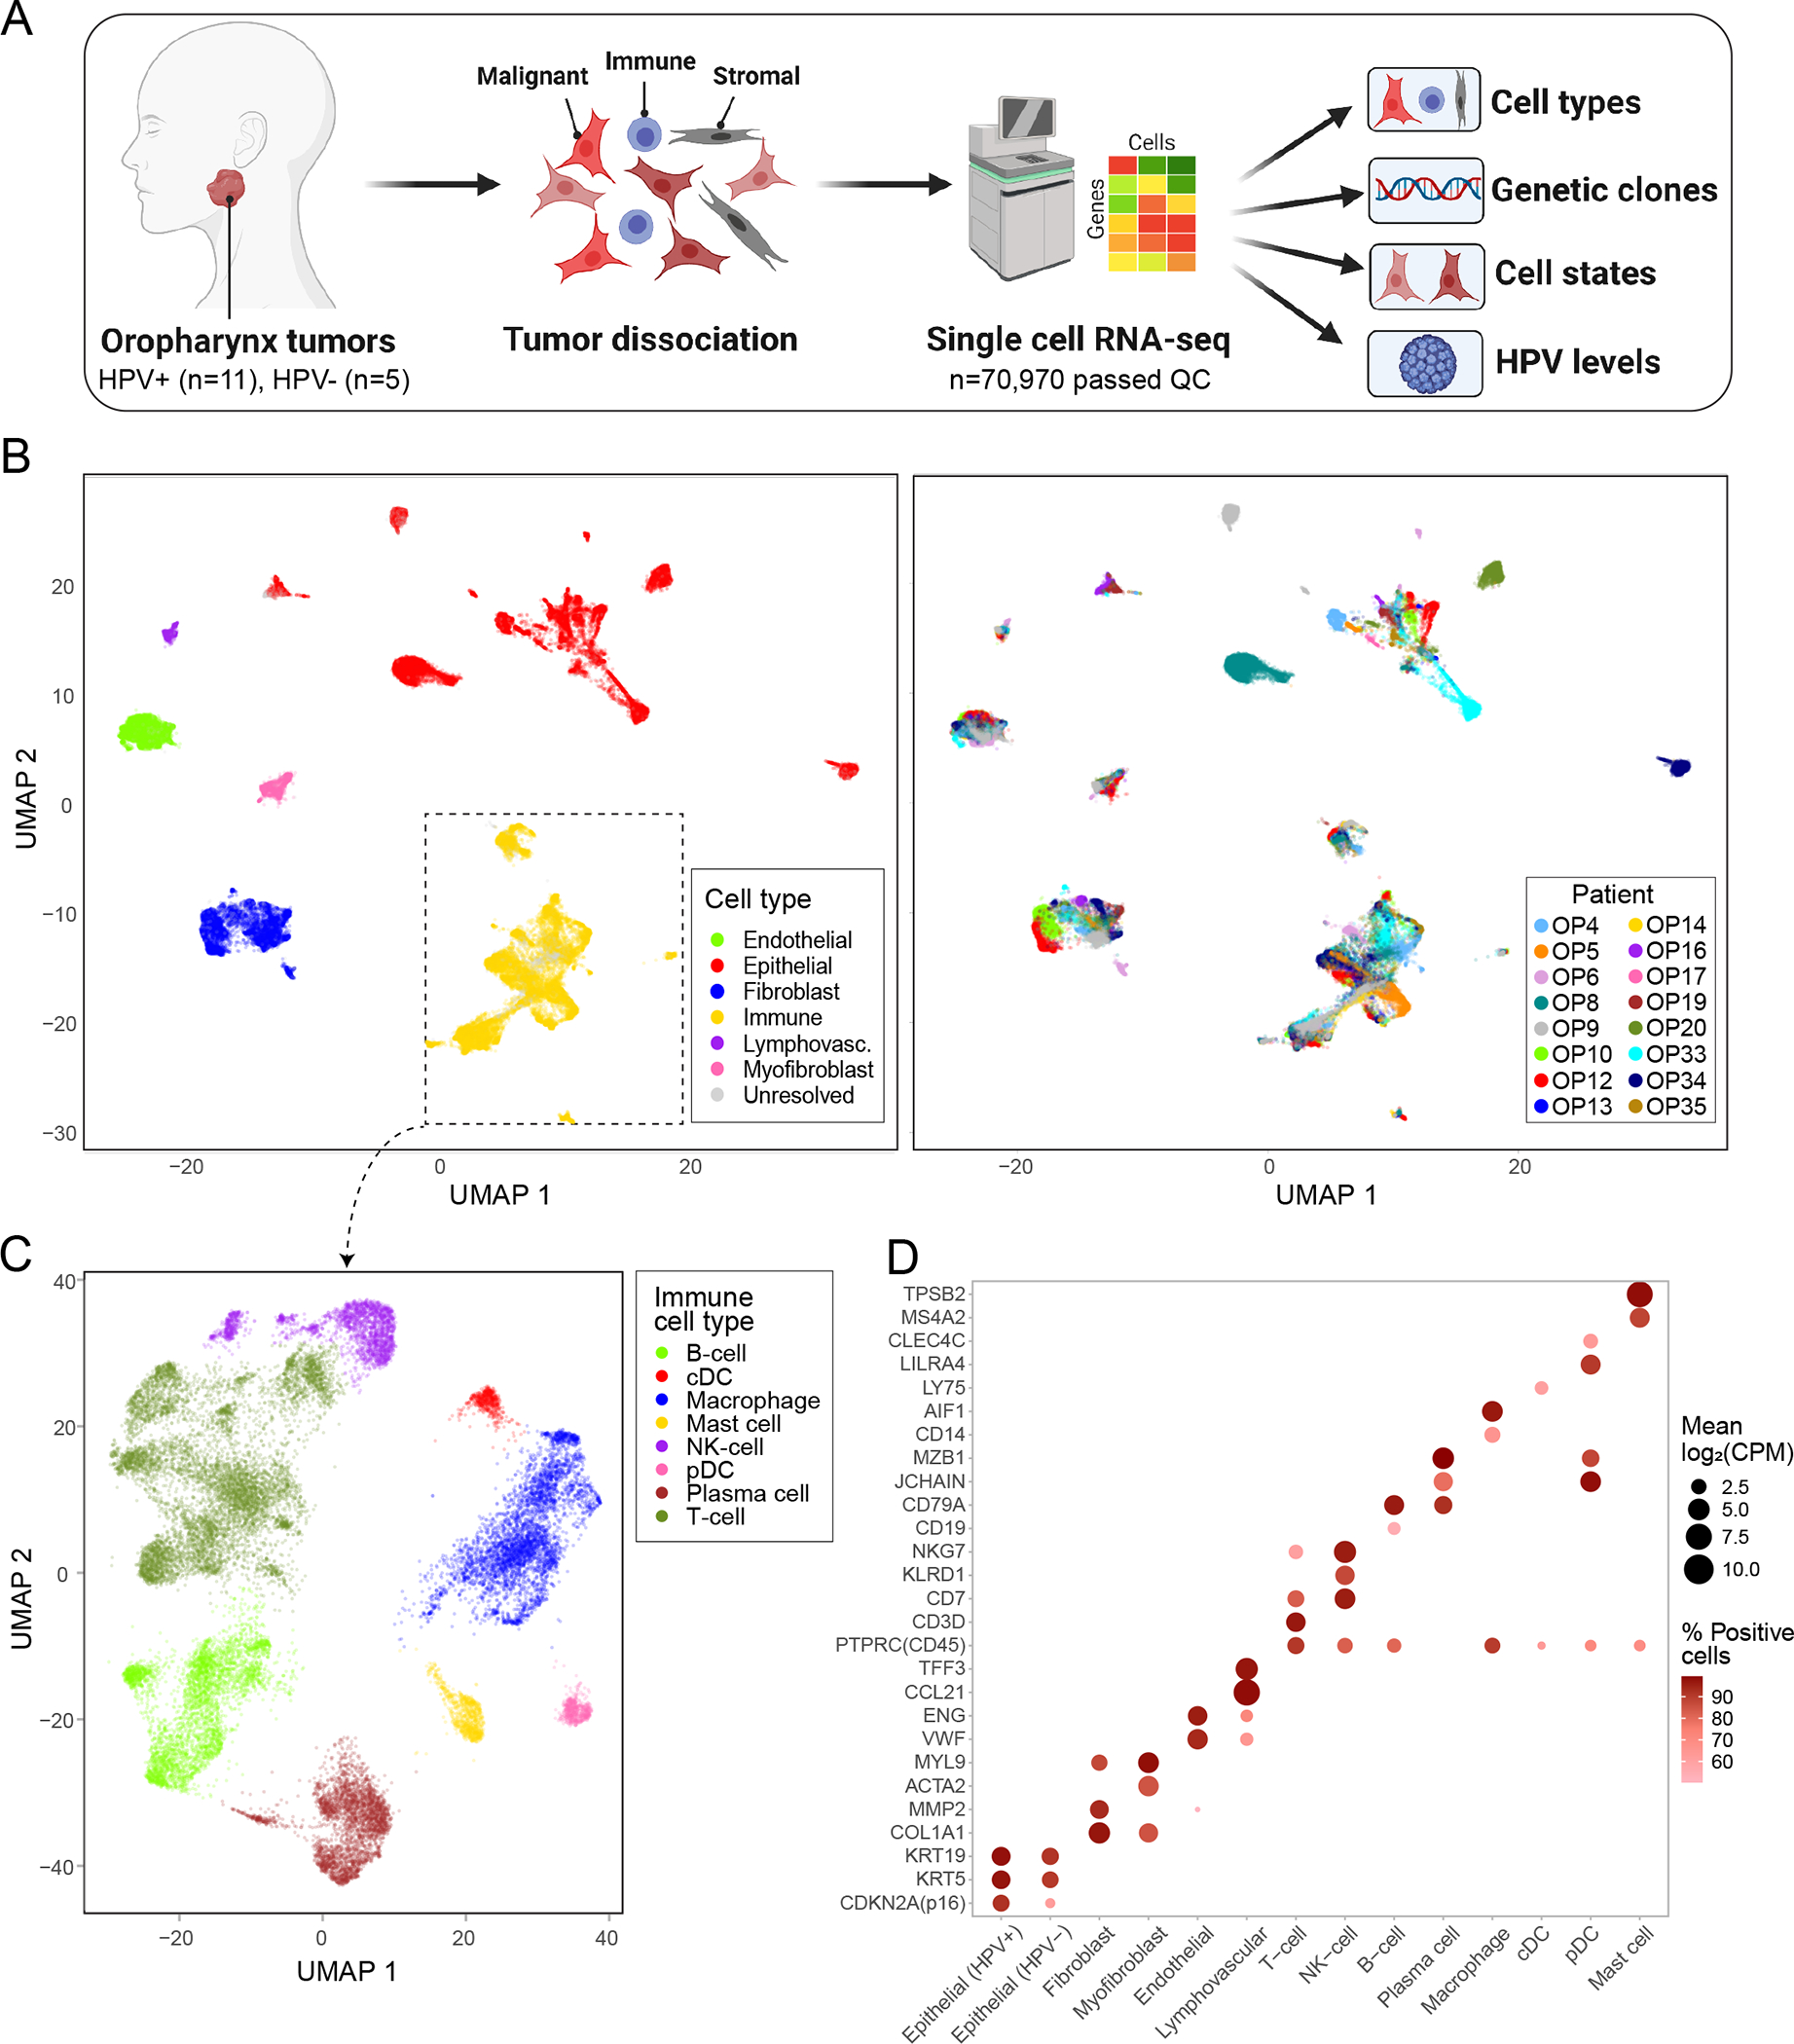
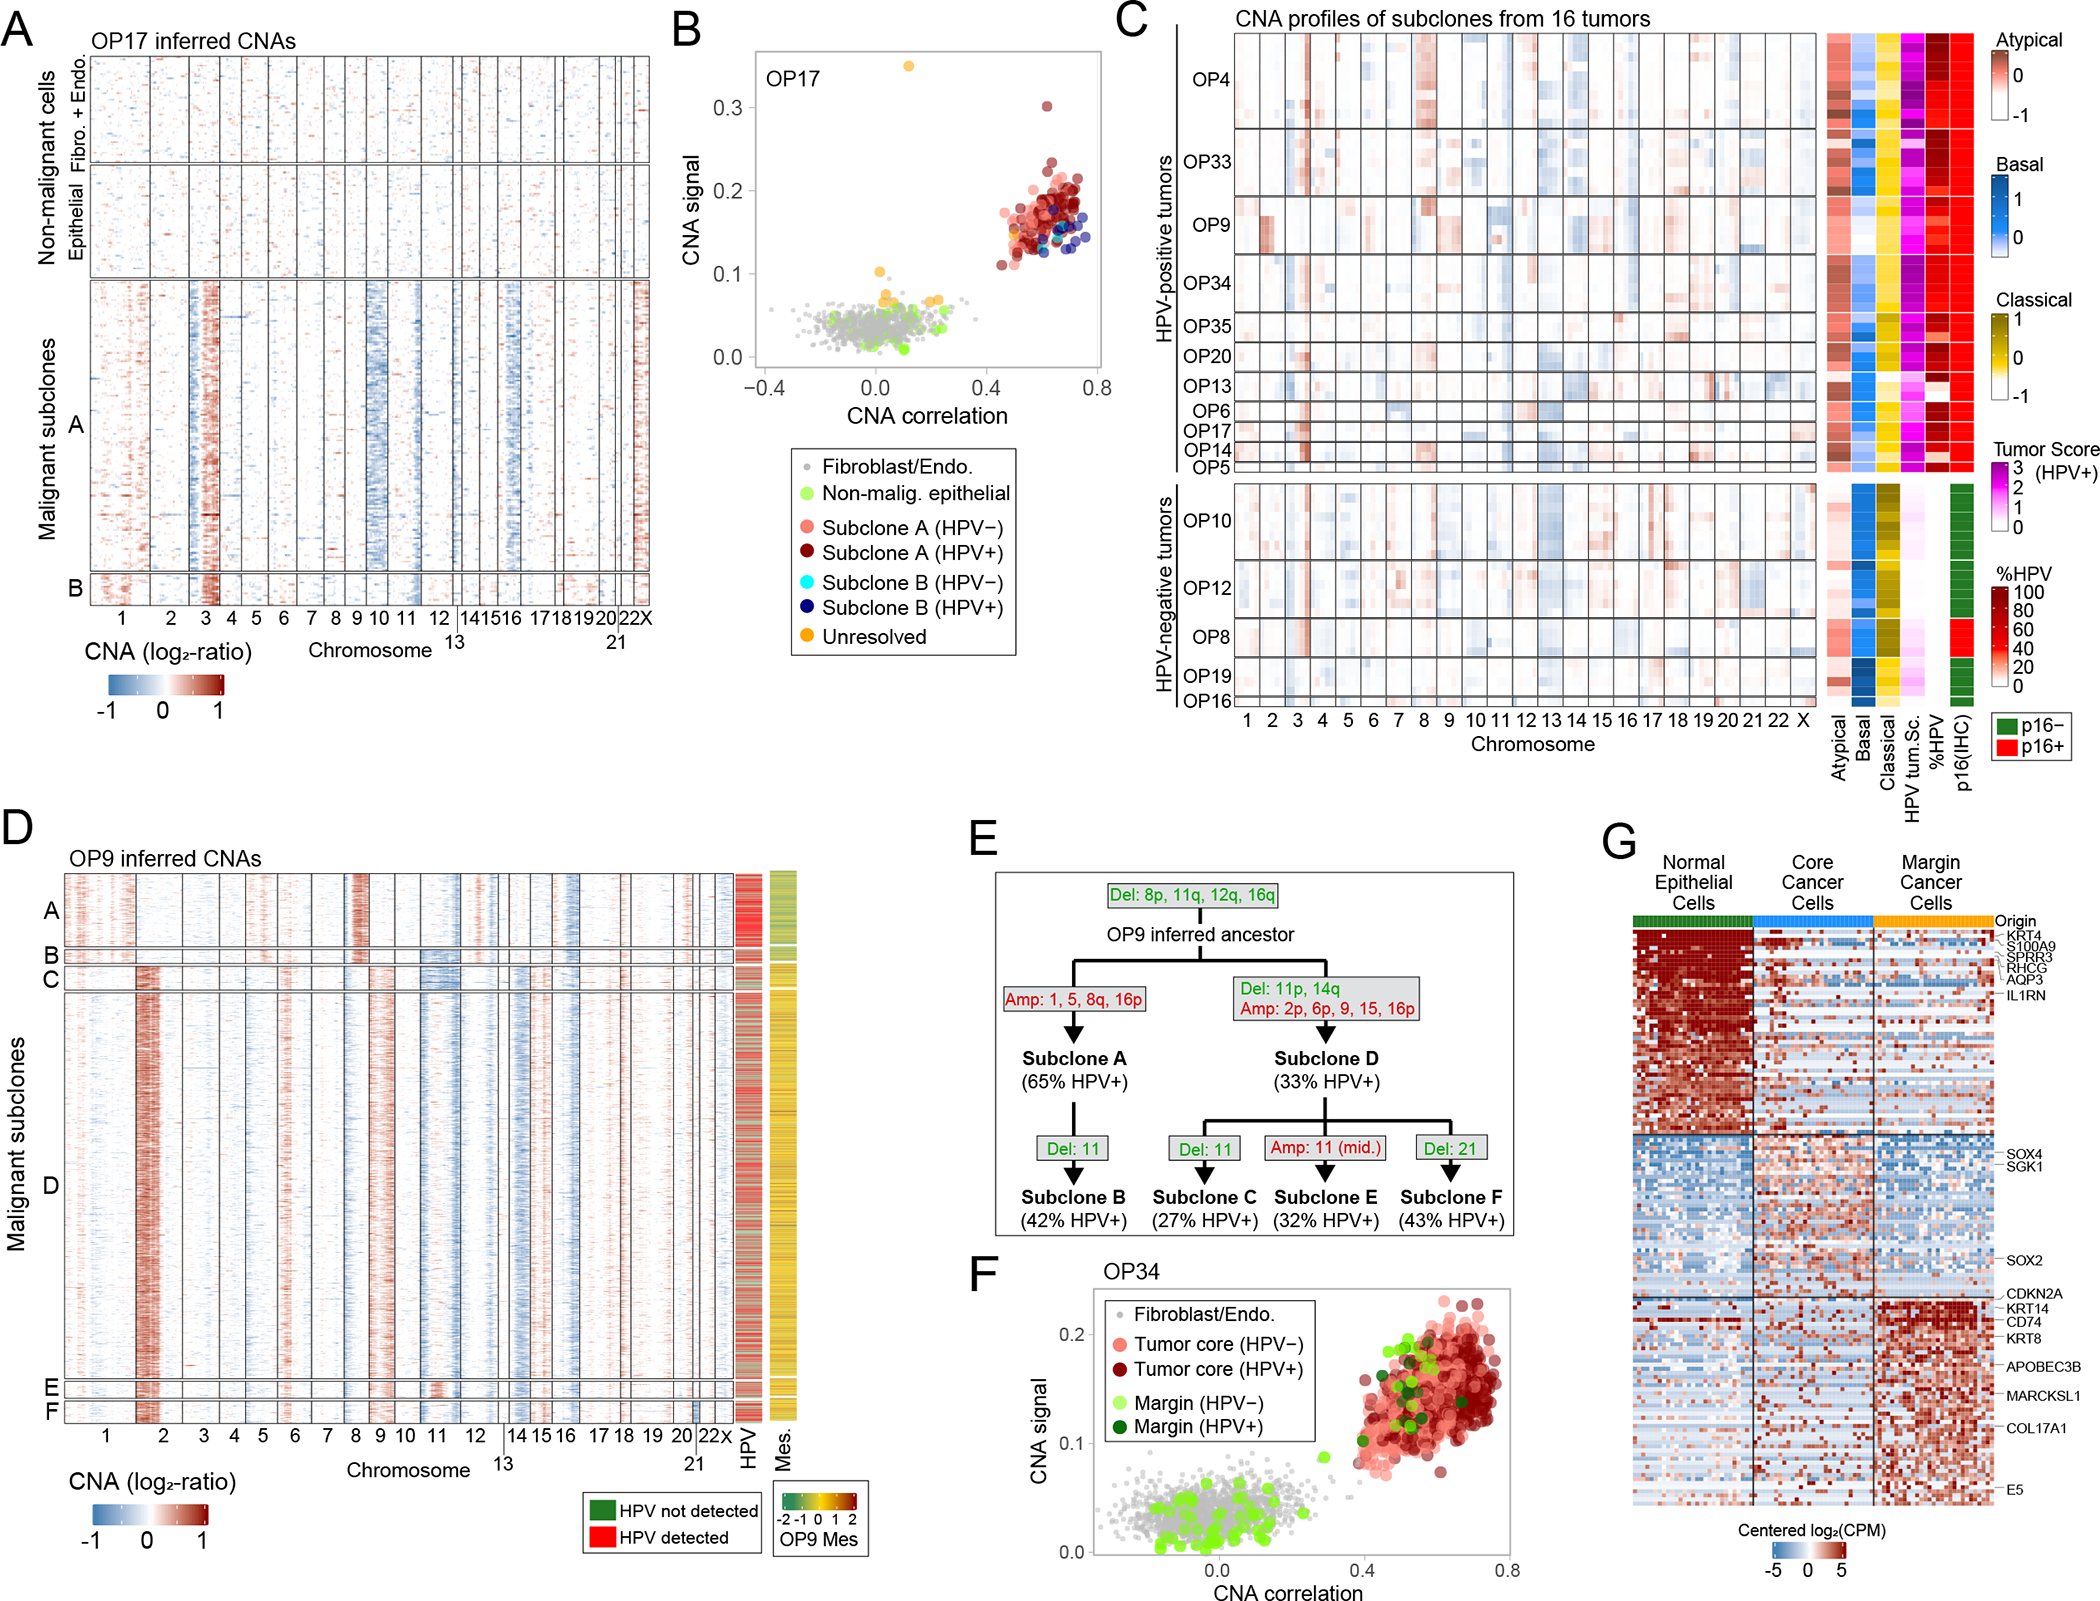
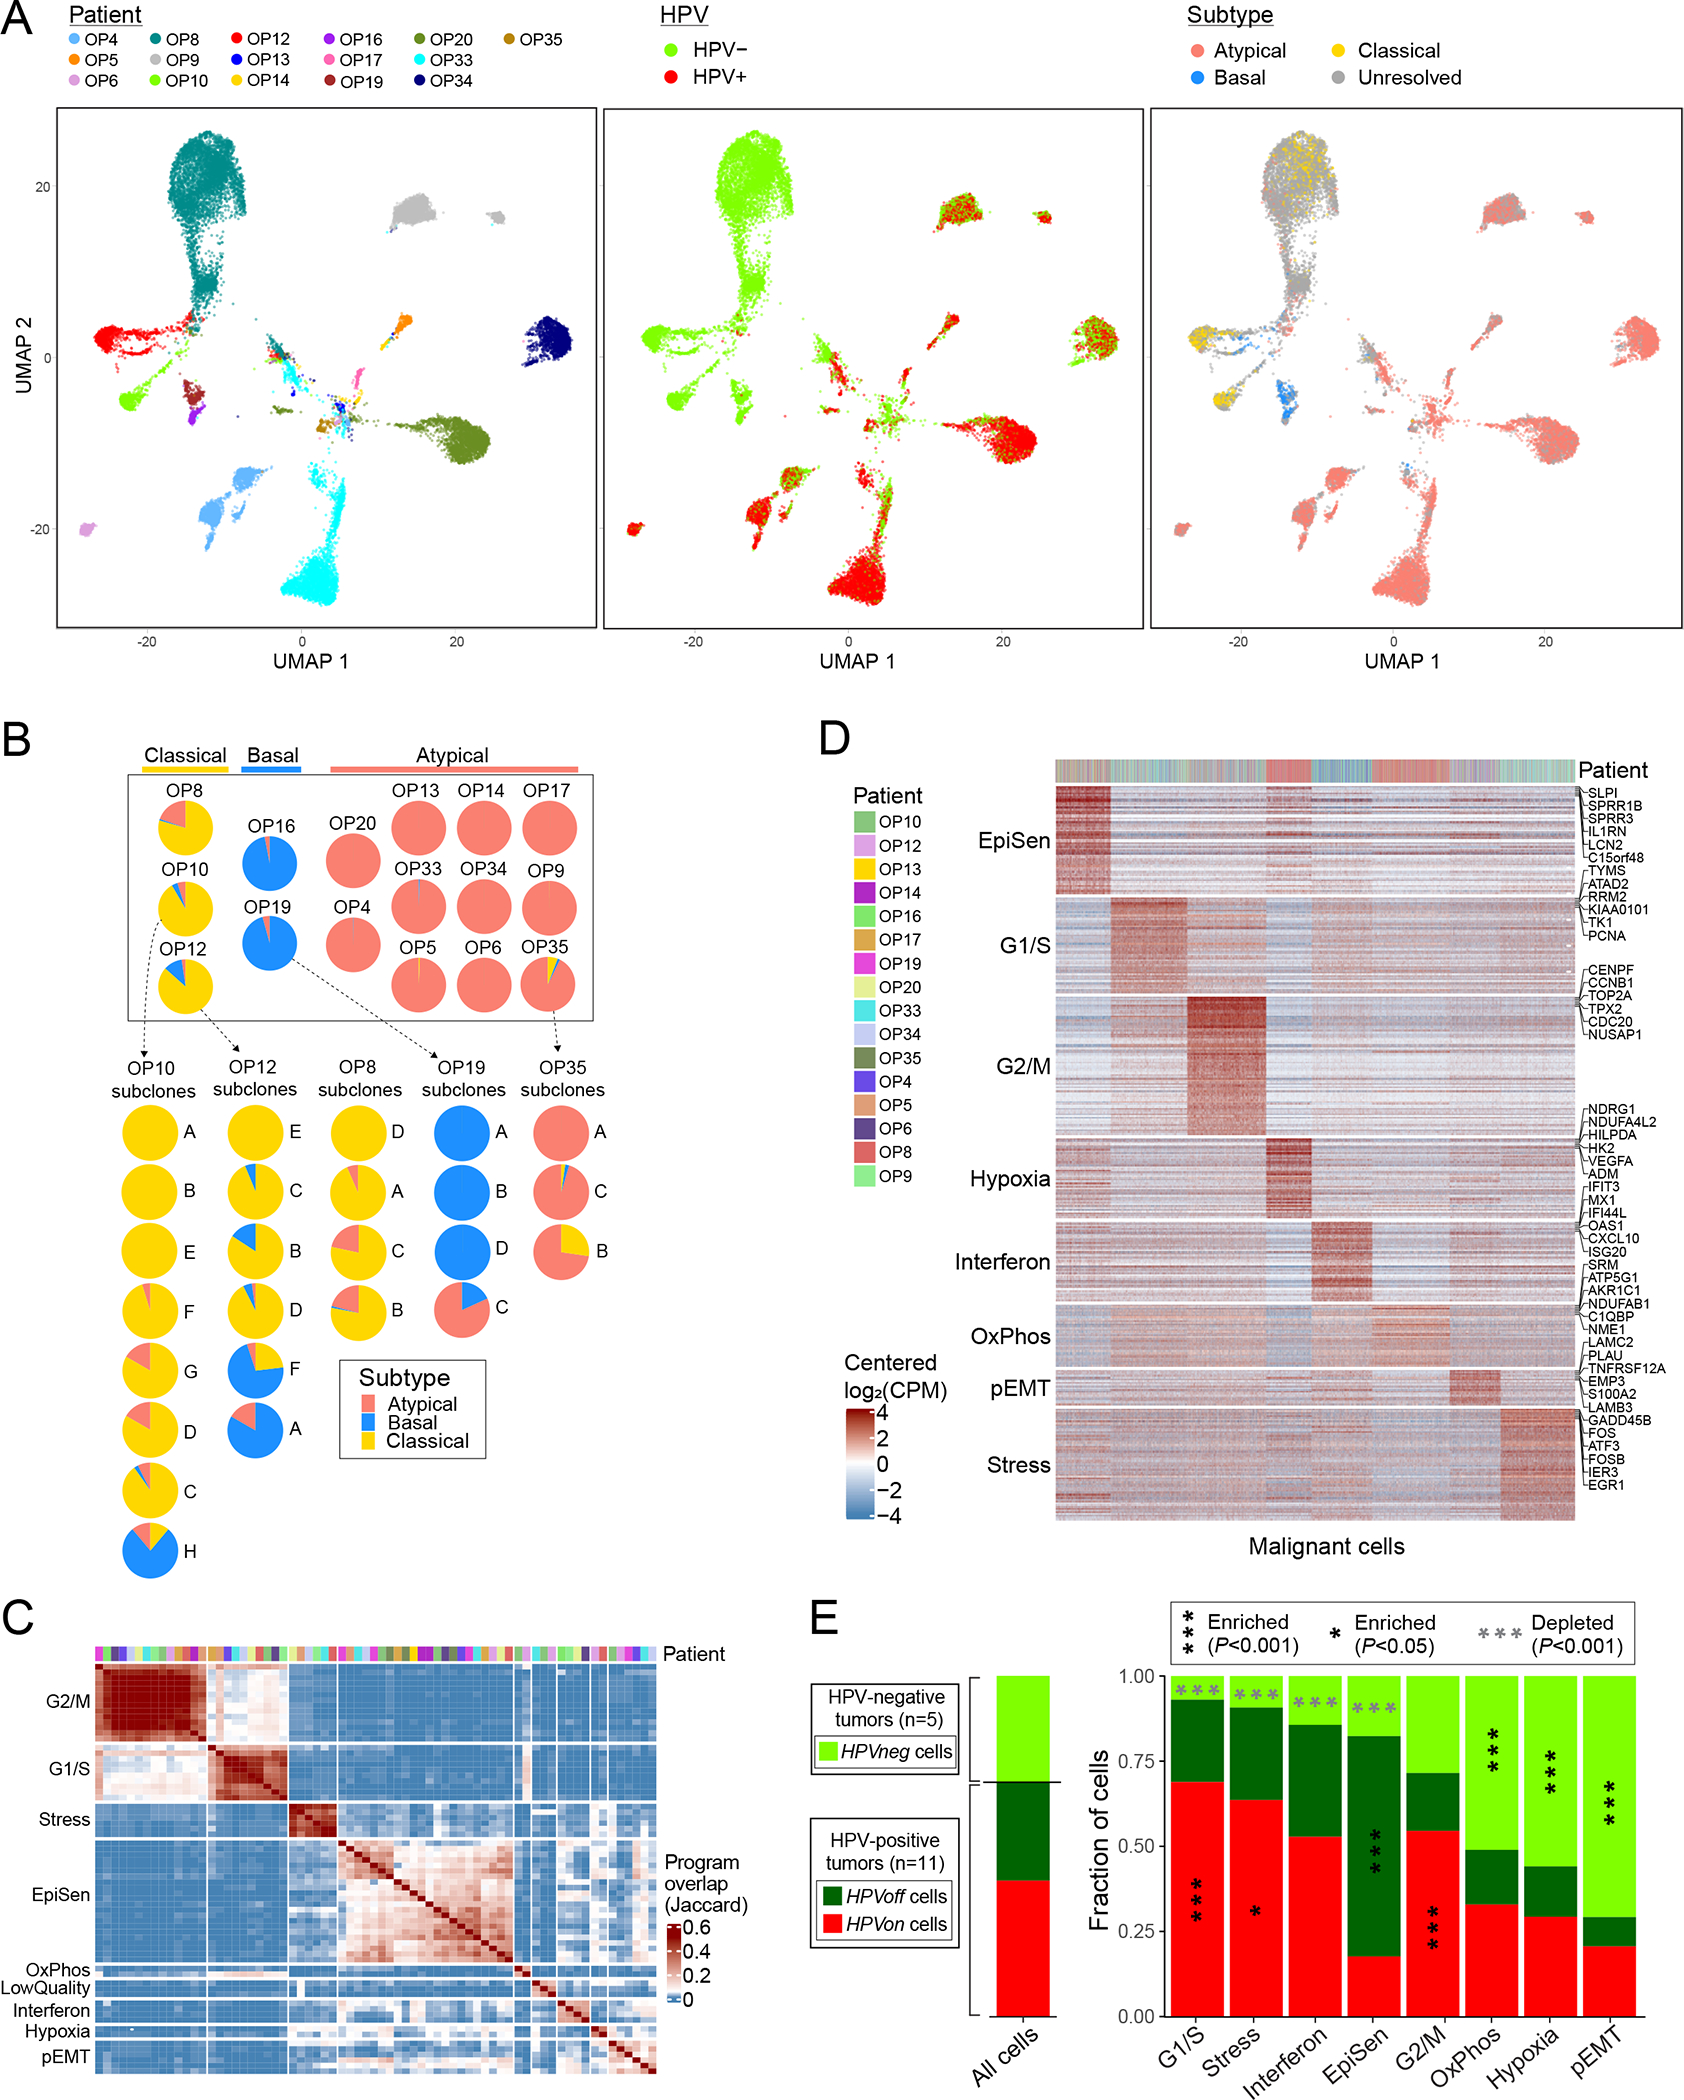
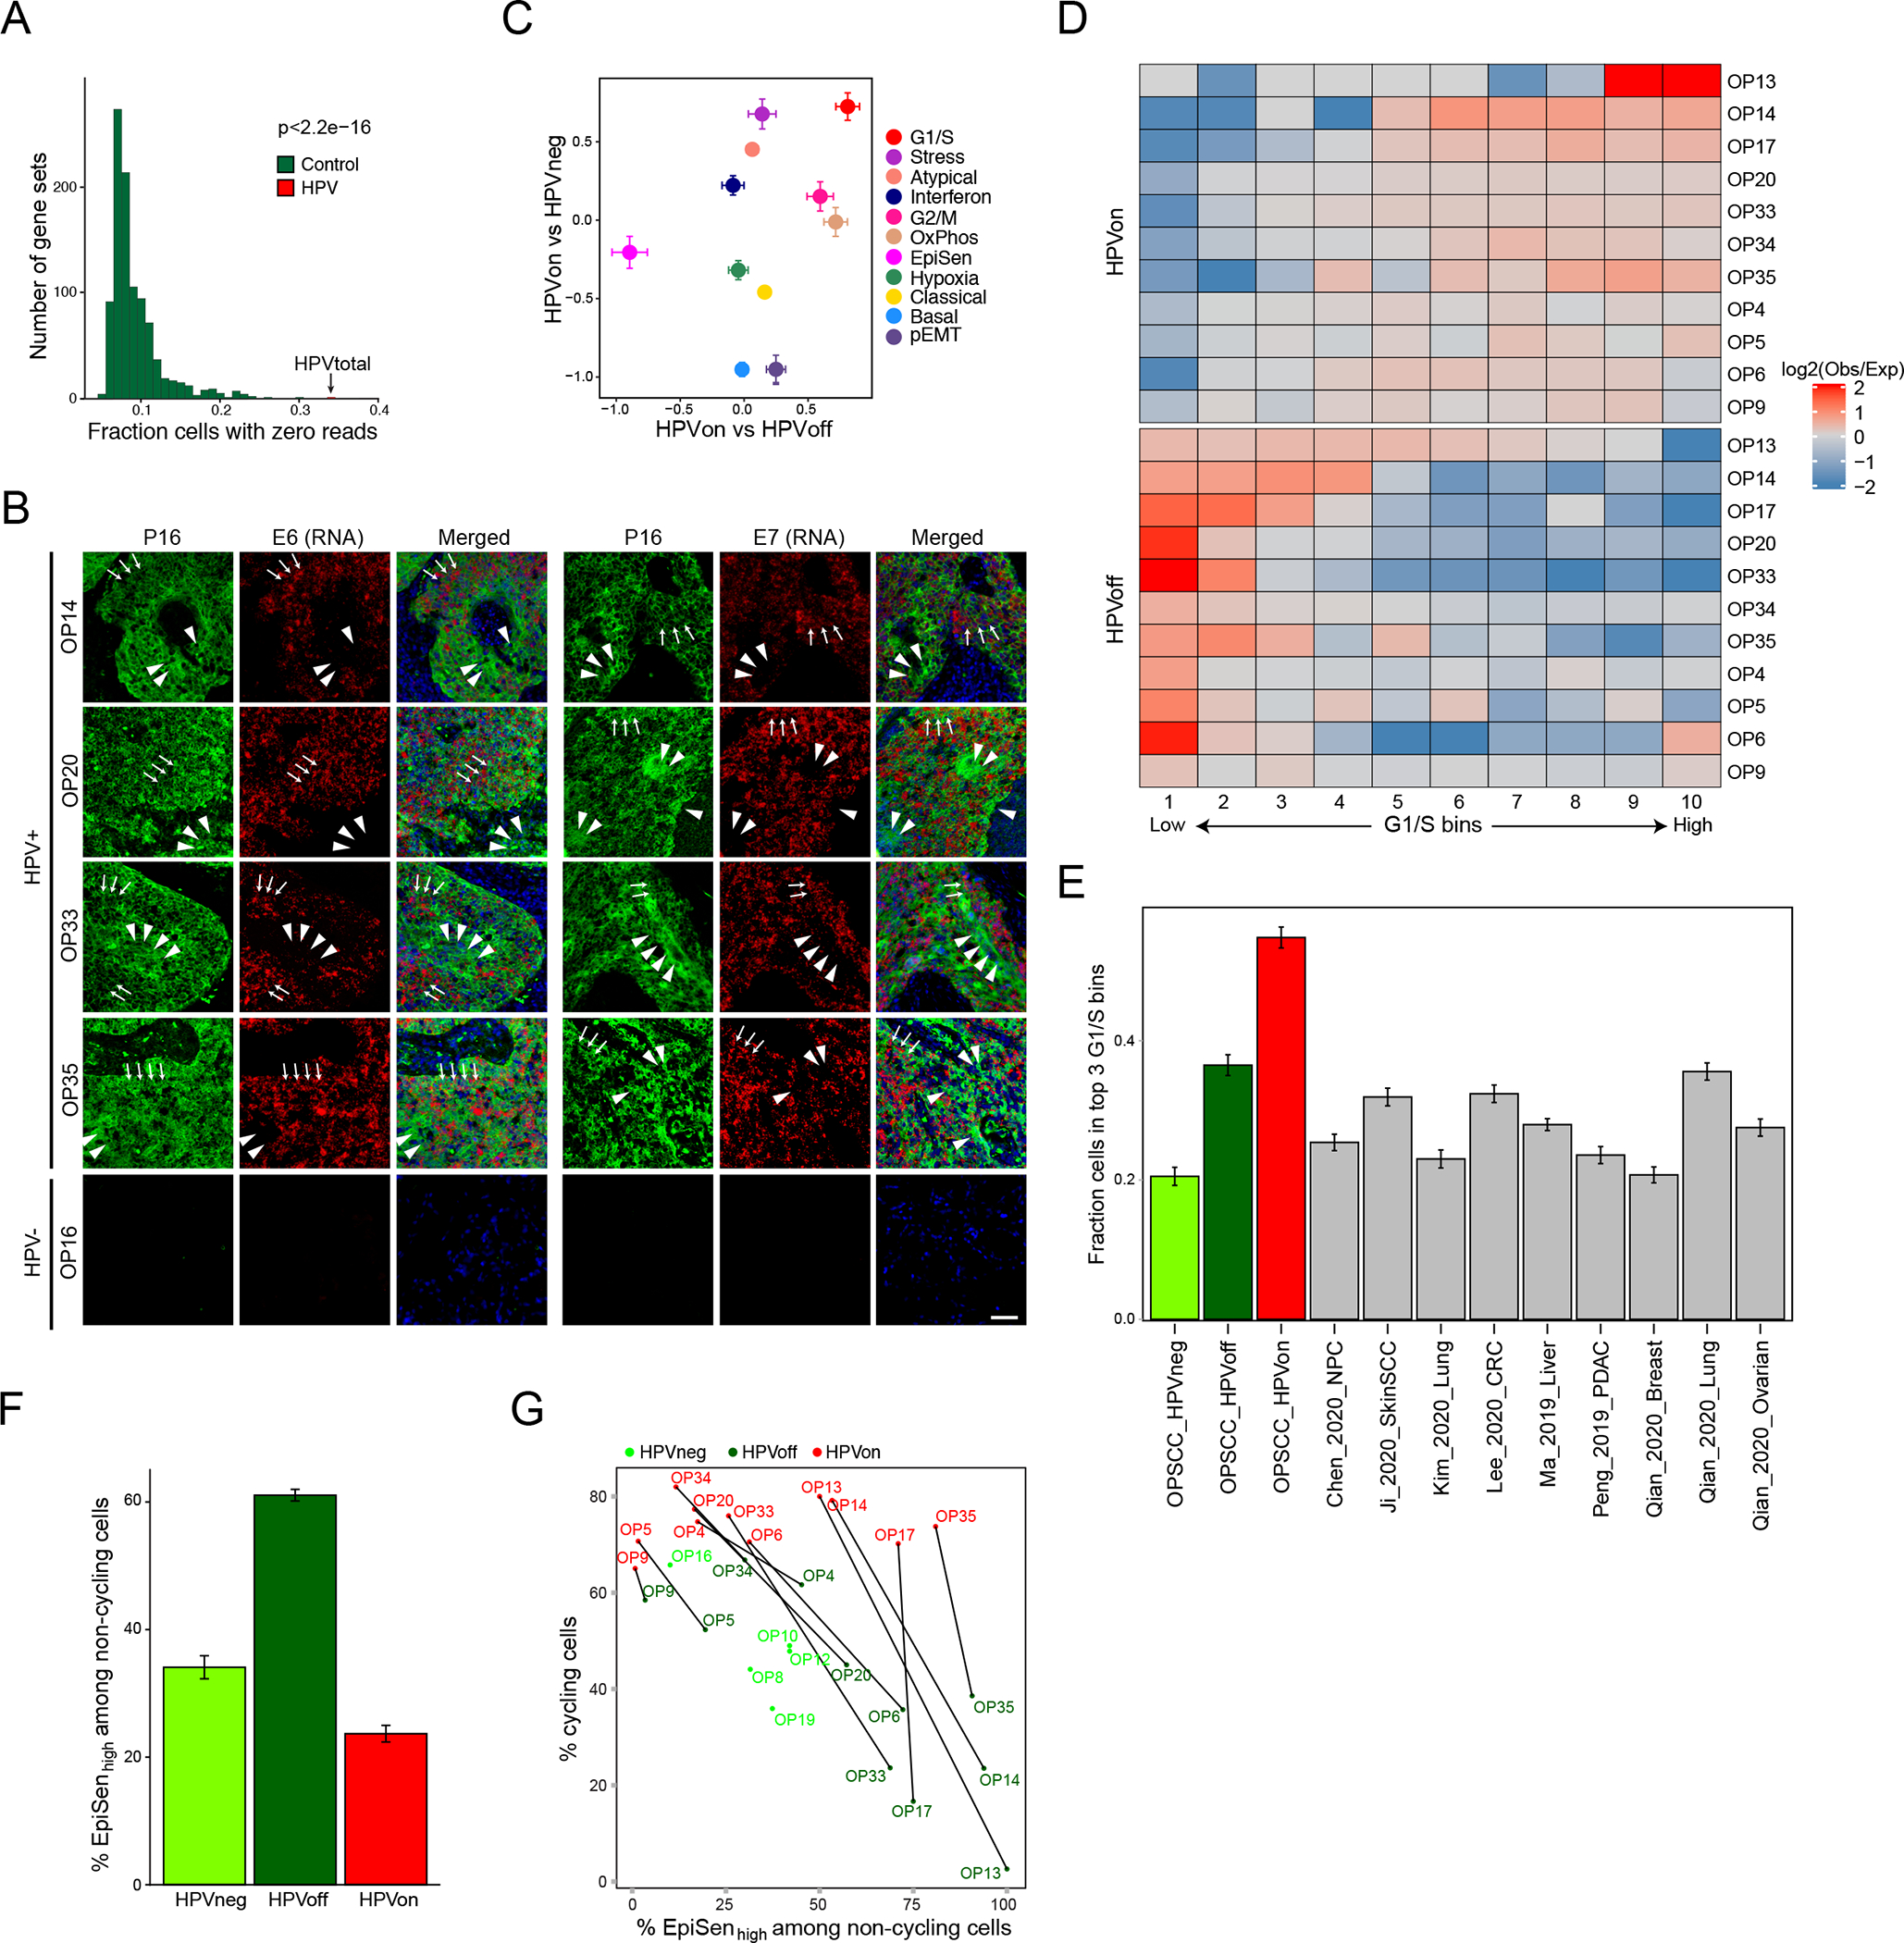
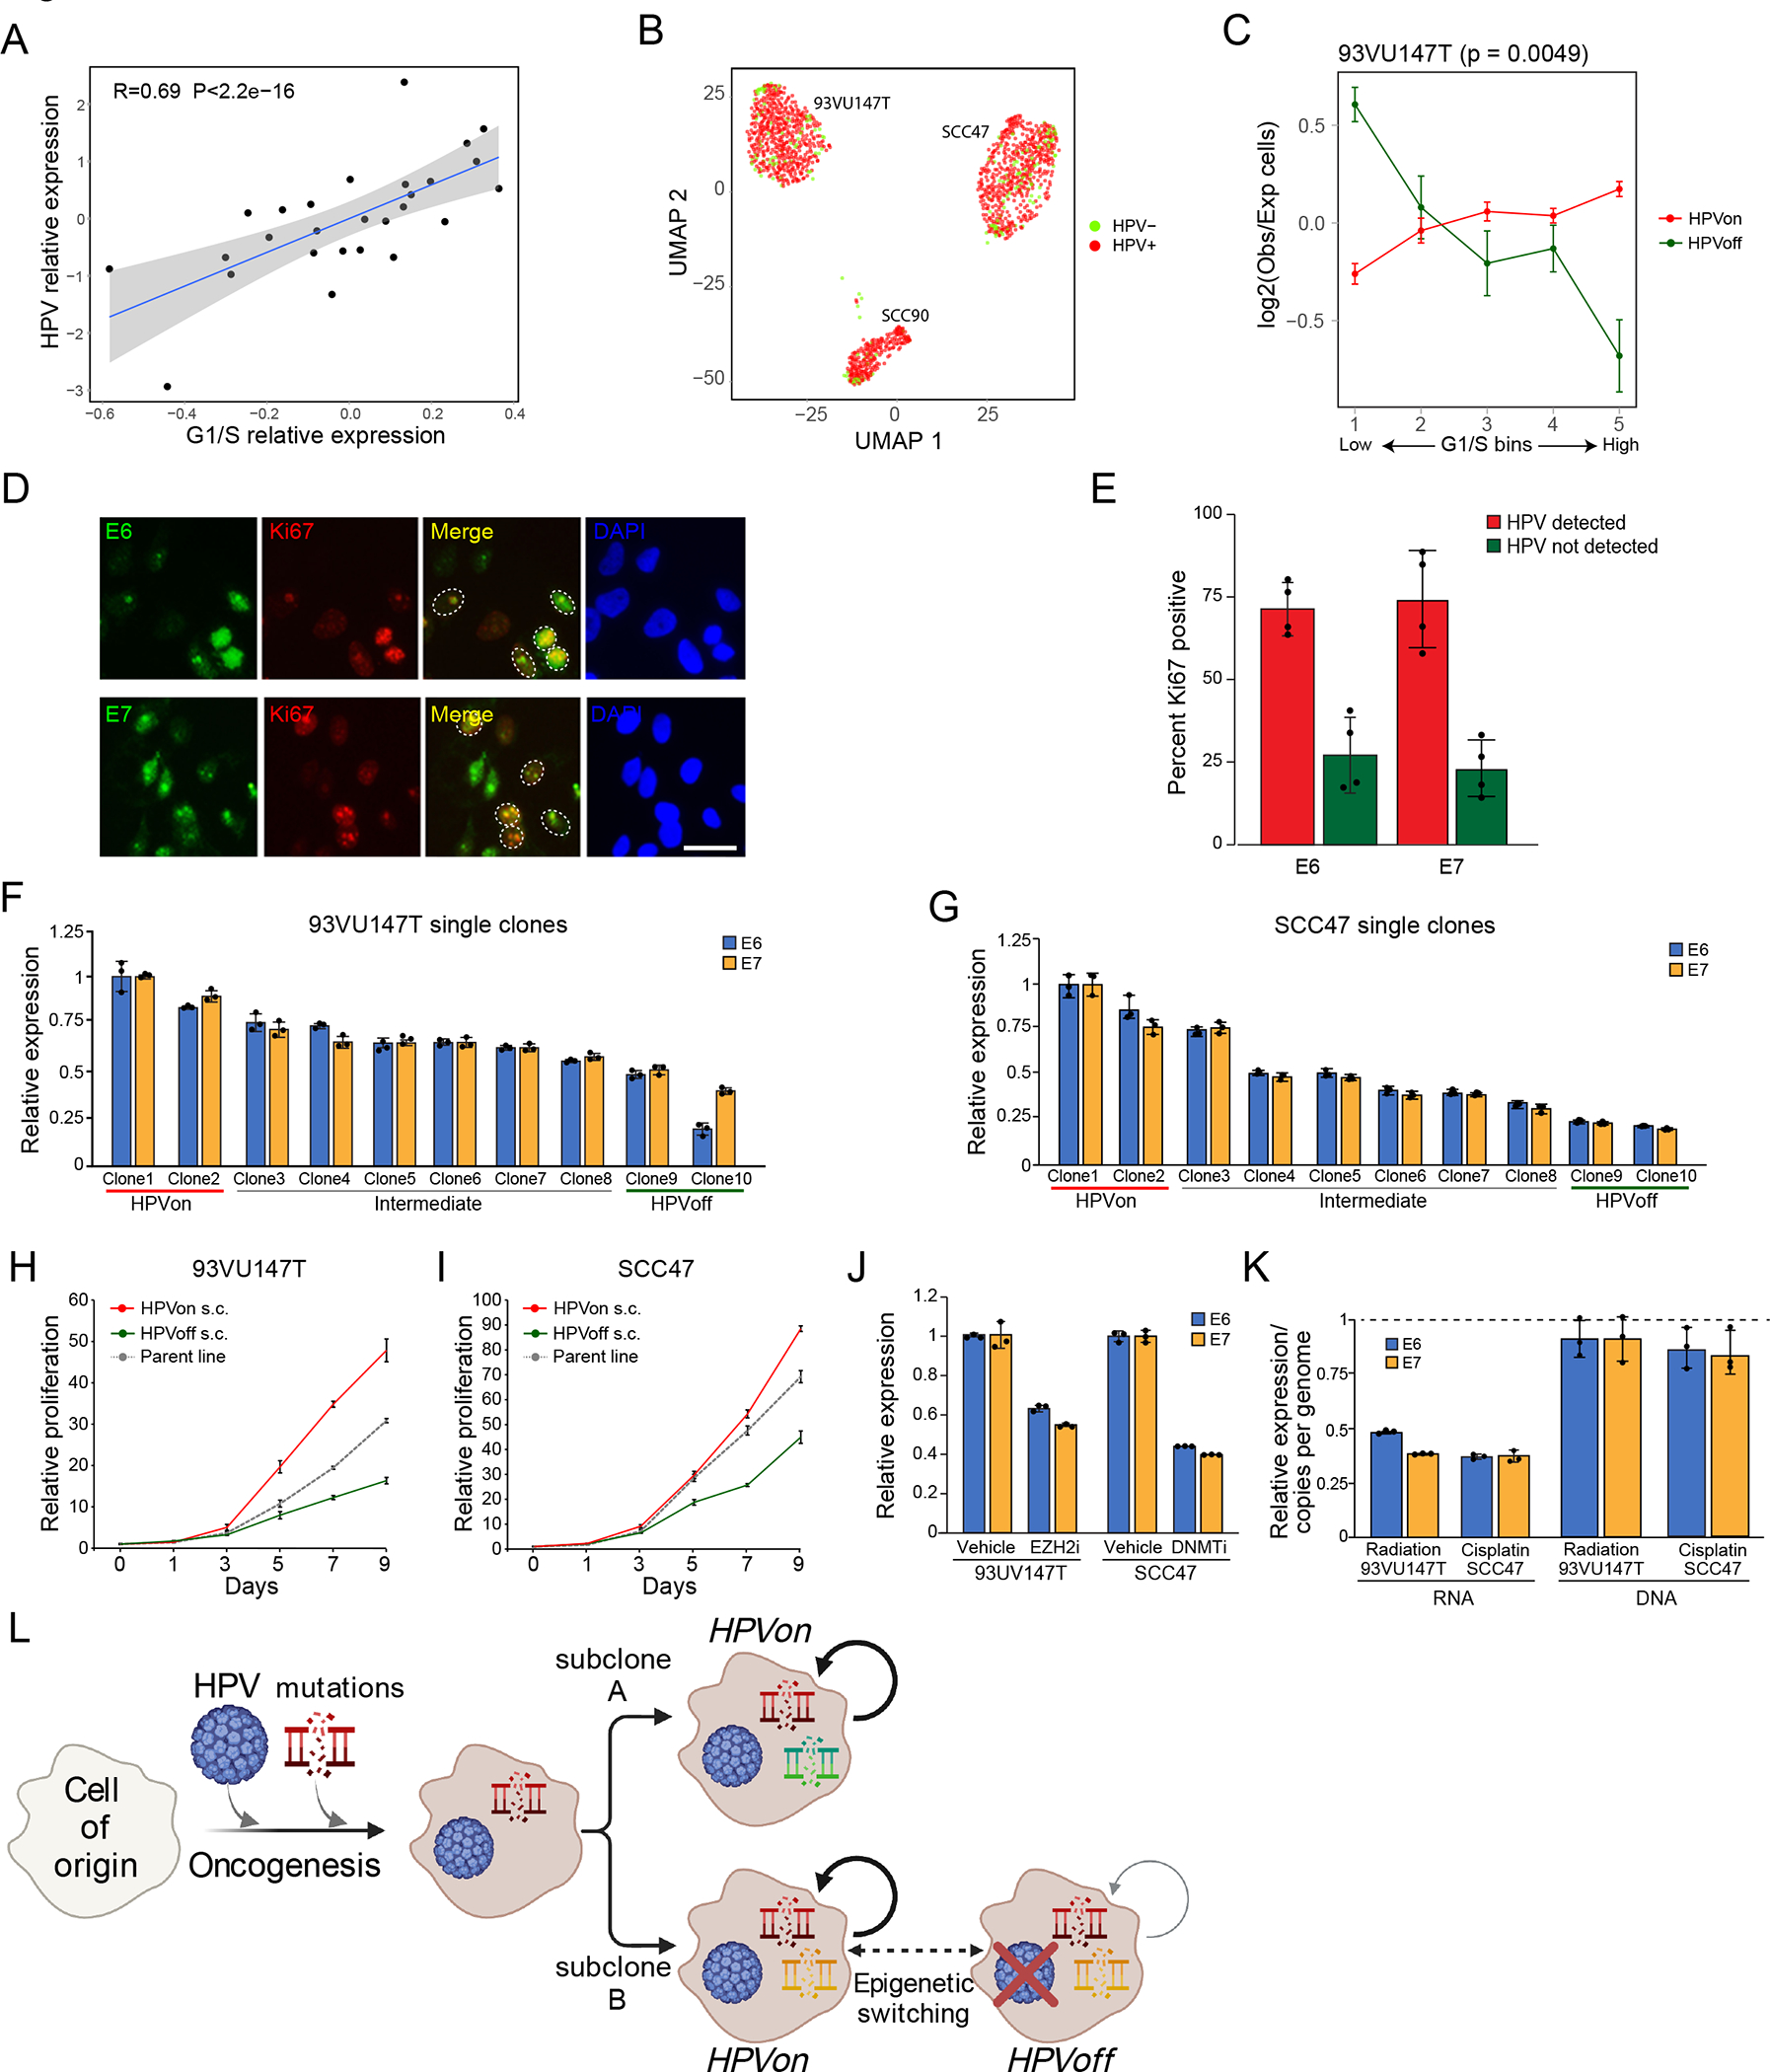
Head and neck squamous cell carcinoma (HNSCC) includes a subset of cancers driven by human papillomavirus (HPV). Here we use single-cell RNA-seq to profile both HPV-positive and HPV-negative oropharyngeal tumors, uncovering a high level of cellular diversity within and between tumors. First, we detect diverse chromosomal aberrations within individual tumors, suggesting genomic instability and enabling the identification of malignant cells even at pathologically negative margins. Second, we uncover diversity with respect to HNSCC subtypes and other cellular states such as the cell cycle, senescence and epithelial-mesenchymal transitions. Third, we find heterogeneity in viral gene expression within HPV-positive tumors. HPV expression is lost or repressed in a subset of cells, which are associated with a decrease in HPV-associated cell cycle phenotypes, decreased response to treatment, increased invasion and poor prognosis. These findings suggest that HPV expression diversity must be considered during diagnosis and treatment of HPV-positive tumors, with important prognostic ramifications.


Conflict of interest statement

Competing Interests

I.T is a member of the Scientific Advisory Board (SAB) of Immunitas Therapeutics. All other authors report no competing interests.

Figures

Extended Data Fig. 1.
Extended Data Fig. 1.. Expression of marker genes and HPV genes, related to Figure 1.
(A) UMAP of all cells (n=70,970) colored by expression of selected marker genes. (B) UMAP of immune cells (n=22,818) colored by expression of selected marker genes. (C) Histologic sections of two representative HPV+ (p16+) and HPV− (p16−) oropharynx tumors (OP34 and OP12), stained by H&E (top) and p16 (bottom). Staining was repeated three independent times with similar results. Scale bar = 100 μm. (D) UMAP of all cells colored by detection of at least one read from HPV16 genes. (E) Dot plot showing variability in expression of HPV genes (rows) across patients (columns). The last column summarizes all HPV-negative tumors. The top row shows the sum of HPV gene expression per patient (HPVtotal). The size of each dot represents the fraction of cells with at least one read for that gene in each patient, while the color represents the fraction of HPV reads in one patient that reflect the corresponding gene. For the latter metric, HPVtotal is set to 1.
Extended Data Fig. 2.
Extended Data Fig. 2.. CNA patterns and controls, related to Figure 2.
(A) Average CNA profiles of malignant cells, normal epithelial cells and fibroblasts/endothelial cells used as reference for each patient. Each row is a cell subset within a patient. Rows are ordered by cell subset and patient ID. Columns are chromosomal positions. For each row and chromosome, the chromosome was split into five bins. (B) UMAP of all cells colored by HPV-positive tumor score. (C) CNA signal and correlation scatter plot of OP17. Cells are colored by their expression of the HPV-positive tumor score. (D) Violin plots showing expression of the OP9 mesenchymal signature (left panel) and the TCGA HNSCC mesenchymal signature (right panel) in four subsets of cells; 300 cells were randomly sampled from each subset to ensure equal-sized groups. (E) Dot plot showing variability in HPV gene expression between subclones in one patient, OP4. The size of each dot represents the fraction of cells with at least one read for that gene in each subclone, while the color represents the fraction of HPV reads in one subclone that reflect the corresponding gene. For the latter metric, HPVtotal is set to 1.
Extended Data Fig. 3.
Extended Data Fig. 3.. CNA-based detection of invasive malignant cells, related to Figure 2.
(A) Histologic section of the lateral margin from OP34, stained by H&E. A piece of mucosa was taken beyond this histologically clear (pathologically negative) margin for scRNA-seq (labeled ‘margin’). Staining was repeated three independent times with similar results. Scale bar = 1000 μm. (B) CNA signal and correlation scatter plot of OP34. Cells are colored by their expression of the HPV-positive tumor score. Epithelial cells from the margin sample are circled. (C) CNA plot of OP34. Cells were randomly sampled from all subclones in equal numbers to ensure equal-sized groups. Column at the right shows the origin of cells from the tumor core and margin samples. (D) Heatmap of differentially expressed genes in the three epithelial cell subsets of lung adenocarcinoma sample TH179 – normal epithelial cells, invasive malignant cells and malignant cells from the tumor core. Rows are genes, columns are cells. Cells were randomly sampled from the normal and core subsets to ensure equal-sized groups. (E) CNA plot of lung adenocarcinoma sample TH179. Column at the right shows the origin of cells from the tumor core and margin samples. (F) HPV expression in normal epithelial cells. Violin plots showing values for CNA signal and CNA correlation for the 51 HPV-positive and 779 HPV-negative negative nonmalignant epithelial cells from HPV-positive patients, as well as for 830 randomly sampled cancer cells from the same patients, one cancer cell per patient sampled per nonmalignant epithelial cell. (G) Volcano plot of differentially expressed genes between nonmalignant epithelial cells (defined by lack of CNAs) with or without HPV expression. P-value derived from two-sided t-test adjusted for multiple comparisons.
Extended Data Fig. 4.
Extended Data Fig. 4.. Diversity of malignant cells across tumors, related to Figure 3.
(A) Heatmap showing relative expression of differentially expressed genes (rows) across all tumor samples (columns). Selected genes include the top 50 preferentially expressed genes from each tumor. (B) Hierarchical clustering of “pseudobulk” tumor profiles (defined by averaging all malignant cells per sample). Shown are Pearson correlations, ordered by the clustering of samples. Bottom panels show additional tumor characteristics with the same tumor ordering as in the heatmap, including (from top to bottom): the percentage of cells with detected HPV reads, the clinical HPV status (defined by p16 staining), three TCGA subtype scores, and scores for all meta-programs defined in Fig. 3c–d. (C) UMAP of all malignant cells, colored by mRNA expression of CDKN2A (encoding for p16). OP19 is circled.
Extended Data Fig. 5.
Extended Data Fig. 5.. Heterogeneity among common cell types in the OPSCC microenvironment, related to Figure 3.
For each of the common cell types in the OPSCC microenvironment (endothelial cells, fibroblasts, macrophages, T cells, B cells, and myofibroblasts), the corresponding panel shows meta-programs, as defined using the same approach as performed for malignant cells and shown in Fig. 3d. Shown are the relative expression levels of meta-program genes (rows) in all cells of the corresponding cell types (columns). Top panels indicate the patient of origin for all cells.
Extended Data Fig. 6.
Extended Data Fig. 6.. Characteristics of HPVoff cells, related to Figure 4.
(A) Percentage of cells positive for E6 or E7 in RNA ISH analyses (n=4 tumors, shown are mean and standard errora cross nine regions per tumor). Percentage of HPVon cells by scRNA-seq (bottom) correlates with RNA ISH values (p<0.01, ANOVA). (B) IHC of representative HPV-positive (OP5, OP6, OP33, and OP35) and HPV-negative (OP19) tumors and normal tonsil stained for malignant-cell specific marker p16 (pink) and viral E6 protein (brown). Similar results were obtained in three independent experiments. White arrowheads denote p16 positivity without E6 expression. Scale bars: Low magnification = 10 mm (tonsil, OP5, OP6), 5 mm (OP19), 7.5mm (OP35); intermediate magnification = 1000 μm; highest magnification = 250 μm. (C) Enriched MSigDB Hallmark gene-sets among genes significantly overexpressed in HPVon versus HPVoff cells. X-axis: fraction of significantly upregulated genes in the gene set. (D) Differential expression of all analyzed genes between HPV-related classes of malignant cells. X-axis: difference between HPVon and HPVneg cells; Y-axis: difference between HPVon and HPVoff cells, averaged across all HPV-positive patients. Genes are colored by their assignment to meta-program(right legend). CDKN2A (p16, highlighted in red) was not significantly different between HPVon versus HPVoff cells, but was the most overexpressed gene in HPVon cells compared to HPVneg cells. (E) For three meta-programs (panels), cells were divided into 10 bins of equal size, ranked by average expression from low (left) to high (right). Y-axis: mean ratio of cells belonging to an HPV subset versus the expected number assuming random distribution across bins. Error bars reflect SEM based on 100 re-sampling runs (n=5 patients for HPVneg, n=11 patients for HPVon and HPVoff). P-values are based on chi-square test. (F) Fractions of cycling cells, EpiSen-high cells and HPVon cells across genetic subclones. Subclones with a high fraction of HPVon cells tend to also have higher proliferation (p<0.05 for correlations in OP13, OP33 and OP35). (G) G1/S (X-axis) and G2/M (Y-axis) scores of all malignant cells, colored by the percentage of cycling cells among their neighbors (20 closest cells in this plot).
Extended Data Fig. 7.
Extended Data Fig. 7.. Regulation and function of HPVoff cells, related to Figure 5.
(A) HPV expression and G1/S gene expression across cervical squamous cell carcinoma TCGA samples. Shown are residuals after regression (Supplementary Table 3). (B) Variability in HPV expression between cell lines. Dot size and color represent fraction of cells with at least one read and fraction of HPV reads that reflect the corresponding gene, respectively. (C) Cells were divided into 5 bins by average G1/S expression from low (left) to high (right). Y-axis: mean ratio of cells in an HPV subset versus expected number assuming random distribution. Error bars are SEM by 100 resampling runs. P-value based on chi-square test. (D) Immunocytochemistry of 93VU147T cells probed with Ki67 (red), p16 (green), and DAPI (blue). Scale bar = 100 μm. (E) Percentage of Ki67 positive cells among p16 positive and negative cells. 50 cells were counted across four fields (n=4). (F) Relative expression of E6 and E7 in non-target, control (NT) compared to E6 or E7 CRISPRi knockdown (KD) 93VU147T (left) or SCC47 (right) lines (n=3; p<0.0001, t-test). (G) Relative expression of p16 in same lines as in (F). Data are presented as mean +/− SEM. There was no change in p16 upon E6 or E7 knockdown (n=3). (H) Relative expression of E6 and E7 among HPVon and HPVoff single clones derived from 93VU147T (left) and SCC47 (right) after three weeks of culture and numerous passages. HPVon and HPVoff clones maintained relatively high and low expression states (n=3; p<0.005, t-test). (I) Relative expression of p16 in same clones as in (H). (J) Proportion of cycling cells in HPVon and HPVoff single clones in 93VU147T (left) and SCC47 (right) by flow cytometry (n=3; p<0.05, t-test). (K) Relative proliferation of HPVon single clones from 93VU147T (left) and SCC47 (right) cultured under normal growth conditions (+FBS) or serum starvation (−FBS) for 48 hours. Proliferation was reduced with serum starvation (n=5; p<0.001, t-test).Relative expression of E6 and E7 in HPVon single clones in 93VU147T (left) and SCC47 (right) under normal growth conditions (+FBS) or serum starvation (−FBS) for 48 hours (n=3).
Extended Data Fig. 8.
Extended Data Fig. 8.. Functional impact of HPVoff cells and p16 expression, related to Figure 5.
(A) HPV copies per genome of E6 and E7 (normalized to albumin) for HPVon and HPVoff single clones from 93VU147T (left) and SCC47 (right). (B) DNA ISH (DNAScope) of representative HPV-positive (OP14, OP20, OP33, and OP35) and HPV-negative (OP16) tumors for viral E6 (left) and E7 (right) DNA (red) with immunofluorescence co-staining for regions of tumor as marked by p16 protein (green) and nuclei by DAPI (blue). HPV-positive tumors display p16 positive malignant cells with homogenous E6 and E7 DNA signal. HPV-negative tumors do not have signal for p16 protein or E6 or E7 DNA. Scale bar = 1000 μm. (C) Percentage of cells positive for E6 or E7 DNA among p16 positive malignant cells in DNA ISH analyses (n=4 tumors, five areas per tumor). Nearly all p16 positive malignant cells demonstrated E6 or E7 DNA signal. (D) Relative expression of E6 and E7 in 93VU147T cells treated with vehicle or tazemetostat (n=3). All doses did not significantly affect cell viability. (E) Relative expression of E6 and E7 in SCC47 cells treated with vehicle or escalating concentrations of decitabine (n=3). All doses did not significantly affect cell viability. (F) Relative expression of E6 and E7 in HPVon and HPVoff single clones from 93VU147T (left) and SCC47 (right) treated with tazemetostat, decitabine, or vehicle. HPVon clones show reduction in E6 and E7 expression upon tazemetostat or decitabine treatment compared to HPVoff clones (n=3; p<0.00001, t-test). (G) Proportion of viable cells after treatment of SCC47 HPVon and HPVoff single cell clones with cisplatin, relative to cells treated with vehicle (dashed line). HPVon clones were more susceptible to cisplatin compared to HPVoff clones (n=5; p<0.00001, t-test). (H) Invasion of HPVon and HPVoff single clones from 93VU147T (top) and SCC47 (bottom). Scale bar = 100 μm. (I) Relative invasion of HPVon and HPVoff single clones from 93VU147T (left) and SCC47 (right) cells. HPVoff cells were more invasive than HPVon (n=4; p<0.05, t-test). (J) Improved disease-free survival in HPVhigh compared to HPVlow samples, among TCGA p16+ oropharyngeal samples (n=28; p = 0.05). (K) Top: percentage of p16 positive malignant cells (by IHC) and proportion of HPVon cells (by scRNA-seq). Bottom: p16 staining from tumors with low (OP9), intermediate (OP35) and high (OP20) proportions of HPVon cells (bottom). No correlation between HPVon proportion and percentage of p16 positive cells (n=10 tumors). Scale bar = 100 μm.
Figure 1.
Figure 1.. ScRNA-seq analysis of 16 OPSCC tumors.
(A) Scheme of the workflow for OPSCC profiling and subsequent analysis. (B) UMAP plot of all cells that passed QC (n=70,970), colored by cell type and patient. (C) UMAP plot of all immune cells (n=22,818), colored by immune cell type. (D) Dot plot showing expression of selected marker genes (Y-axis) by all cells assigned to each cell type (X-axis). Dot size represents average expression, and dot color represents the fraction of cells with non-zero expression.
Figure 2.
Figure 2.. Inference of chromosomal aberrations for identification of malignant cells, genetic subclones and invasive cells.
(A) CNA plot of OP17, inferred through taking a 100-gene moving average of relative expression values across the transcriptome (Methods). Rows represent cells, arranged by genetic subclones, and columns genes, arranged by chromosomal position. Fibroblasts and endothelial cells, used as reference for CNA inference, as well as cells classified as non-malignant epithelial cells, are shown above the malignant cells. (B) Scatter plot of two CNA metrics used for classification of cells as malignant, CNA signal (Y-axis) and CNA correlation (X-axis). All epithelial and stromal cells of OP17 are shown, colored by their cell type, subclone assignment and HPV expression. (C) Left: average CNA profiles for all identified genetic subclones; rows represent subclones, ordered by patient, and columns represent chromosomal positions (with five bins per chromosome). Right: scores of subclones (arranged as in left panel) for the TCGA subtypes and the HPV+ tumor signatures, the percentage of cells with HPV reads, and the HPV clinical classification of the corresponding tumor based on p16 staining. Subclone scores reflect average scores of the cells in each subclone. (D) CNA plot of malignant cells in OP9 as in (A). Columns on the right show detection of HPV reads and average expression of a mesenchymal signature found in OP9. (E) Inferred phylogenetic tree of genetic subclones in OP9. The percentage of cells with detection of HPV reads is noted for each observed subclone; chromosomal deletions (green) and amplifications (red) are noted for each observed subclone as well as for the inferred ancestral clone. (F) CNA signal and correlation scatter plot for OP34 as in (B). Cells are colored by their origin (tumor core or margin sample) and by HPV expression. (G) Heatmap of differentially expressed genes between the three subsets of epithelial cell in OP34 – normal epithelial cells, invasive malignant cells and malignant cells from the tumor core. Rows represent genes, columns represent cells. An equal number of cells is shown from each subset (to that end, cells from the normal and tumor core subsets were randomly sampled).
Figure 3.
Figure 3.. Diversity of OPSCC malignant cells.
(A) UMAPs of all malignant cells (n=20,323) colored by patient (left panel), HPV expression (middle panel) and TCGA subtype (right panel). Cells with smaller than 1.5 fold-change between the top and the second highest subtype scores were defined as unresolved and marked in grey. (B) Pie charts representing the fraction of cells assigned to each TCGA subtype (excluding unresolved cells), per patient (above) and per subclone for patients with multiple subtypes and multiple subclones (below). (C) Hierarchical clustering of 69 NNMF-derived program signatures from 16 patients (see Methods). Signatures are clustered by Jaccard overlap. Groups of signatures, from which meta-programs are derived, are annotated on the left. Top panel shows the patient origin for each program using the same color map as in (D). (D) Expression of meta-program genes (rows) in all malignant cells (columns). Top panel indicates the patient origin for every cell. (E) For each meta-program, bar-plot shows the fraction of cells, out of those assigned to that meta-program, in three HPV-related classes: cells from HPV-negative tumors (HPVneg, light green) and cells from HPV-positive tumors in which HPV reads are detected (HPVon, red) or undetected (HPVoff, dark green). Asterisks denote enrichment (black and vertical) or depletion (grey and horizontal); asterisks within the HPVneg area denote enrichment/depletion in HPVneg vs. HPV-positive tumors (HPVon and HPVoff), and asterisks within the HPVon or HPVoff area denote enrichment in comparison between those two classes. Significance of enrichment/depletion was calculated using a hypergeometric test, corrected for multiple-testing. Bar-plot at the left shows the same analysis for all malignant cells. When calculating all fractions, 100 cells per patient and subset were randomly sampled 100 times to avoid patients with more cells skewing the results.
Figure 4.
Figure 4.. HPVoff cells and their association with cell cycle and senescence.
(A) Fraction of cells with zero reads for 1000 control gene-sets and for the set of five detected HPV genes (E1, E2, E5, E6 and E7). Each control gene-set includes one non-HPV gene as the matched control for each of the five HPV genes. Control genes were randomly sampled among the 100 genes closest to the respective HPV gene, based on average expression across all cancer cells from HPV-positive patients (p<2.2e-16, z-test). (B) RNA ISH (RNAScope) of representative HPV-positive (OP14, OP20, OP33, and OP35) and HPV-negative (OP16) tumors for viral E6 (left) and E7 (right) RNA (red) with immunofluorescence co-staining for regions of tumor as marked by p16 protein (green) and nuclei by DAPI (blue). HPV-positive tumors display regions of p16 positivity with absence of E6 and E7 RNA signal, consistent with an HPVoff state (arrowheads), while other regions have p16 along with E6 and E7 expression (HPVon; arrows). HPV-negative tumors do not have signal for p16 protein or E6 or E7 RNA. Scale bar = 1000 μm. (C) Scatter plot of differences in program expression between cells from different HPV classes. The X-axis shows mean difference, for all genes in each metaprogram, between HPVon and HPVoff cells within the same patient (n=11 patients). The Y-axis shows mean difference between HPVon cells, averaged across all HPV-positive patients (n=11), and HPVneg cells, averaged across HPV-negative patients (n=5). Error bars represent the standard error of the mean for each geneset. (D) Log2-ratio of observed to expected number of cells in each bin of G1/S scores ranked from low (left) to high (right), for each HPV-positive tumor (rows). Top and bottom rows correspond to the HPVon and HPVoff cells, respectively. I Mean fraction of malignant cells with high G1/S expression, as defined by the top 3 bins of G1/S scores, in each HPV class from this work and in multiple external datasets (n=9). Error bars show standard error of the mean fraction from 100 repetitions with sampling of 1000 cells per dataset. (F) Mean proportions of EpiSen-high noncycling cells across HPV subsets in n=5 (HPVneg) and n=11 (HPVon, HPVoff) patients. The top 20% of all malignant cells by average expression of the EpiSen program genes were defined as EpiSen-high. The y-axis shows, per subset, the mean proportion of EpiSen-high noncycling cells among all noncycling cells. Error bars represent standard error after resampling 100 times, each time sampling 200 cells per patient and subset. (G) Proportions of cycling cells and EpiSen-high noncycling cells for each patient and HPV subset.
Figure 5.
Figure 5.. Regulation and function of HPVoff cells.
(A) Scatter plot of all HPV-positive OPSCC samples in the TCGA cohort, showing correlation (two-sided Pearson correlation test) between the relative expression of HPV and of the genes in the G1/S program. Relative expression values reflect residuals, after normalizing each sample for malignant cell content (using the epithelial signature from Supplementary Table 3). (B) UMAP of 1,422 cells from three HPV-positive cell lines colored by HPV expression. Cells with at least one read from an HPV16 gene were considered HPV+. (C) Differences in expression of the G1/S genes between HPV subsets in the HPV-positive cell line 93VU147T. Cells were divided into 5 bins of equal size, ranked by average expression. The Y-axis shows mean ratio of cells belonging to an HPV subset in a bin versus the expected number of cells, assuming random distribution across bins. Error bars are standard error after 100 resampling runs, where 100 cells per subset were randomly selected. P-value based on chi-square test, comparing the distribution of cells per bin between the groups. (D) Immunocytochemistry images of 93VU147T cells probed with Ki67 (red) and E6 (green, top) or E7 (green, bottom). Nuclei were stained and visualized with DAPI (blue). Scale bar = 100 μm. (E) Bar plot (mean +/− SEM) shows percentage of Ki67 positive cells among E6 and E7 positive cells (HPV detected; red) and E6 and E7 negative cells (HPV not detected; green). 50 cells were counted across four fields (p<0.00001, chi-square). (F and G) Bar plot (mean +/− SEM) shows relative expression of E6 and E7 among single clones (n=10) derived from 93VU147T (F) and SCC47 (G) revealing diversity in HPV expression (p<0.00001, ANOVA).(H and I) Line graph (mean +/− SEM) shows relative proliferation of HPVon and HPVoff single clones derived from 93VU147T (H) and SCC47 (I) compared to parent line. HPVon single clones displayed substantially more relative proliferation than HPVoff single clones (n=3; p<0.00001, two-sided t-test). (J) Left: Bar plot (mean +/− SEM) shows relative expression of E6 and E7 in 93VU147T cells treated with vehicle or tazemetostat (EZH2 inhibitor) (left). Right: Bar plot (mean +/− SEM) shows relative expression of E6 and E7 in SCC47 cells treated with vehicle or decitabine (DNMT inhibitor). Tazemetostat and decitabine significantly reduced relative E6 and E7 expression compared to vehicle in 93VU147T cells and SCC47 cells, respectively (n=3; p<0.001 and p<0.00001, ANOVA). (K) Left: Bar plot (mean +/− SEM) shows relative expression of E6 and E7 in 93VU147T and SCC47 cells treated with radiation or cisplatin, respectively, normalized to control cells (dashed line) (n=3; p<0.00005, two-sided t-test). Right: Bar plot (mean +/− SEM) depicts HPV copies per genome of E6 and E7 (normalized to albumin) for 93VU147T and SCC47 cells treated with radiation or cisplatin, respectively, normalized to control cells (dashed line). There were no significant differences in HPV copies in genomic DNA in radiation or cisplatin treated cells compared to control (n=3). (L) Model of genomic and viral heterogeneity in HPV-related OPSCC. A combination of HPV infection and associated genetic mutations trigger oncogenesis. Some genetic subclones continue to express HPV (HPVon), while others may undergo epigenetic switching with repression of HPV expression (HPVoff) and an associated decrease in cell cycle (circled arrows).

Comment in

References

    1. Gillison ML et al. Distinct risk factor profiles for human papillomavirus type 16-positive and human papillomavirus type 16-negative head and neck cancers. J. Natl. Cancer Inst. 100, 407–420 (2008). - PubMed
    1. Ang KK et al. Human papillomavirus and survival of patients with oropharyngeal cancer. N. Engl. J. Med. 363, 24–35 (2010). - PMC - PubMed
    1. Brianti P, De Flammineis E & Mercuri SR Review of HPV-related diseases and cancers. New Microbiol. 40, 80–85 (2017). - PubMed
    1. Doorbar J, Egawa N, Griffin H, Kranjec C & Murakami I Human papillomavirus molecular biology and disease association. Rev. Med. Virol. 25 Suppl 1, 2–23 (2015). - PMC - PubMed
    1. Graham SV The human papillomavirus replication cycle, and its links to cancer progression: a comprehensive review. Clin. Sci. Lond. Engl. 1979 131, 2201–2221 (2017). - PubMed

Publication types

MeSH terms