. 2023 May;20(5):714-722.
doi: 10.1038/s41592-023-01830-1. Epub 2023 Apr 3.

Prioritized mass spectrometry increases the depth, sensitivity and data completeness of single-cell proteomics

Affiliations

Prioritized mass spectrometry increases the depth, sensitivity and data completeness of single-cell proteomics

R Gray Huffman et al. Nat Methods. 2023 May.

Abstract

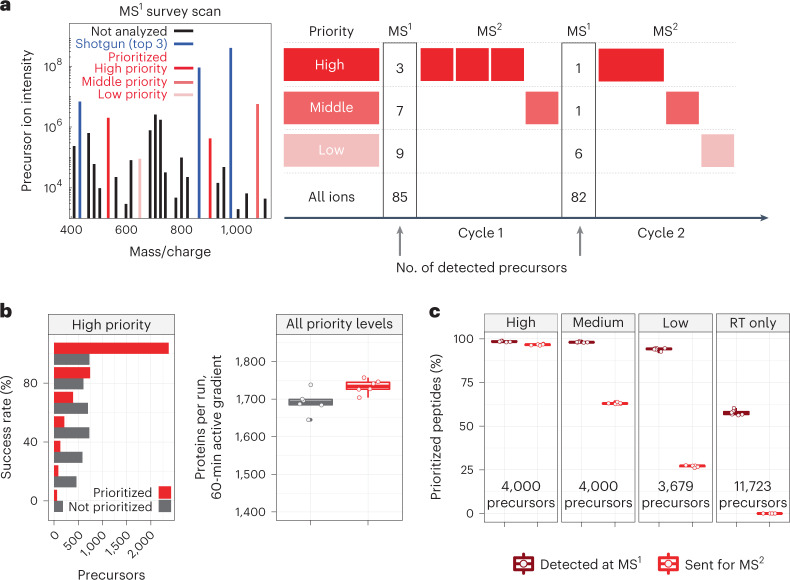
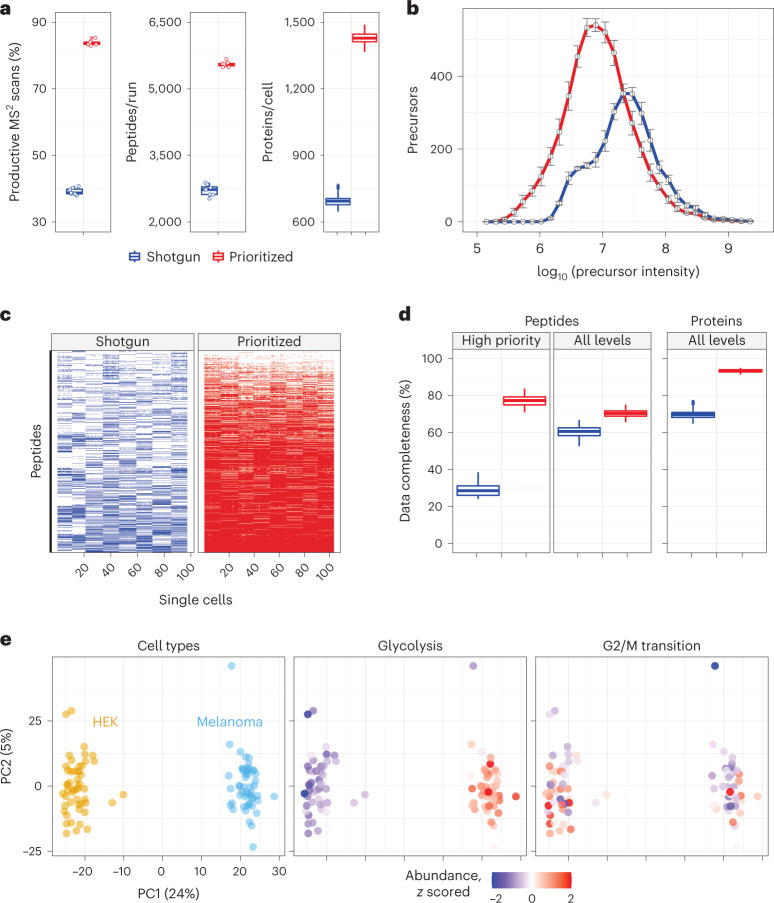
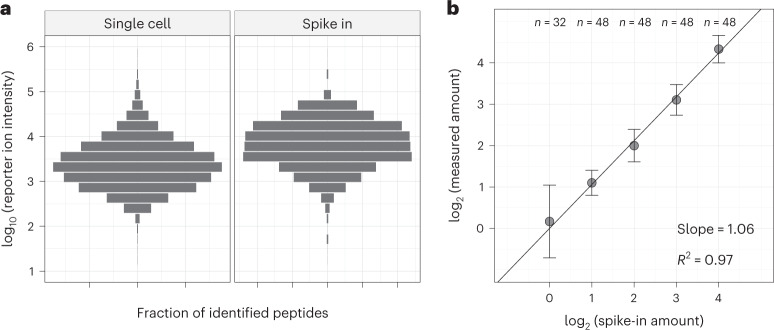
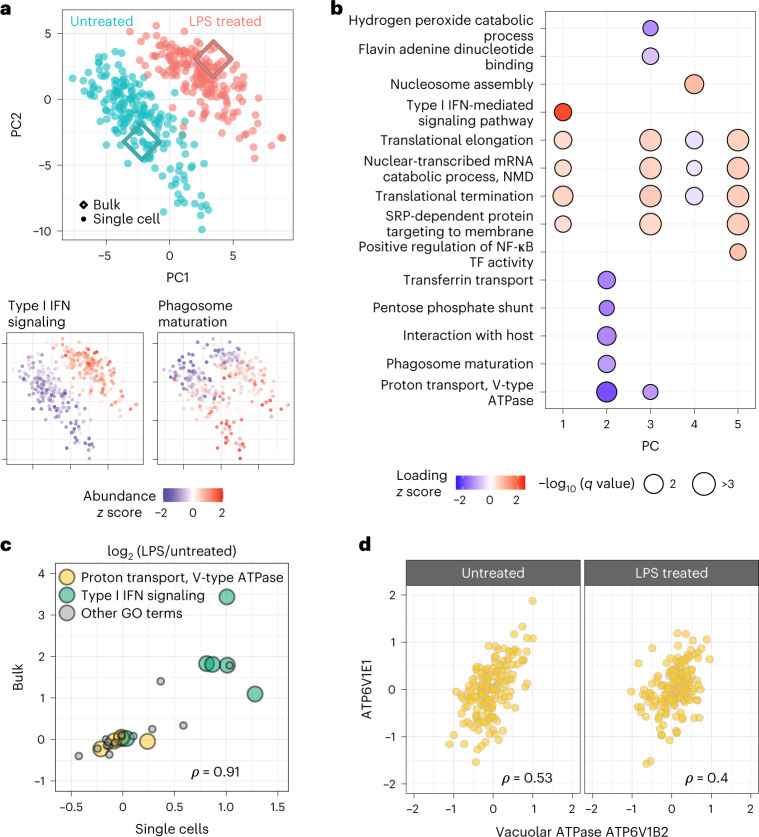
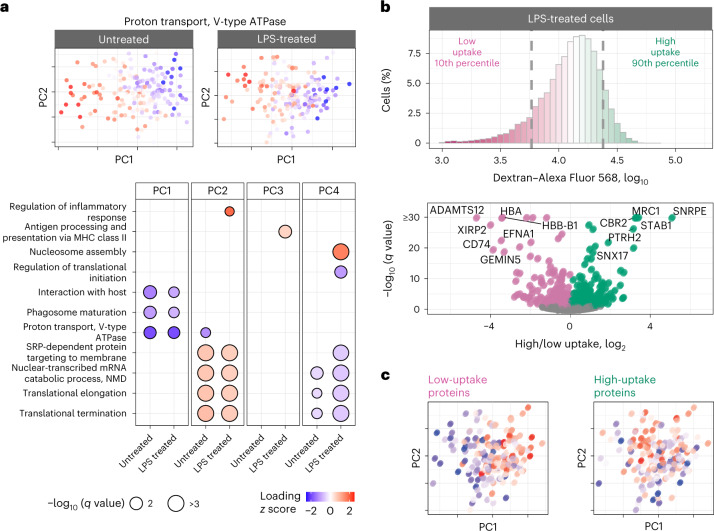
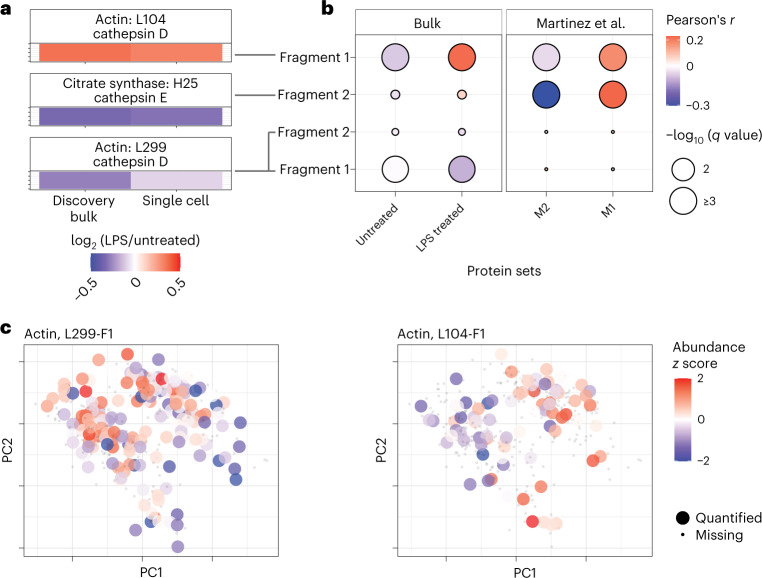
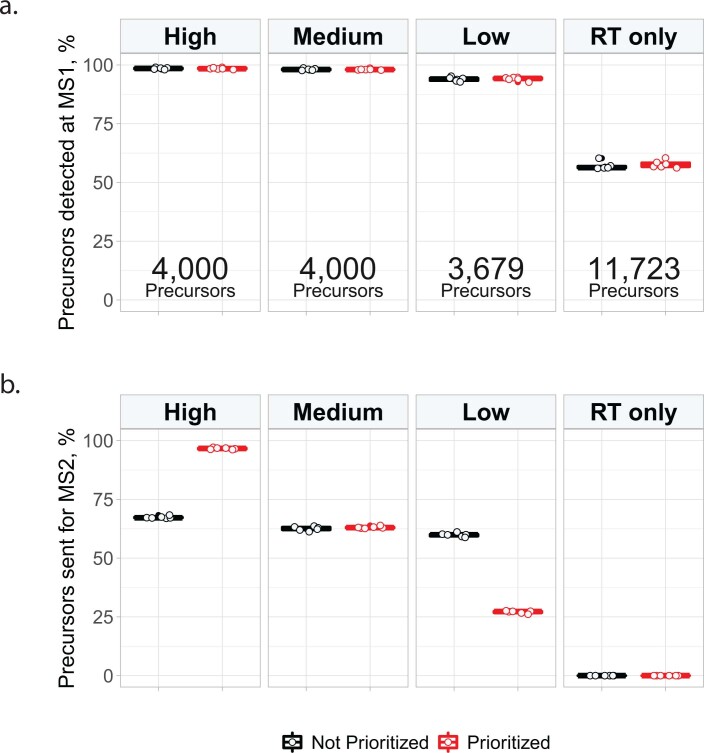
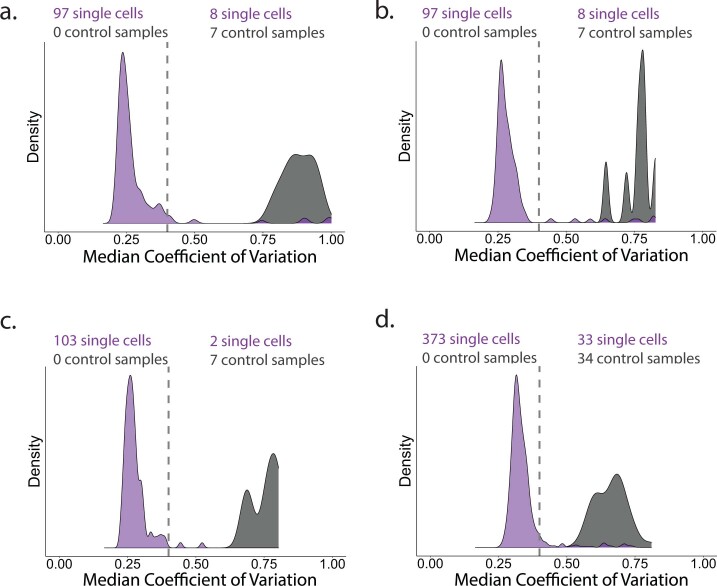
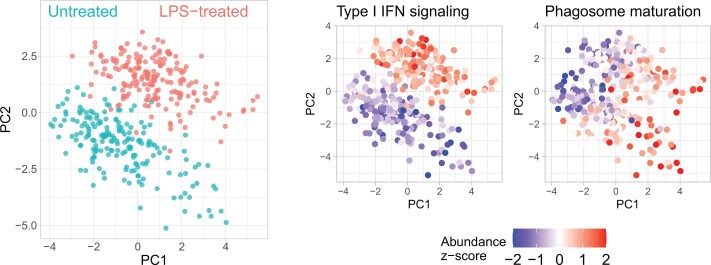
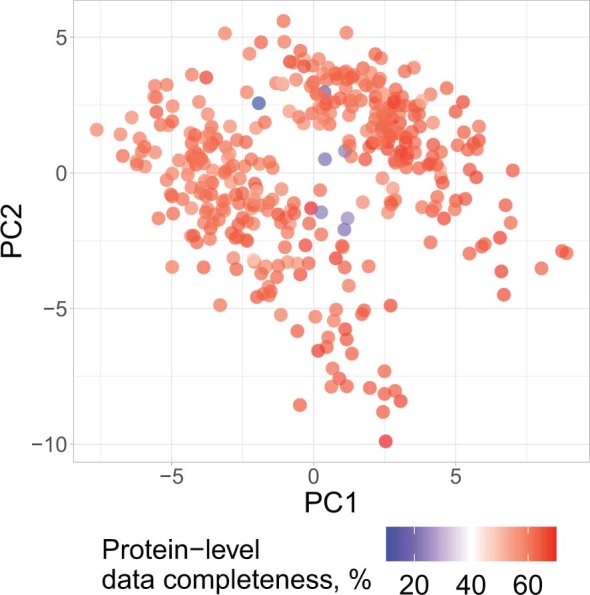
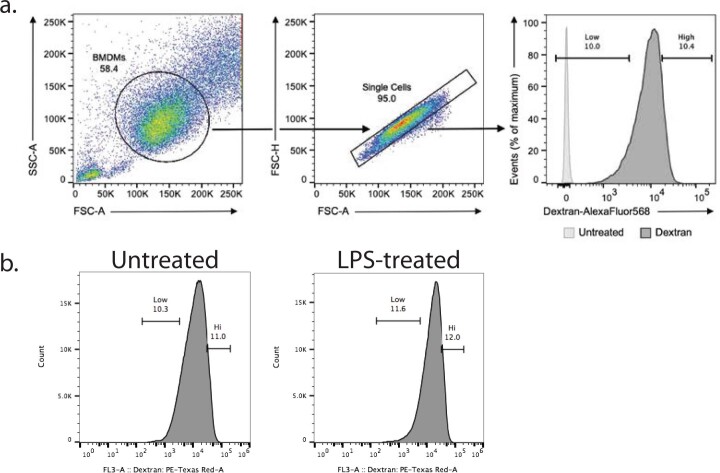
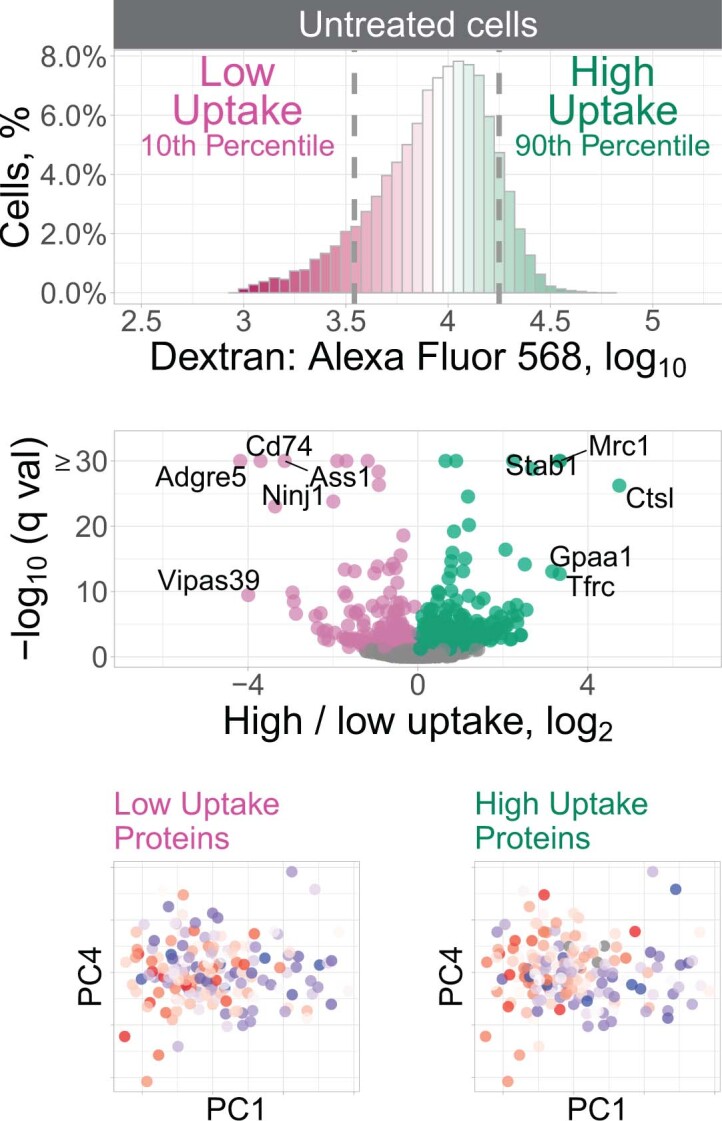
Major aims of single-cell proteomics include increasing the consistency, sensitivity and depth of protein quantification, especially for proteins and modifications of biological interest. Here, to simultaneously advance all these aims, we developed prioritized Single-Cell ProtEomics (pSCoPE). pSCoPE consistently analyzes thousands of prioritized peptides across all single cells (thus increasing data completeness) while maximizing instrument time spent analyzing identifiable peptides, thus increasing proteome depth. These strategies increased the sensitivity, data completeness and proteome coverage over twofold. The gains enabled quantifying protein variation in untreated and lipopolysaccharide-treated primary macrophages. Within each condition, proteins covaried within functional sets, including phagosome maturation and proton transport, similarly across both treatment conditions. This covariation is coupled to phenotypic variability in endocytic activity. pSCoPE also enabled quantifying proteolytic products, suggesting a gradient of cathepsin activities within a treatment condition. pSCoPE is freely available and widely applicable, especially for analyzing proteins of interest without sacrificing proteome coverage. Support for pSCoPE is available at http://scp.slavovlab.net/pSCoPE .


Conflict of interest statement

N.S. is a founding director and CEO of Parallel Squared Technology Institute, which is a nonprofit research institute.

Figures

Fig. 1
Fig. 1. Introducing prioritization to MaxQuant.Live increases identification consistency and protein coverage.
a, Shotgun topN analysis selects the n most abundant precursors for isolation and fragmentation (shown in blue). Among the many detected precursors, prioritized analysis first selects the ones with highest priority (shown in solid red) and then from lower-priority tiers (shown with decreasingly saturated red tones). Prioritization can also selectively allocate increased fill times to high-priority peptides of low abundance, as shown in the second cycle of MS2 scans. b, Prioritized analysis increases the consistency of peptide identification over default MaxQuant.Live operation for high-priority peptides while also increasing protein coverage per run. The box plots showing proteins identified per experiment contain six points per analysis method, one for each experiment. c, Rates of MS1 detection and MS2 analysis for prioritized precursors from all tiers of the benchmarking experiments displayed in b. These box plots contain six points per analysis method, one for each experiment. The fourth panel displays peptides used for retention time (RT) alignment only and not intended for MS2 scans. For all box plots, whiskers display the minimum and maximum values within 1.5 times the interquartile range of the 25th and 75th percentiles, respectively; the 25th percentile, median and 75th percentile are also featured.
Fig. 2
Fig. 2. Prioritization increases proteome coverage, sensitivity and data completeness of single-cell protein analysis.
a, Relative to shotgun analysis, prioritization increased the fraction of MS2 scans assigned to peptide sequences (n = 8 experiments per box plot), the number of peptides per run (60-min active gradient; n = 8 experiments per box plot) and the number of quantified proteins per single cell (n = 97 single cells per box plot). b, Prioritized analysis enables increased sensitivity and dynamic range while analyzing more peptides than shotgun analysis with matched parameters. n = 8 experiments per analysis method. Data are represented by the median, and error bars denote s.d. Precursor abundances stratified by priority level are displayed in Supplementary Fig. 1. c, A heatmap showing data completeness across single cells (columns) for 1,000 peptides (rows) from the top priority tier. d, Prioritized analysis increases data completeness at both peptide and protein levels across all priority tiers. n = 194 and 206 single cells analyzed by shotgun and prioritization, respectively. e, PCA of the single cells associated with b cluster by cell type. Protein sets enriched in the PCs are visualized by color coding the single cells by the median protein abundance of the set in each cell. All experiments used 60-min active gradients per run and 0.5-Th isolation windows for MS2 scans. All peptide and protein identifications were filtered at 1% FDR with additional filtration criteria detailed in Methods. For all box plots, whiskers display the minimum and maximum values within 1.5 times the interquartile range of the 25th and 75th percentiles, respectively; the 25th percentile, median and 75th percentile are also featured.
Fig. 3
Fig. 3. Evaluating quantitative accuracy and precision of pSCoPE with peptide standards.
a, Reporter ion intensities for precursors identified at 1% FDR from single cells and from the spike-in peptides, which were dispensed into the single-cell samples across a 16-fold range. b, Normalized reporter ion intensities for all tryptic products from the spike-in peptides plotted against their spike-in amounts, with regression slope and goodness of fit displayed. Points denote the median, and error bars denote s.d. of the distribution of normalized reporter ion intensities for each spike-in level. The data in a and b come from eight prioritized experiments, and the numbers of data points for each of the spike-in levels are indicated on the top. The experimental design for this set of analyses can be found in Supplementary Table 1.
Fig. 4
Fig. 4. Prioritized analysis of primary macrophages identifies protein variation within and across treatment conditions.
a, PCA of 373 BMDMs and 1,123 proteins color coded by treatment condition. Diamond markers indicate bulk samples projected in the same low-dimensional space as the single cells. The adjoining PCA plots are color coded by the z-scored median relative abundance of proteins corresponding to type I IFN-mediated signaling and phagosome maturation. Performing this analysis without imputation recapitulates these results, as shown in Extended Data Fig. 7. b, Protein groups identified by PSEA performed using the PC vectors with protein weights from the PCA shown in a. NF-κB, nuclear factor κB; TF, transcription factor; NMD, nonsense-mediated mRNA decay; SRP, signal recognition particle. c, The protein fold changes (LPS-treated/untreated macrophages) were estimated both from single cells and from bulk samples. The corresponding estimates correlate positively, with a Spearman correlation of ρ = 0.91 computed using all 28 proteins shown (P = 2 × 10−11); all GO terms are labeled in Supplementary Fig. 2. d, Proteins functioning in proton transport do not change across conditions but covary within a condition (across 177 single cells). Correlations between all vacuolar ATPase proteins annotated with proton transport are displayed in Supplementary Fig. 3. In c and d, ρ denotes Spearman correlations, and all associated q values are <107.
Fig. 5
Fig. 5. Axes of proteome polarization are similar between untreated and LPS-treated macrophages and correlate with dextran uptake.
a, Untreated and LPS-treated macrophages were analyzed separately by PCA, and PSEA was performed on the corresponding PCs. PCA plots are color coded by the median abundance of proteins annotated with proton transport. b, The uptake of fluorescent dextran by LPS-treated macrophages was measured by flow cytometry, and the cells with the lowest and highest uptake were isolated for protein analysis. The volcano plot displays fold changes for differentially abundant proteins and the associated statistical significance. The corresponding analysis for untreated macrophages is displayed in Extended Data Fig. 10. c, LPS-stimulated macrophages were displayed in the space of their PCs and color coded by the median abundance of low-uptake or high-uptake proteins. The low-uptake proteins correlate with PC1 (Spearman r = 0.55, q ≤ 3 × 1015), and the high-uptake proteins correlate with PC2 (Spearman r = 0.33, q ≤ 2 × 105).
Fig. 6
Fig. 6. Proteolytic products in individual macrophages correlate with inflammatory markers and vary within treatment groups.
a, A comparison between untreated and LPS-treated ratios of proteolytic products quantified in discovery bulk experiments and in single cells. Annotations are derived from the MEROPS database. b, Correlation analysis of proteolytic products with treatment group-specific and macrophage-polarization-specific protein panels. c, Data from the untreated and LPS-treated cells were projected by PCA and color coded by the relative abundance of the indicated actin fragments.
Extended Data Fig. 1
Extended Data Fig. 1. Percent of inclusion-list precursors detected and analyzed in platform benchmark runs, for MaxQuant.Live with and without prioritization enabled.
(a) MS1 detection rates for precursors in the platform benchmark experiments displayed in Fig. 1a, b. Data collected using MaxQuant.Live in default mode are shown in black, while data collected using prioritization are shown in red. The precursor count displayed at the bottom of each priority level’s facet corresponds to the number of precursors present on that priority level of the inclusion list. (b) MS2 analysis rates for precursors in the platform benchmark experiments displayed in Fig. 1a, b. While the MS1 precursor detection rates are similar for both platforms, the MS2 analysis rates are correlated to the priority levels for prioritized analysis, but not for default MaxQuant.Live analyses. Each boxplot shown above contains 6 data points, one for each LC-MS/MS analysis. For all boxplots, whiskers display the minimum and maximum values within 1.5 times the interquartile range of the 25th and 75th percentiles, respectively; the 25th percentile, median, and 75th percentile are also featured.
Extended Data Fig. 2
Extended Data Fig. 2. Single-cell quality controls.
The median coefficient of variation (that is the standard deviation scaled by the mean) of all peptide-level relative abundances that map to the same leading razor protein is used to separate successfully prepared single cells from those that will not generate accurate data. By choosing a CV threshold that separates control samples (droplets which received all reagents but did not contain a single cell) from single cells, cells with noisier protein-level quantitation can be removed prior to further data processing. The single-cell and control tallies above each figure represent the number of single cells or control wells that passed the CV threshold of 0.4. (a) contains the CV distributions for the single-cell samples associated with Fig. 2a–e, analyzed by shotgun LC-MS/MS methods. (b) contains the CV distributions for the single-cell samples associated with Fig. 2a, analyzed by pSCoPE. (c) contains the CV distributions for the single-cell samples associated with Fig. 2b–e, analyzed by pSCoPE. (d) contains the CV distributions for the single-cell samples associated with Figs. 4–6.
Extended Data Fig. 3
Extended Data Fig. 3. Properties of peptides successfully identified in pSCoPE runs.
The precursors from the inclusion list were split into those that resulted in confident PSMs and those that did not, and the properties of each set analyzed based on the shotgun runs used for making the inclusion lists. (a) Confidence of identification (quantified by the posterior error probability; PEP) and number of matching peptide fragments for successful and unsuccessful precursors. The data are shown for all prioritized peptides across all priority tiers. (b) The data from panel a are shown faceted by priority tier. All data shown are from the consistency experiments from Fig. 2c. In previous analyses conducted during a period of suboptimal instrument performance, the number of matching fragments was shown to effectively distinguish between the peptides which were identified at 1\% FDR and those that were not identified, which was reported in version 1 of our preprint. This trend is not observed in the current dataset, which was acquired by the same instrument but with more efficient ion isolation by its quadrupole, (c) and (d).
Extended Data Fig. 4
Extended Data Fig. 4. Fraction of inclusion-list precursors detected and analyzed in pSCoPE runs.
(a) MS1 detection and MS2 analysis rates for prioritized precursors in the benchmark experiments displayed in Fig. 2a. Each boxplot contains 8 data points, one for each LC-MS/MS analysis. (b) MS1 detection and MS2 analysis rates for prioritized precursors in the benchmark experiments displayed in Fig. 2b–e. Each boxplot contains 8 data points, one for each LC-MS/MS analysis. In both panels, the statistics are shown for each tier along with the number of precursors in the tier. Boxplot whiskers display the minimum and maximum values within 1.5 times the interquartile range of the 25th and 75th percentiles, respectively; the 25th percentile, median, and 75th percentile are also featured.
Extended Data Fig. 5
Extended Data Fig. 5. pSCoPE outperforms isobaric Match Between Runs (iMBR) for increasing consistency of identification across single-cell experiments.
(a) The ‘All Precursors’ facet heading indicates the total number of MBR-facilitated precursor identifications in each of 8 shotgun analyses. The ‘Precursors with MS2 Scans’ facet heading indicates the total number of MBR-facilitated precursor identifications that are associated with MS2 scans, enabling reporter ion quantitation. In both facets, the identifications are segmented into ‘All matches’, a category which includes matches to reverse sequences, and ‘Forward matches’, which does not. Each point represents an experiment. Data derived from shotgun experiments shown in Fig. 2a–e. (b) The intersected precursors between the MBR-facilitated forward sequence matches and the corresponding prioritized analyses were then compared based on consistency of identification across the 8 experiments associated with each acquisition method. Each point represents a precursor. Data derived from shotgun and pSCoPE analyses shown in Fig. 2a. Boxplot whiskers display the minimum and maximum values within 1.5 times the interquartile range of the 25th and 75th percentiles, respectively; the 25th percentile, median, and 75th percentile are also featured.
Extended Data Fig. 6
Extended Data Fig. 6. Data completeness and proteome coverage for BMDMs analyzed by shotgun or prioritized methods.
(a) Percent data completeness tallied for peptides and proteins quantified across twenty shotgun and twenty pSCoPE experiments, faceted by priority tier. n = 175 and 186 single-cells for the prioritized and shotgun analysis methods, respectively. (b) Number of peptides and proteins per single-cell sample across twenty shotgun and twenty pSCoPE experiments. n = 175 and 186 single-cells for the prioritized and shotgun analysis methods, respectively. (c) Illustration of precursor-intensity-dependent MS2 fill times for precursors on the top priority tier. Percent data completeness contrast for precursors which were allotted increased fill times in the pSCoPE analyses. n = 175 and 186 single-cells for the prioritized and shotgun analysis methods, respectively. Boxplot whiskers display the minimum and maximum values within 1.5 times the interquartile range of the 25th and 75th percentiles, respectively; the 25th percentile, median, and 75th percentile are also featured.
Extended Data Fig. 7
Extended Data Fig. 7. PCA of BMDMs using only observed data points.
To evaluate the robustness of our results to uncertainties stemming from missing data, we performed PCA of unimputed BMDM data. The single cells are color-coded by treatment condition, with adjoining PCA plots color-coded by the median relative abundance of proteins corresponding to type I interferon-mediated signaling and phagosome maturation.
Extended Data Fig. 8
Extended Data Fig. 8. PCA color-coded by protein-level data completeness.
To evaluate whether the biological conclusions we drew from our PC-weight-based PSEA could have been influenced by separation due to data completeness, we color-coded our cross-condition BMDM PCA by the percent data completeness on a per-cell basis.
Extended Data Fig. 9
Extended Data Fig. 9. FACS gating parameters and staining controls.
(a) FSC-A and SSC-A gates for sorted bone-marrow-derived macrophages and positive/negative staining populations. (b) Dextran:PE-Texas Red gating parameters for isolating the most and least endocytic BMDM populations from each treatment group (untreated and LPS-treated).
Extended Data Fig. 10
Extended Data Fig. 10. Dextran uptake in untreated BMDM samples.
The uptake of fluorescent dextran by the untreated macrophages was measured by FACS, and the cells with the lowest and highest uptake were isolated for protein analysis. The volcano plot displays the fold changes for differentially abundant proteins and the associated statistical significance. The untreated macrophages were displayed in the space of their PCs and color-coded by the median abundance of the low-uptake or the high-uptake proteins. Both the low and the high-uptake proteins correlate inversely to PC1 (low-uptake: Spearman r = −0.29, q <= 6×10⁻⁴; high-uptake: Spearman r = −0.37, q <= 4×10⁻⁶).

References

    1. Murray, P. J. Macrophage polarization. Annu. Rev. Physiol.79, 541–566 (2017). 10.1146/annurev-physiol-022516-034339 - DOI - PubMed
    1. Jha, A. K. et al. Network integration of parallel metabolic and transcriptional data reveals metabolic modules that regulate macrophage polarization. Immunity42, 419–430 (2015). 10.1016/j.immuni.2015.02.005 - DOI - PubMed
    1. Specht, H. et al. Single-cell proteomic and transcriptomic analysis of macrophage heterogeneity using SCoPE2. Genome Biol.22, 50 (2021). 10.1186/s13059-021-02267-5 - DOI - PMC - PubMed
    1. Budnik, B., Levy, E., Harmange, G. & Slavov, N. SCoPE-MS: mass-spectrometry of single mammalian cells quantifies proteome heterogeneity during cell differentiation. Genome Biol.19, 161 (2018). 10.1186/s13059-018-1547-5 - DOI - PMC - PubMed
    1. Slavov, N. Single-cell protein analysis by mass spectrometry. Curr. Opin. Chem. Biol.60, 1–9 (2020). 10.1016/j.cbpa.2020.04.018 - DOI - PMC - PubMed

Publication types