. 2023 Apr;5(4):642-659.
doi: 10.1038/s42255-023-00771-5. Epub 2023 Apr 3.

Formate overflow drives toxic folate trapping in MTHFD1 inhibited cancer cells

Affiliations

Formate overflow drives toxic folate trapping in MTHFD1 inhibited cancer cells

Alanna C Green et al. Nat Metab. 2023 Apr.

Abstract

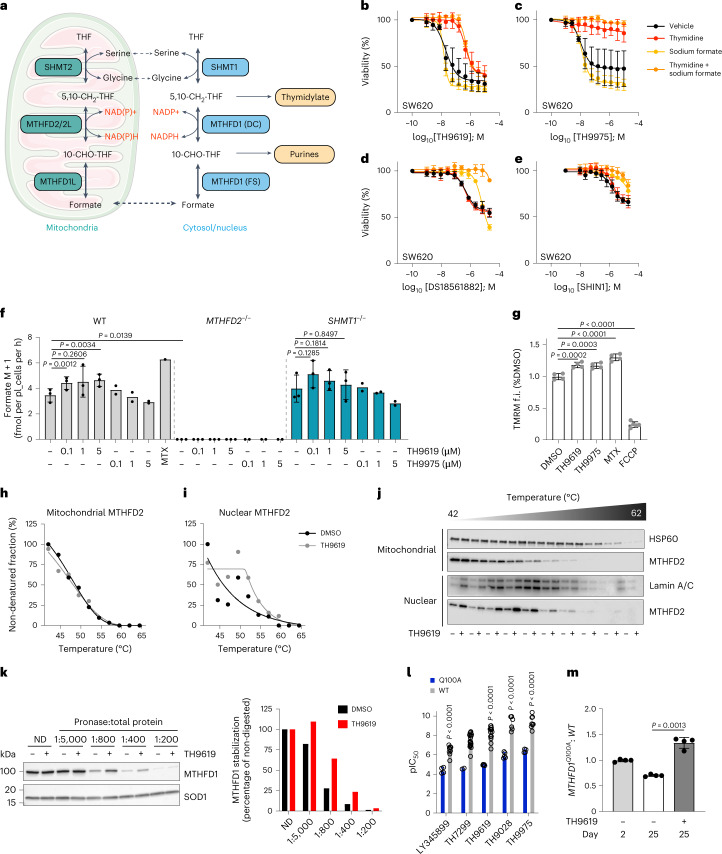
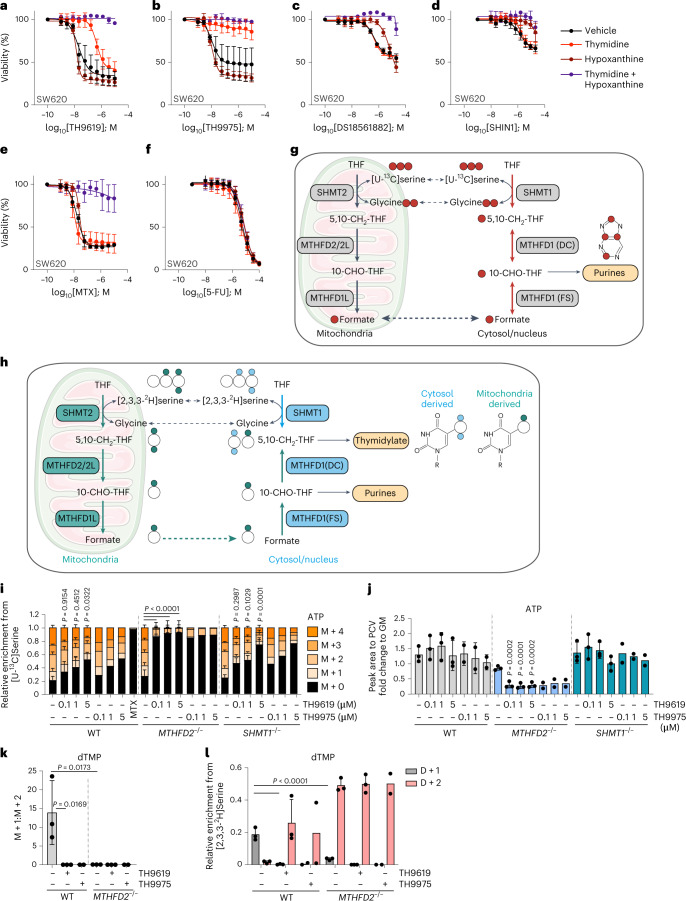
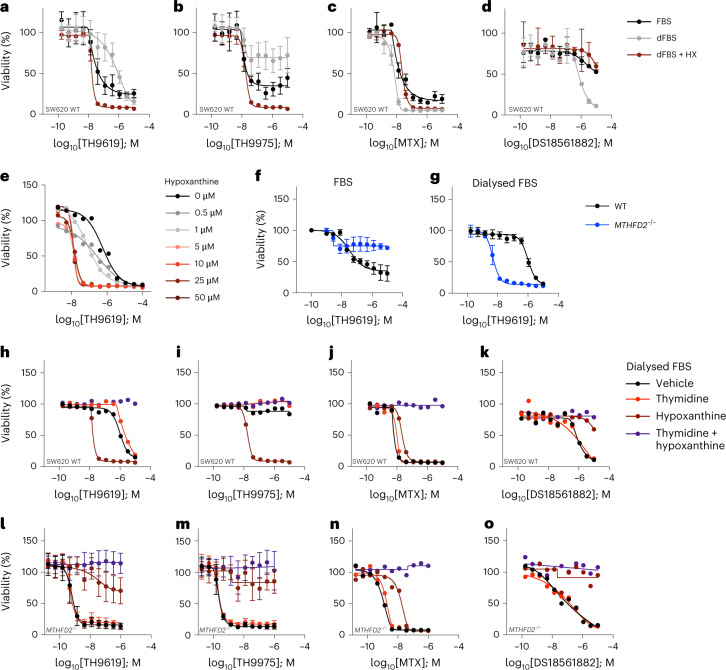
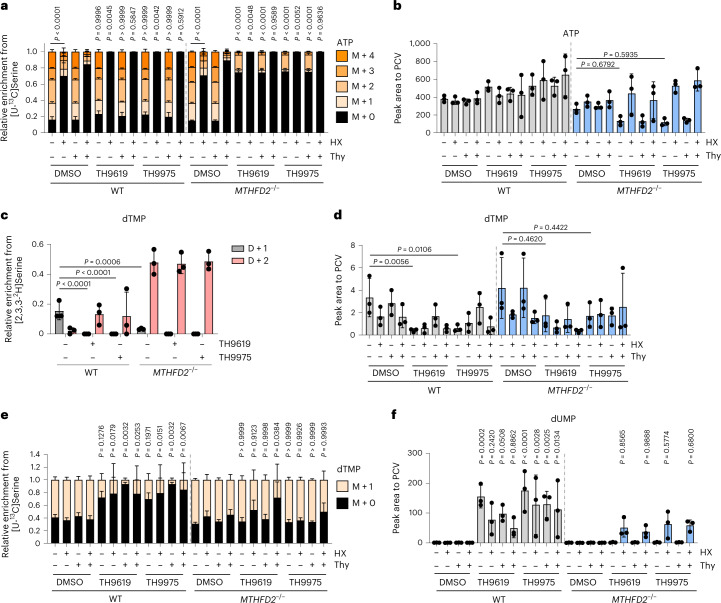
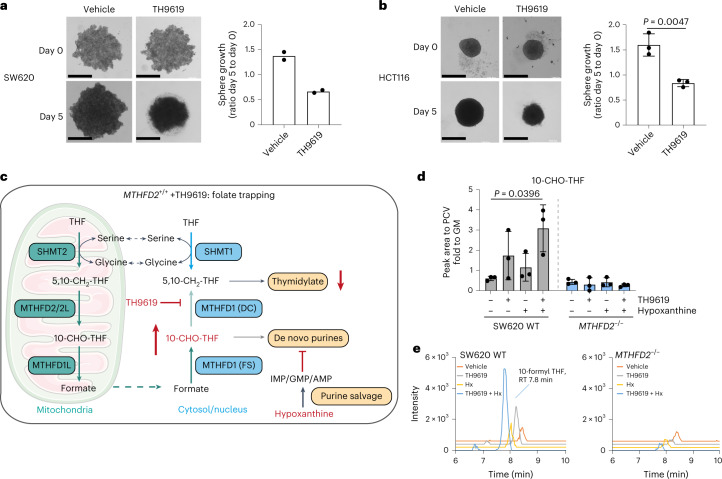
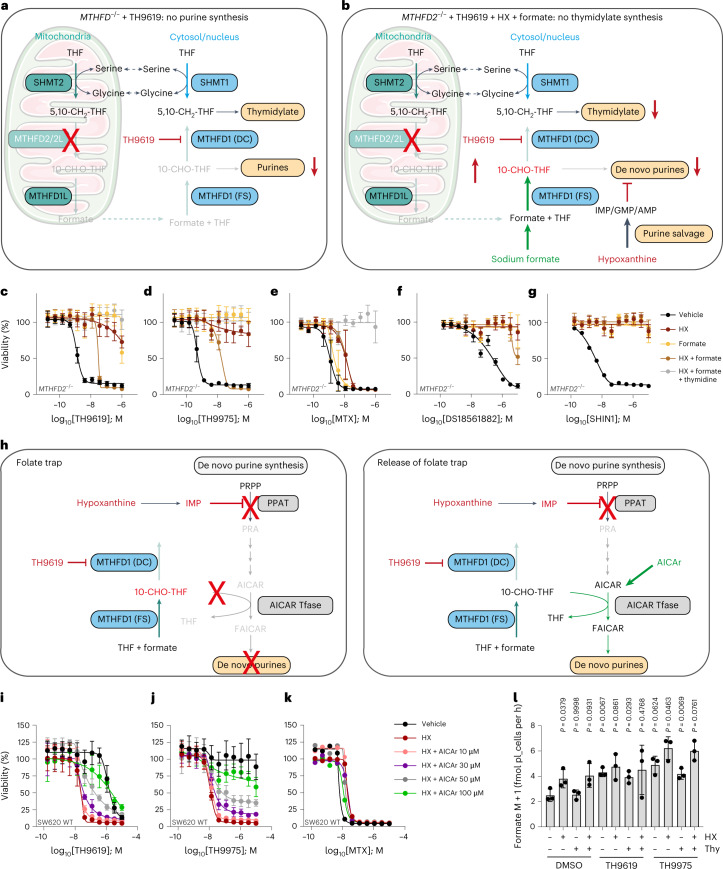
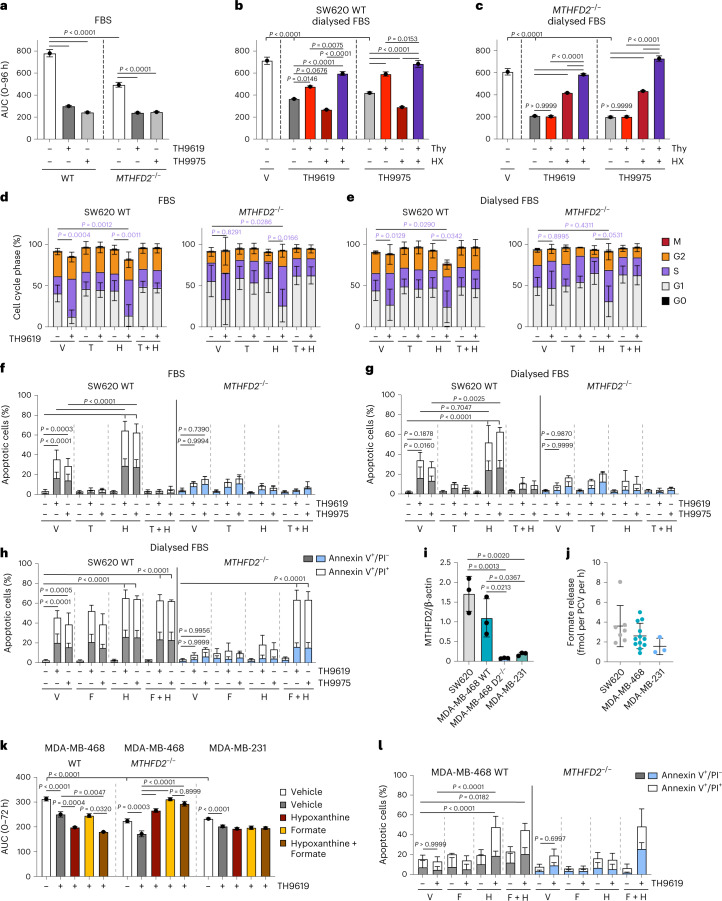
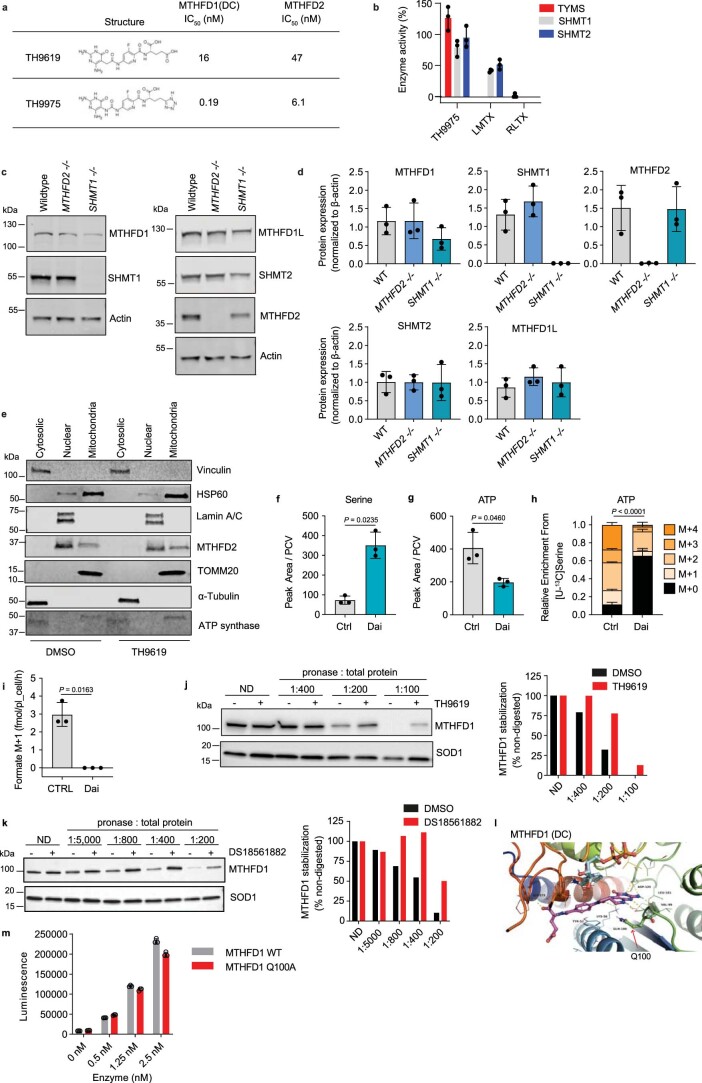
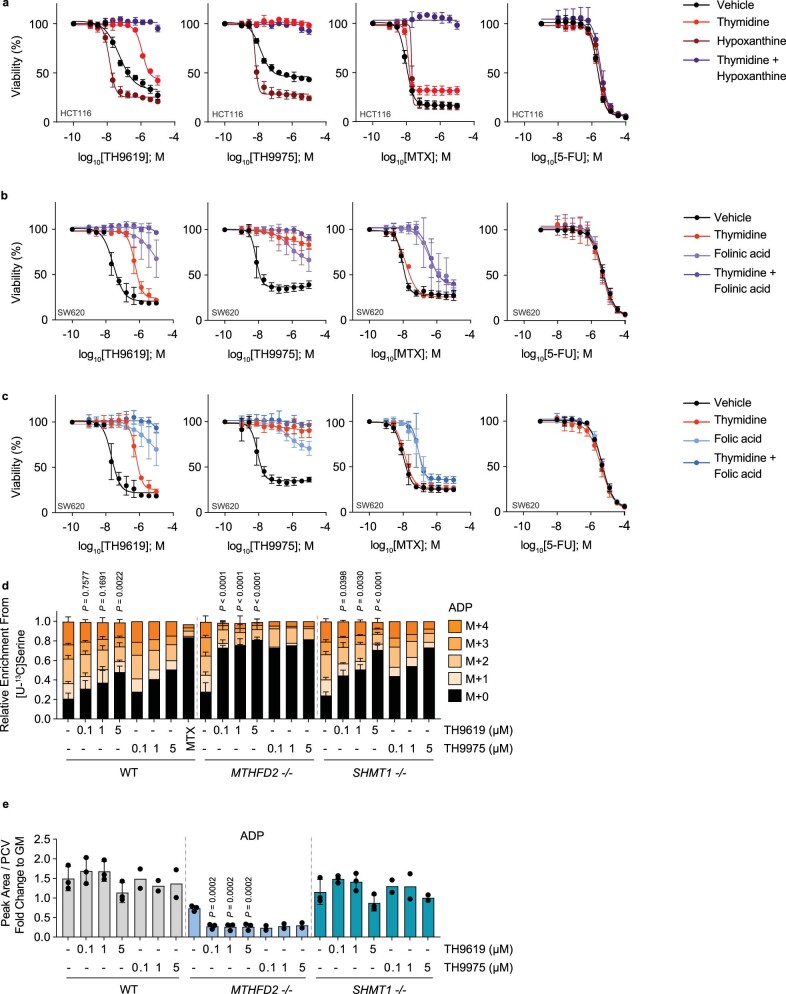
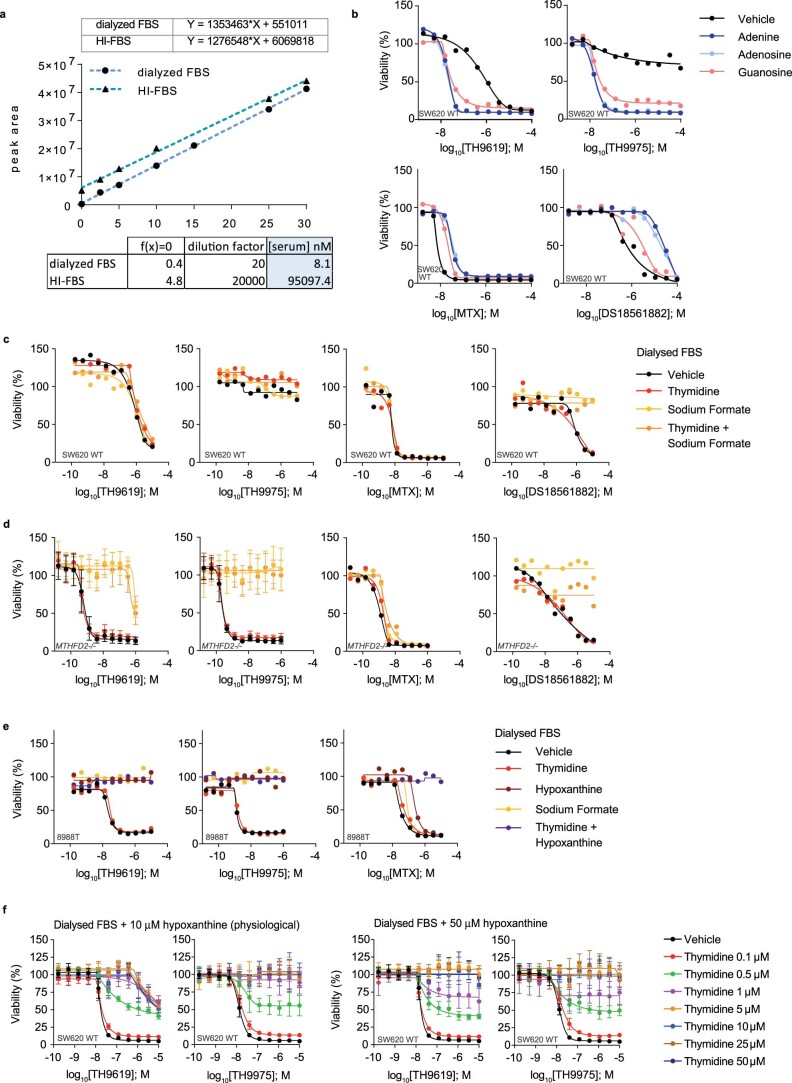
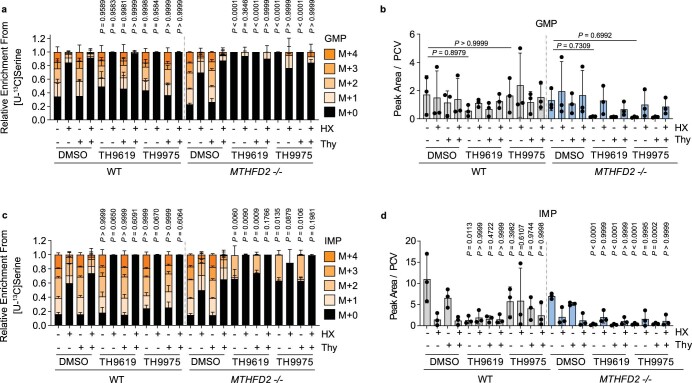
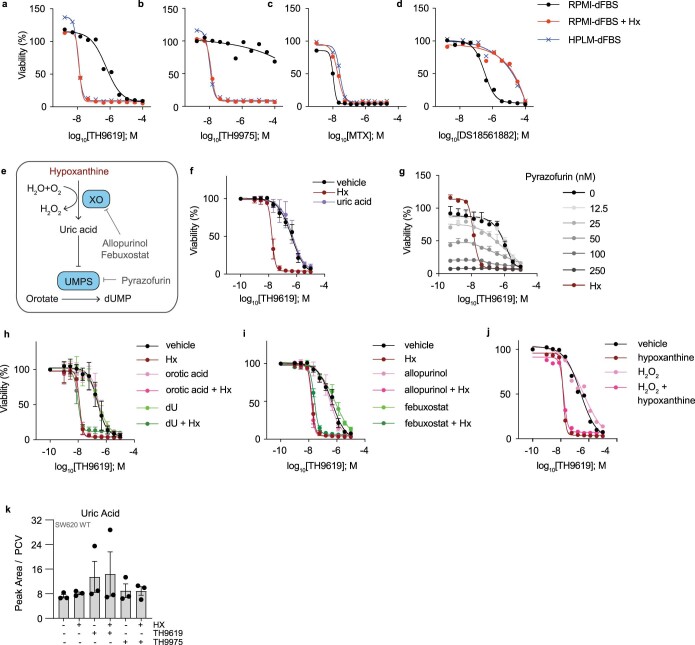
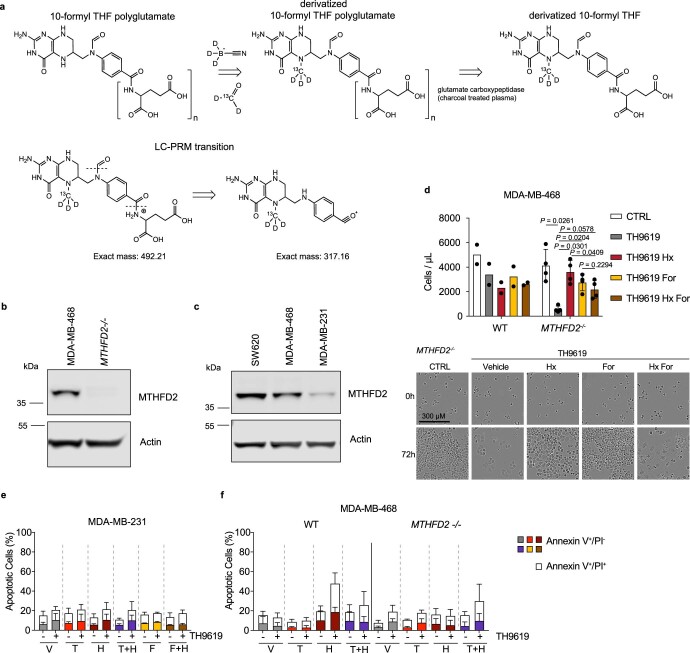
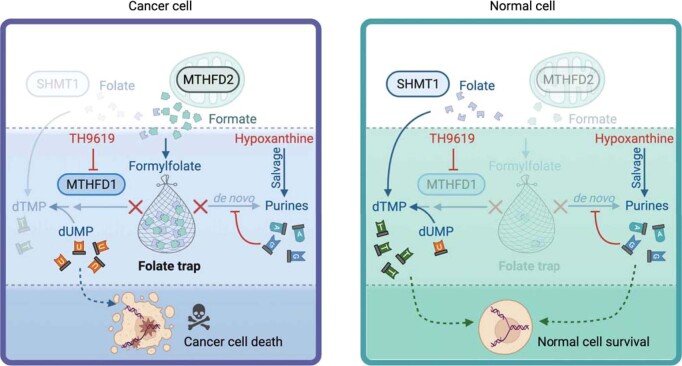
Cancer cells fuel their increased need for nucleotide supply by upregulating one-carbon (1C) metabolism, including the enzymes methylenetetrahydrofolate dehydrogenase-cyclohydrolase 1 and 2 (MTHFD1 and MTHFD2). TH9619 is a potent inhibitor of dehydrogenase and cyclohydrolase activities in both MTHFD1 and MTHFD2, and selectively kills cancer cells. Here, we reveal that, in cells, TH9619 targets nuclear MTHFD2 but does not inhibit mitochondrial MTHFD2. Hence, overflow of formate from mitochondria continues in the presence of TH9619. TH9619 inhibits the activity of MTHFD1 occurring downstream of mitochondrial formate release, leading to the accumulation of 10-formyl-tetrahydrofolate, which we term a 'folate trap'. This results in thymidylate depletion and death of MTHFD2-expressing cancer cells. This previously uncharacterized folate trapping mechanism is exacerbated by physiological hypoxanthine levels that block the de novo purine synthesis pathway, and additionally prevent 10-formyl-tetrahydrofolate consumption for purine synthesis. The folate trapping mechanism described here for TH9619 differs from other MTHFD1/2 inhibitors and antifolates. Thus, our findings uncover an approach to attack cancer and reveal a regulatory mechanism in 1C metabolism.


Conflict of interest statement

MTHFD1/2 inhibitors are developed toward the clinic by the company One-Carbon Therapeutics AB. A.S. is an employee of One-Carbon Therapeutics AB. T.H. owns shares in One-Carbon Therapeutics AB and P.M., E.W., S.B., A.-S.J., O.L., O.M., E.H., N.B. and M.H. have rights to One-Carbon Therapeutics AB. The remaining authors declare no competing interests.

Figures

Fig. 1
Fig. 1. TH9619 and TH9975 target MTHFD1(DC) but not mitochondrial MTHFD2.
a, 1C metabolism flux between mitochondria and cytosol/nucleus. be, Dose–response curves of SW620 cells treated for 96 h with TH9619 (b), TH9975 (c), DS18561882 (d) or SHIN1 (e) in the presence of 50 μM thymidine, 1 mM sodium formate or vehicle (cultured in RPMI-FBS), means ± s.d. (n = 3). f, [U-13C]serine-derived formate release rate of SW620 WT, MTHFD2−/− and SHMT1−/− cells treated for 24 h with the indicated concentrations of TH9619 and TH9975 or 50 nM MTX (cultured in RPMI-FBS), means ± s.d. (n = 3 for control and TH9619, n = 2 for TH9975, n = 1 for MTX); one-way ANOVA (analysis of variance) with Tukey’s multiple comparisons test. g, Quantification of mitochondrial membrane potential in SW620 WT cells treated with 1 µM of TH9619 or TH9975 or 0.5 µM MTX for 48 h. FCCP was used as positive control. Data are displayed as means ± s.d. (n = 4, n = 5 for FCCP); one-way ANOVA with Dunnett’s test for multiple comparisons. h,i, CETSA analysis of MTHFD2 stabilization in SW620 WT cells treated for 3 h with 10 µM TH9619 or vehicle. MTHFD2 stabilization was assessed by western blot by normalizing remaining MTHFD2 signal to HSP60 in the mitochondrial fractions (h) or lamin A/C in the nuclear fractions (i). j, Representative immunoblots of one out of two independent experiments. k, DARTS analysis of MTHFD1 stabilization in SW620 lysates that were incubated with 10 µM TH9619 or vehicle for 30 min, followed by protein digestion at increasing pronase concentration and assessment of MTHFD1 degradation by western blot. MTHFD1 signal was normalized to SOD1. Shown is a representative out of three independent experiments. l, Mean pIC50 (−log of half-maximum inhibitory concentration) values for indicated MTHFD1/2 inhibitors assessed for their inhibitory activity against MTHFD1(DC) WT or MTHFD1(DC) mutant (Q100A), mean (from left to right n = 4, 9, 2, 19, 5, 15, 5, 6, 4, 8); unpaired, two-tailed t-test. m, CRISPR-Select cassette for MTHFD1-Q100A was delivered to SW620 cells. The graph shows the ratio of MTHFD1-Q100A versus WT on day 2 and day 25 of 10 μM TH9619 treatment normalized to day 2 value, means ± s.d. (n = 4); paired, two-tailed t-test. Source data
Fig. 2
Fig. 2. TH9619 primarily inhibits thymidylate biosynthesis in SW620 WT cells and purine biosynthesis in MTHFD2−/− cells.
af, Dose–response curves of SW620 WT cells treated for 96 h with TH9619 (a), TH9975 (b), DS18561882 (c), SHIN1 (d), MTX (e) or 5-FU (f) in the presence of 50 μM thymidine, 250 μM hypoxanthine or vehicle (cultured in RPMI-FBS), means ± s.d. (n = 3). g, 1C metabolism labelling derived from [U-13C] serine tracer with red dots indicating 13C atoms in individual metabolites. 5,10-CH2-THF, 5,10-methylenetetrahydrofolate; 10-CHO-THF, 10-formyl tetrahydrofolate; MTHFD1/1L/2/2L, methylenetetrahydrofolate dehydrogenase 1/1L/2/2L. h, 1C metabolism labelling derived from [2,3,3-2H]serine tracer with coloured dots indicating cytosol and mitochondrial-derived 2H atoms in individual metabolites. i, [U-13C]serine-derived MID of ATP in SW620 WT, MTHFD2−/− and SHMT1−/− cells treated for 24 h with the indicated concentrations of TH9619 and TH9975 in μM or 50 nM MTX (cultured in RPMI-FBS), mean ± s.d. (n = 3 for untreated and TH9619, n = 2 for TH9975, n = 1 for MTX); one-way ANOVA with Tukey’s multiple comparisons test for M + 0. P values indicate comparisons to untreated control of each cell line. j, ATP level normalized to PCV in SW620 WT, MTHFD2−/− and SHMT1−/− cells treated for 24 h with the indicated concentrations of TH9619 and TH9975 in μM (cultured in RPMI-FBS), means ± s.d. (n = 3 for untreated and TH9619, n = 2 for TH9975); one-way ANOVA with Dunnett’s test for multiple comparisons. P values indicate comparisons to the untreated control. k, Ratio of the [2,3,3-2H]serine-derived M + 1 to M + 2 isotopologues of dTMP in SW620 WT and MTHFD2−/− cells treated for 24 h with 1 μM TH9619 and TH9975 (cultured in RPMI-FBS), means ± s.d. (n = 3 for untreated and TH9619, n = 2 for TH9975); one-way ANOVA with Tukey’s multiple comparisons test. l, Relative enrichment of [2,3,3-2H]serine-derived M + 1 to M + 2 isotopologues of dTMP in SW620 WT and MTHFD2−/− cells treated for 24 h with 1 μM TH9619 and TH9975 (cultured in RPMI-FBS), means ± s.d. (n = 3 for untreated and TH9619, n = 2 for TH9975); one-way ANOVA with Tukey’s multiple comparisons test for D + 1 isotopologue of dTMP. Source data
Fig. 3
Fig. 3. Hypoxanthine potentiates TH9619-induced thymidylate depletion.
ad, Cell viability dose–response curves of SW620 WT cells treated for 96 h with TH9619 (a), TH9975 (b), MTX (c) or DS18561882 (d), and cultured in RPMI-FBS, RPMI-dFBS or RPMI-dFBS supplemented with 50 μM hypoxanthine, means ± s.d. (n = 8 independent cell cultures for TH9619 and TH9975, n = 4 for MTX and DS18561882). e, Titration of hypoxanthine at indicated doses in SW620 WT cells treated for 96 h with TH9619 (cultured in RPMI-dFBS). Data are displayed as means (n = 2 independent cell cultures). f,g, Dose–response curves of SW620 WT and MTHFD2−/− cells treated for 96 h with TH9619 and cultured in RPMI-FBS (f) or RPMI-dFBS (g), means ± s.d. (n = 3 independent cell cultures). hk, Cell viability dose–response curves of SW620 WT cells treated for 96 h with TH9619 (h), TH9975 (i), MTX (j) or DS18561882 (k) and 50 μM thymidine, 50 μM hypoxanthine or vehicle (cultured in RPMI-dFBS), means (n = 2 independent cell cultures). lo, Cell viability dose–response curves of SW620 MTHFD2−/− cells treated for 96 h with TH9619 (l), TH9975 (m), MTX (n) or DS18561882 (o) and 50 μM thymidine, 50 μM hypoxanthine or vehicle (cultured in RPMI-dFBS), means ± s.d. (n = 4 independent cell cultures for TH9619 and TH9975, n = 2 for MTX and DS18561882). Source data
Fig. 4
Fig. 4. Metabolic tracing confirms potentiation of TH9619-induced thymidylate depletion by hypoxanthine.
a, [U-13C]serine- derived MID of ATP in SW620 WT and MTHFD2−/− cells treated for 24 h with 1 μM TH9619 or TH9975, 50 μM hypoxanthine and 50 μM thymidine (cultured in RPMI-dFBS), means ± s.d. (n = 3); one-way ANOVA with Šídák’s multiple comparisons test for M + 0. P values indicate comparisons to DMSO controls of each cell line. b, ATP levels normalized to PCV in SW620 WT and MTHFD2−/− cells treated for 24 h with 1 μM TH9619 or TH9975, 50 μM hypoxanthine and 50 μM thymidine (cultured in RPMI-dFBS), means ± s.d. (n = 3); one-way ANOVA with Šídák’s multiple comparisons test. c, Relative enrichment of [2,3,3-2H]serine-derived M + 1 to M + 2 isotopologues of dTMP in SW620 WT and MTHFD2−/− cells treated for 24 h with 1 μM TH9619 and TH9975 (cultured in RPMI-dFBS), means ± s.d. (n = 3); one-way ANOVA with Tukey’s multiple comparisons test. d, dTMP levels normalized to PCV in SW620 WT and MTHFD2−/− cells treated for 24 h with 1 μM TH9619 or TH9975, 50 μM hypoxanthine and 50 μM thymidine (cultured in RPMI-dFBS), means ± s.d. (n = 3); one-way ANOVA with Šídák’s multiple comparisons test. e, [U-13C]serine-derived MID of dTMP in SW620 WT and MTHFD2−/− cells treated for 24 h with 1 μM TH9619 or TH9975, 50 μM hypoxanthine and 50 μM thymidine (cultured in RPMI-dFBS), means ± s.d. (n = 3); one-way ANOVA with Šídák’s multiple comparisons test for M + 0. P values indicate comparisons to respective DMSO controls of each cell line. f, dUMP levels normalized to PCV in SW620 WT and MTHFD2−/− cells treated for 24 h with 1 μM TH9619 or TH9975, 50 μM hypoxanthine and 50 μM thymidine (cultured in RPMI-dFBS), means ± s.d. (n = 3); one-way ANOVA with Šídák’s multiple comparisons test. P values indicate comparisons to respective DMSO controls of each cell line. Source data
Fig. 5
Fig. 5. TH9619 and hypoxanthine causes 10-CHO-THF accumulation.
a,b, HCT116 (a) and SW620 (b) cells were grown as spheroid cultures in three dimensions. Proliferation was measured as spheroid area from day 0 to 5 on 1 µM TH9619 or vehicle, means ± s.d. (n = 3 for HCT116 and n = 2 for SW620). Representative pictures shown for both cell lines. Scale bars, 500 μm. c, In the folate trapping model, hypoxanthine is converted to IMP, GMP or AMP by purine salvage, causing feedback inhibition on de novo purine synthesis. Simultaneously, TH9619 inhibits MTHFD1(DC), which together blocks consumption of 10-CHO-THF, creating a folate trap and preventing thymidylate synthesis due to exhaustion of THF. d, 10-CHO-THF levels normalized to PCV in SW620 WT and MTHFD2−/− cells treated for 24 h with 1 μM TH9619 and 50 μM hypoxanthine (cultured in RPMI-dFBS), means ± s.d. (n = 3); one-way ANOVA with Tukey’s multiple comparisons test. e, LC–MS chromatograms for one representative experiment of d. RT, retention time. Source data
Fig. 6
Fig. 6. Formate release by mitochondrial 1C flux is required for TH9619-mediated trapping of 10-CHO-THF.
a, TH9619 blocks purine synthesis in MTHFD2−/− cells. b, Exogenous supply of sodium formate and hypoxanthine can induce the TH9619 folate trapping mechanism and block thymidylate synthesis in MTHFD2−/− cells. cg, Cell viability dose–response curves of SW620 MTHFD2−/− cells treated for 96 h with TH9619 (c), TH9975 (d), MTX (e), DS18561882 (f) or SHIN1 (g) and 50 μM hypoxanthine, 1 mM sodium formate, 50 μM thymidine or vehicle (cultured in RPMI-dFBS), two representative experiments displayed as means ± s.d. (n = 4 independent cell cultures). h, Hypoxanthine and TH9619 cause folate trapping in WT cells. Treatment with AICAr bypasses the block in de novo purine synthesis and releases the folate trap by AICAR Tfase consumption of 10-CHO-THF. ik, Cell viability dose–response curves of SW620 WT cells treated for 96 h with TH9619 (i), TH9975 (j) or MTX (k) and vehicle or increasing AICAr concentrations (cultured in RPMI-dFBS), two representative experiments are shown as means ± s.d. (n = 4 independent cell cultures for TH9619 and TH9965, n = 2 for MTX). l, [U-13C]serine-derived formate release rate of SW620 WT cells treated for 24 h with 1 μM TH9619 or TH9975, 50 μM hypoxanthine and 50 μM thymidine (cultured in RPMI-dFBS), means ± s.d. (n = 3); one-way ANOVA with Dunnett’s multiple comparisons test. P values indicate comparisons to the DMSO control. Source data
Fig. 7
Fig. 7. Depletion of dTMP induces cell death while inhibition of purine synthesis induces growth and cell cycle arrest.
ac, Proliferation of (a,b) SW620 WT and (c) MTHFD2−/− cells measured as fold change of cell confluence after (a) 1 μM TH9619 or TH9975 (b,c) with or without 50 μM hypoxanthine and 50 μM thymidine (cultured in RPMI-FBS or RPMI-dFBS). AUC of proliferation curves is shown as means ± standard error ((a) n = 3 for WT, n = 4 for MTHFD2−/− (b,c) n = 4); one-way ANOVA with (a) Šídák’s multiple comparisons test or (b,c) Tukey’s multiple comparisons test. d,e, Cell cycle analysis of SW620 WT and MTHFD2−/− cells treated with TH9619, 50 μM thymidine (T), 250 μM hypoxanthine (H) or vehicle (cultured in (d) RPMI-FBS or (e) RPMI-dFBS), means ± s.d. (n = 3); one-way ANOVA with Tukey’s multiple comparisons test for S-phase. fh, Cell death analysis by annexinV/PI staining of SW620 WT and MTHFD2−/− cells after 96 h treatment with 1 μM TH9619 or TH9975 and (f,g) 50 μM hypoxanthine (H) and 50 μM thymidine (T) cultured in (f) RPMI-FBS or (g) RPMI-dFBS, or (h) treated with T and 1 mM formate (F) cultured in RPMI-dFBS, means ± s.d. (n = 3); one-way ANOVA analysis with Tukey’s multiple comparisons test for pooled early and late apoptotic populations. i, MTHFD2 protein levels in SW620, MDA-MB468 and MDA-MB-231 cells normalized to β-actin, means ± s.d. (n = 3); one-way ANOVA analysis with Tukey’s multiple comparisons test. j, Formate release rates of SW620, MDA-MB-468 and MDA-MB-231 cells, means ± s.d. (n = 7 for SW620, n = 12 for MDA-MB-468 and n = 3 for MDA-MB-231). k, Proliferation of MDA-MB-468 WT and MTHFD2−/− cells and MDA-MB-231 cells measured as fold change of cell confluence in response to 1 μM TH9619 and 50 μM hypoxanthine and 1 mM sodium formate (cultured in RPMI-dFBS). AUC of curves is shown as means ± s.e. (n = 3 for MDA-MB-468 and n = 4 for MDA-MB-231); one-way ANOVA with Tukey’s multiple comparisons test. l, Cell death analysis of MDA-MB-468 WT and MTHFD2−/− cells after 96 h treatment with 1 μM TH9619 and 50 μM hypoxanthine (H) and 1 mM formate (F) (cultured in RPMI-dFBS), means ± s.d. (n = 4); one-way ANOVA analysis with Tukey’s multiple comparisons test for pooled early and late apoptotic populations. Source data
Extended Data Fig. 1
Extended Data Fig. 1. TH9619 and TH9975 are inhibitors of MTHFD1(DC) in vitro.
(a) Chemical structures of MTHFD1/2 inhibitors TH9619 and TH9975 and IC50 values for inhibition of MTHFD1(DC) and MTHFD2 enzymatic activities for each inhibitor. (b) Enzymatic activity of TYMS, SHMT1 and SHMT2 upon incubation with 100 µM TH9975 compared to their known inhibitors lometrexol (LMTX) and raltitrexed (RLTX), means ± SD (n = 3). (c, d) Expression of the indicated proteins was analyzed by Western Blot in SW620 WT, MTHFD2-/- and SHMT1-/- cells. β-actin served as loading control. Immunoblots are representative of 3 independent repeats. Signal intensity was quantified and normalized to loading control and global mean, means ± SD (n = 3). (e) Verification of the purity of mitochondrial and nuclear fractions for CETSA analysis. Shown are representative immunoblots of one out of two independent experiments. (f, g) Serine and ATP levels normalized to packed cell volume (PCV) in SW620 WT cells treated for 24 h with 10 µM DS18561882, mean ± SD (n = 3); paired, two-tailed t-test. (h) [U-13C]serine-derived MID of ATP in SW620 WT cells treated for 24 h with 10 µM DS18561882, mean ± SD (n = 3); one-way ANOVA with Šídák’s multiple comparison test for M + 0. (i) [U-13C]serine-derived release rate of formate M + 1 isotopologue from SW620 WT cells treated for 24 h with 10 µM DS18561882, mean ± SD (n = 3); paired, two-tailed t-test. (j, k) DARTS analysis of MTHFD1 stabilization in SW620 cells upon TH9619 (j) or DS18561882 (k) treatment. Intact cells (j) or cell lysates (k) were incubated with 10 µM TH9619 or vehicle for 3 h (j) or 30 min (k), followed by protein digestion at increasing pronase concentration and assessment of MTHFD1 degradation by Western blot. MTHFD1 intensities were normalized to SOD1; one representative immunoblot of two independent experiments. (l) Design of MTHFD1/2 inhibitor resistant MTHFD1 protein based on the crystal structure of structurally similar MTHFD2 bound to LY345899 (PDB ID: 5TC4). Highlighted is the residue Q100 that was mutated to alanine (Q100A) and tested in downstream biochemical assays. (m) Enzymatic activity of purified MTHFD1(DC) WT and MTHFD1(DC) mutant (Q100A), means ± SD (n = 3). Source data
Extended Data Fig. 2
Extended Data Fig. 2. Thymidine and folinic acid or folic acid rescue TH9619 and TH9975 toxicity in SW620 WT cells.
(a) Dose-response curves of HCT116 cells treated for 96 h with TH9619, TH9975, methotrexate (MTX) or 5-fluorouracil (5-FU) and 50 μM thymidine, 250 μM hypoxanthine or vehicle (cultured in RPMI-FBS), means ± SD (n = 3). (b) Dose-response curves of SW620 cells treated for 96 h with TH9619, TH9975, MTX or 5-FU and 50 μM thymidine, 1 μM folinic acid or vehicle (cultured in RPMI-FBS), means ± SD (n = 3). (c) Dose-response curves of SW620 cells treated for 96 h with TH9619, TH9975, MTX or 5-FU and 50 μM thymidine, 250 μM folic acid or vehicle (cultured in RPMI-FBS), means ± SD (n = 3). (d) [U-13C]serine- derived MID of ADP in SW620 WT, MTHFD2-/- and SHMT1-/- cells treated for 24 h with the indicated concentrations of TH9619 and TH9975 in μM or 50 nM MTX (cultured in RPMI-FBS), means ± SD (n = 3 for untreated and TH9619, n = 2 for TH9975, n = 1 for MTX); one-way ANOVA with Tukey’s multiple comparisons test for M + 0. P-values indicate comparisons to the untreated control of each cell line. (e) ADP levels normalized to packed cell volume (PCV) in SW620 WT, MTHFD2-/- and SHMT1-/- cells treated for 24 h with the indicated concentrations of TH9619 and TH9975 in μM (cultured in RPMI-FBS), mean ± SD (n = 3 for untreated and TH9619, n = 2 for TH9975); one-way ANOVA with Dunnett’s test for multiple comparisons. P-values indicate comparisons to the untreated control. Source data
Extended Data Fig. 3
Extended Data Fig. 3. External supply of sodium formate rescues viability of cells with impaired mitochondrial 1C folate cycle.
(a) HX concentration in HI-FBS and dialyzed FBS was determined by titration with HX standard of known concentration. Linear regression of the standard curve was used to calculate y-intercept and corresponding HX concentration in nM in pure HI-FBS or dialyzed FBS. (b) Dose-response curves of SW620 WT cells treated for 96 h with TH9619, TH9975, methotrexate (MTX) or DS18561882 and 50 μM adenine, 50 μM adenosine, 50 μM guanosine or vehicle (cultured in RPMI-dFBS), means (n = 2 independent cell cultures). (c) Dose-response curves of SW620 WT cells treated for 96 h with TH9619, TH9975, MTX or DS18561882 and 50 μM thymidine, 1 mM sodium formate or vehicle (cultured in RPMI-dFBS), means (n = 2 independent cell cultures). (d) Dose-response curves of SW620 MTHFD2-/- cells treated as in (c). Means ± SD (n = 4 independent cell cultures for TH9619 and TH9975, n = 2 for MTX and DS18561882). (e) Cell viability dose-response curves of PA-TU-8988T cells treated for 96 h with TH9619, TH9975 or MTX and 50 μM thymidine, 50 μM hypoxanthine, 1 mM sodium formate or vehicle (cultured in DMEM-dFBS), means (n = 2 independent cell cultures). (f) Dose-response curves of SW620 WT cells treated for 96 h with TH9619 or TH9975 and increasing doses of thymidine. Cells were cultured in media containing dFBS and 10 or 50 µM hypoxanthine, means ± SD (n = 4). Source data
Extended Data Fig. 4
Extended Data Fig. 4. TH9619 and TH9975 impair GMP synthesis in SW620 MTHFD2-/- cells and reduce IMP levels in SW620 WT and MTHFD2-/- cells.
(ad) [U-13C]serine- derived MID of GMP (a) and IMP (c) and levels of GMP (b) and IMP (d) normalized to packed cell volume (PCV) in SW620 WT and MTHFD2-/- cells treated for 24 h with 1 μM TH9619 or TH9975, 50 μM hypoxanthine and 50 μM thymidine (cultured in RPMI-dFBS), means ± SD (n = 3); one-way ANOVA with Šídák’s multiple comparisons test. For panels a and c, statistical analysis was performed for M + 0. P-values indicate comparisons to respective DMSO controls. Source data
Extended Data Fig. 5
Extended Data Fig. 5. Inhibition of UMPS is not a major contributor to MTHFD1/2i toxicity.
(ad) Dose-response curves of SW620 cells treated for 96 h with TH9619, TH9975, methotrexate (MTX) or DS18561882 (cultured in RPMI-dFBS, RPMI-dFBS with 50 μM hypoxanthine or HPLM-dFBs), one representative experiment displayed as means (n = 2 independent cell cultures). (e) Hypothesis that hypoxanthine converts to uric acid to inhibit UMPS. (f) Dose-response curves of SW620 cells treated for 96 h with TH9619, 50 μM hypoxanthine, 350 μM uric acid or vehicle (cultured in RPMI-dFBS), means ± SD (n = 3). (g) Dose-response curves of SW620 cells treated for 96 h with TH9619, pyrazofurin or 50 μM hypoxanthine (cultured in RPMI-dFBS), means ± SD (n = 3 independent cell cultures). (h) Dose-response curves of SW620 cells treated for 96 h with TH9619, 50 μM hypoxanthine, 1 mM orotic acid, 500 μM deoxyuridine (dU) or vehicle (cultured in RPMI-dFBS), means ± SD (n = 3). (i) Dose-response curves of SW620 cells treated for 96 h with TH9619, 50 μM hypoxanthine (Hx), 10 μM allopurinol, 10 μM febuxostat or vehicles (cultured in RPMI-dFBS), means ± SD (n = 3). (j) Dose-response curves of SW620 cells treated for 96 h with TH9619 and 50 μM hypoxanthine, 100 μM H2O2 or vehicle (cultured in RPMI-dFBS), means (n = 2). (k) Uric acid levels normalized to PCV in SW620 WT cells treated for 24 h with 1 μM TH9619 or TH9975 and 50 μM hypoxanthine (cultured in RPMI-dFBS), means ± SD (n = 3). Source data
Extended Data Fig. 6
Extended Data Fig. 6. Breast cancer cells MDA-MB-468 can be sensitized to TH9619.
(a) Top: Reductive methylation reaction described by Schittmayer et al. to stabilize the THF intermediates, followed by the cleavage of the glutamate tails by glutamate carboxypeptidase. Bottom: Suggested mechanism for the tandem mass spectrometry fragmentation of 10-CHO-THF. (b, c) Protein expression of MTHFD2 was analyzed by Western Blot in MDA-MB-468 WT, MDA-MB-468 MTHFD2-/-, MDA-MB-231 and SW620 cells to validate MTHFD2 KO in MDA-MB-468 cells and different expression levels in WT cells. β-actin was used as loading control. Images are representative of 3 independent repeats. Signal intensity was quantified and normalized to loading control and global mean and is shown in Fig. 7i. (d) Absolute cell count was measured as cell number/uL by flow cytometry in MDA-MB-468 WT and MDA-MB-468 MTHFD2-/- in response to 96 h treatment with 1 μM TH9619 and 50 μM hypoxanthine and 1 mM formate (cultured in RPMI-dFBS), means ± SD (n = 2 for WT and n = 4 for MTHFD2-/-); one-way ANOVA with Tukey’s multiple comparisons test was performed for MTHFD2-/- cells. Representative images for Fig. 7k of MDA-MB-468 MTHFD2-/- cell density and morphology are shown at 0 h and 72 h after treatment with 1 μM TH9619, 50 μM hypoxanthine and 1 mM formate (cultured in RPMI-dFBS). (e, f) Cell death analysis measured by AnnexinV/PI staining of MDA-MB-231, MDA-MB-468 WT and MTHFD2-/- cells in response to 96 h treatment with 1 μM TH9619, 50 μM hypoxanthine (H), 50 μM thymidine (T) and 1 mM formate (F, cultured in RPMI-dFBS), means ± SD (n = 2-6). Source data
Extended Data Fig. 7
Extended Data Fig. 7. TH9619 creates a folate trap in MTHFD2-expressing cancer cells, but not normal cells.
Schematic shows generation of a cancer-specific folate trap with TH9619 treatment. High MTHFD2 expression, which is common in cancer cells, causes formate overflow from the mitochondria. Human physiological levels of hypoxanthine activate the purine salvage pathway, causing feedback inhibition on de novo purine synthesis, and preventing consumption of 10-formyl-tetrahydrofolate (10-CHO-THF). Simultaneous inhibition of MTHFD1 with TH9619 also blocks consumption of 10-formyl-tetrahydrofolate for synthesis of thymidylate. This generates a folate trap and depletes cells of the THF substrate that can no longer be used to synthesize thymidylate via SHMT1. As a consequence, dUMP accumulates, and leads to toxic DNA damage and cancer cell death. Healthy cells do not express high levels of MTHFD2 and hence lack the formate overflow required to fuel the folate trap. Image created with BioRender.com.

References

    1. Bester AC, et al. Nucleotide deficiency promotes genomic instability in early stages of cancer development. Cell. 2011;145:435–446. doi: 10.1016/j.cell.2011.03.044. - DOI - PMC - PubMed
    1. Helleday T, Rudd SG. Targeting the DNA damage response and repair in cancer through nucleotide metabolism. Mol. Oncol. 2022;16:3792–3810. doi: 10.1002/1878-0261.13227. - DOI - PMC - PubMed
    1. Henriksson S, Groth P, Gustafsson N, Helleday T. Distinct mechanistic responses to replication fork stalling induced by either nucleotide or protein deprivation. Cell Cycle. 2018;17:568–579. doi: 10.1080/15384101.2017.1387696. - DOI - PMC - PubMed
    1. Locasale JW. Serine, glycine and one-carbon units: cancer metabolism in full circle. Nat. Rev. Cancer. 2013;13:572–583. doi: 10.1038/nrc3557. - DOI - PMC - PubMed
    1. Yang M, Vousden KH. Serine and one-carbon metabolism in cancer. Nat. Rev. Cancer. 2016;16:650–662. doi: 10.1038/nrc.2016.81. - DOI - PubMed

Publication types

MeSH terms