. 2023 May;24(5):855-868.
doi: 10.1038/s41590-023-01476-3. Epub 2023 Apr 3.

Antigen-specific B cells direct T follicular-like helper cells into lymphoid follicles to mediate Mycobacterium tuberculosis control

Affiliations

Antigen-specific B cells direct T follicular-like helper cells into lymphoid follicles to mediate Mycobacterium tuberculosis control

Rosemary V Swanson et al. Nat Immunol. 2023 May.

Abstract

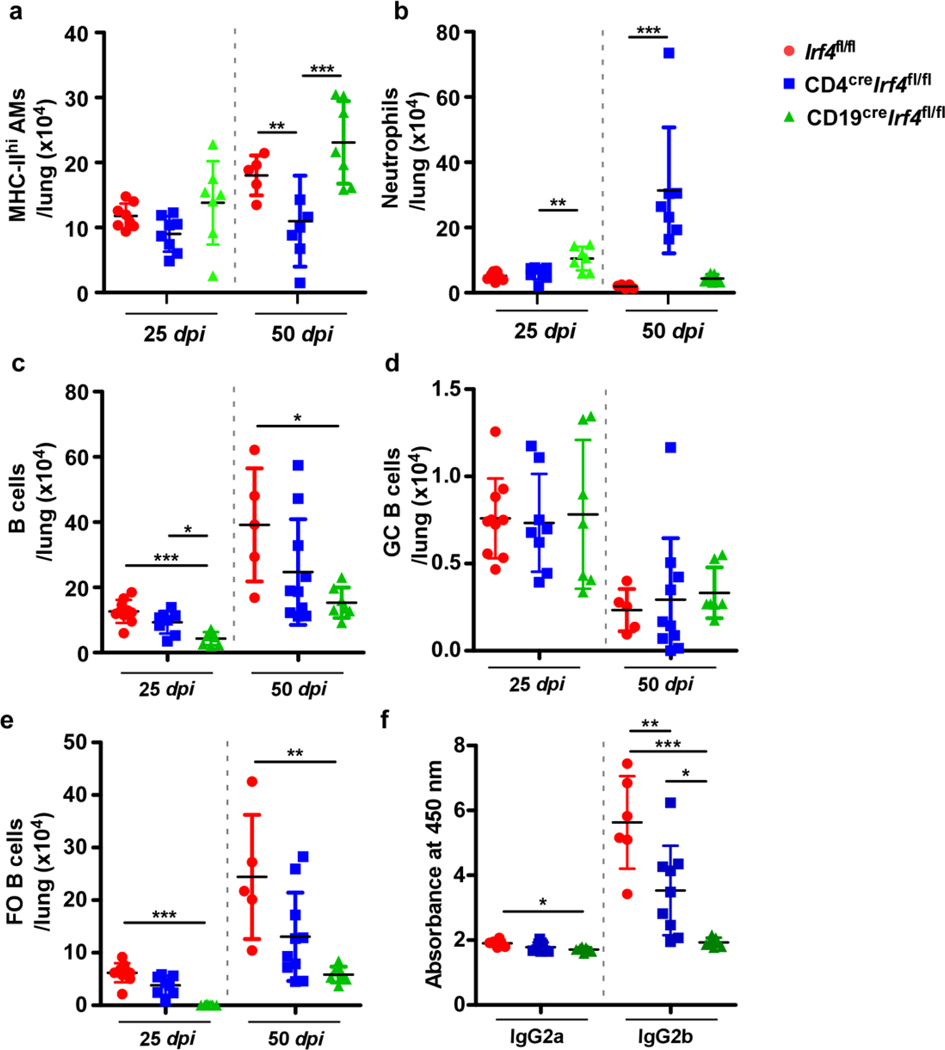
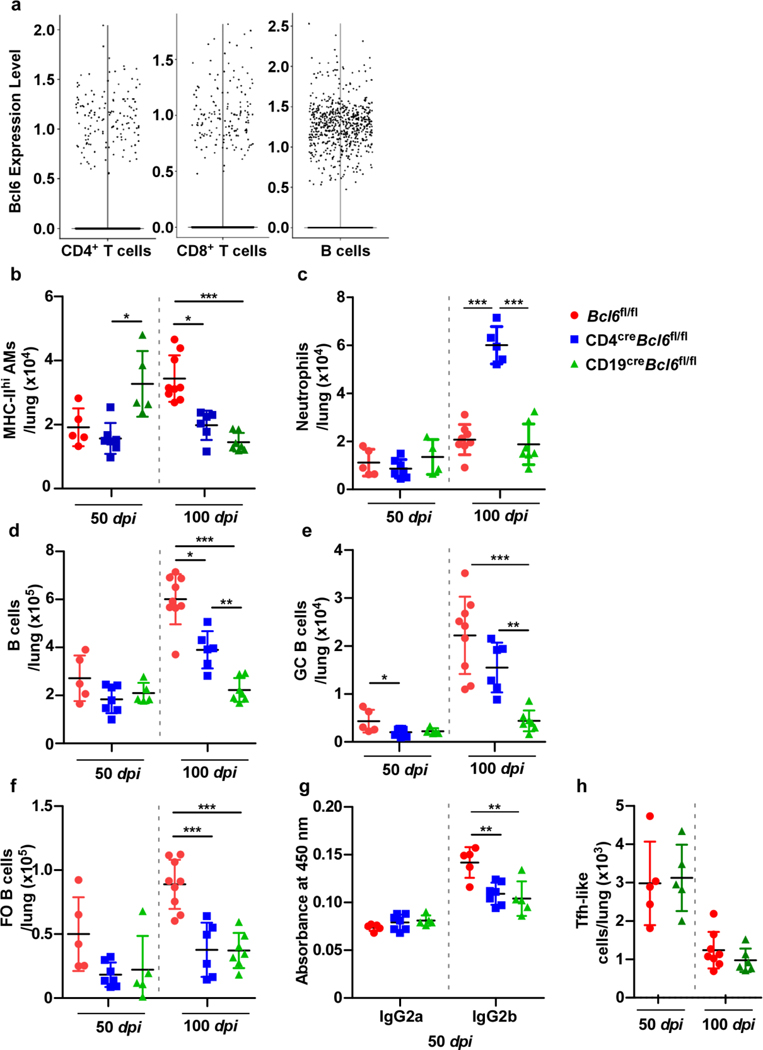
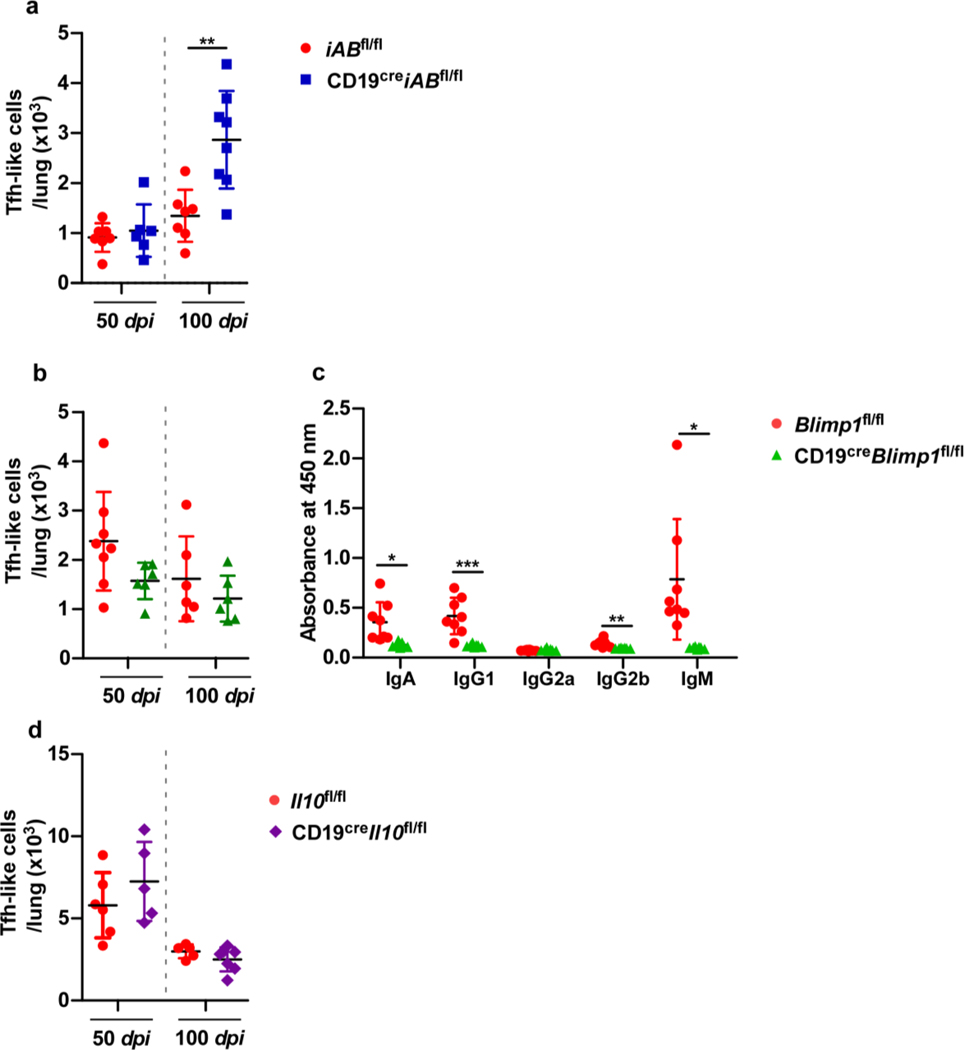
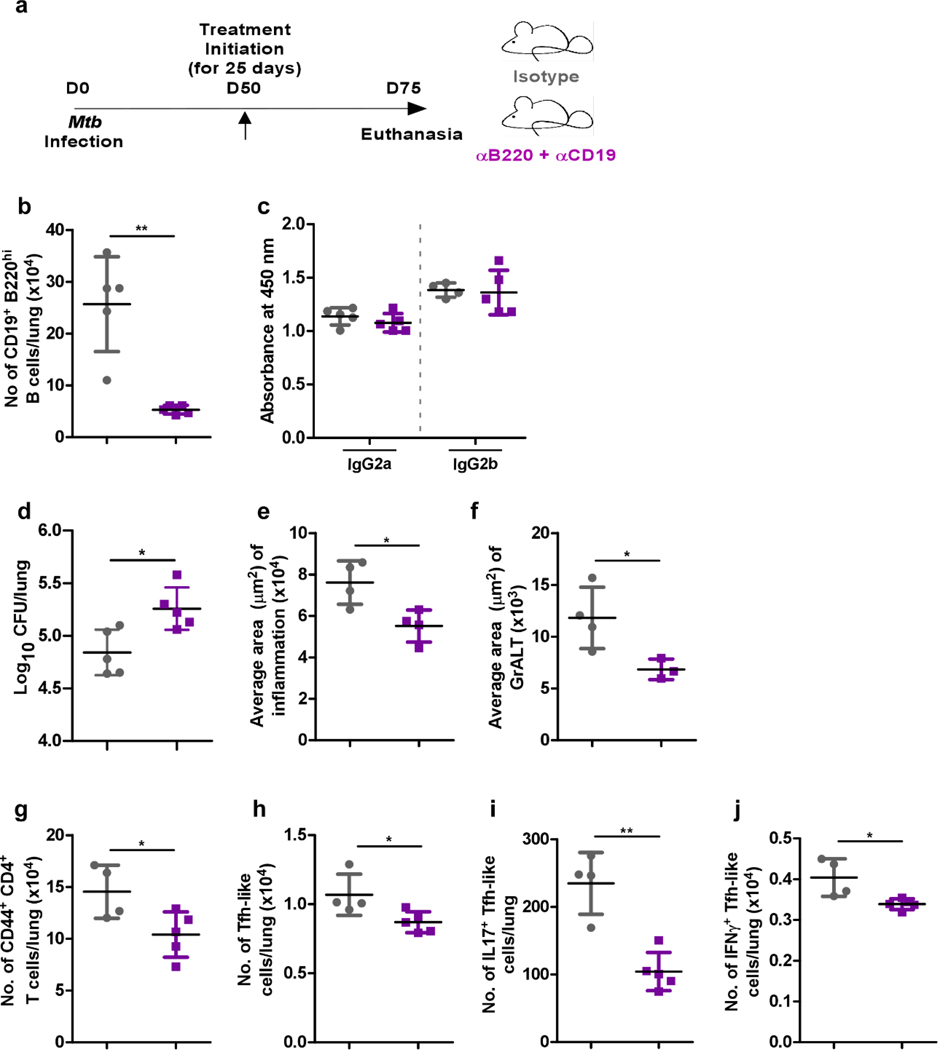
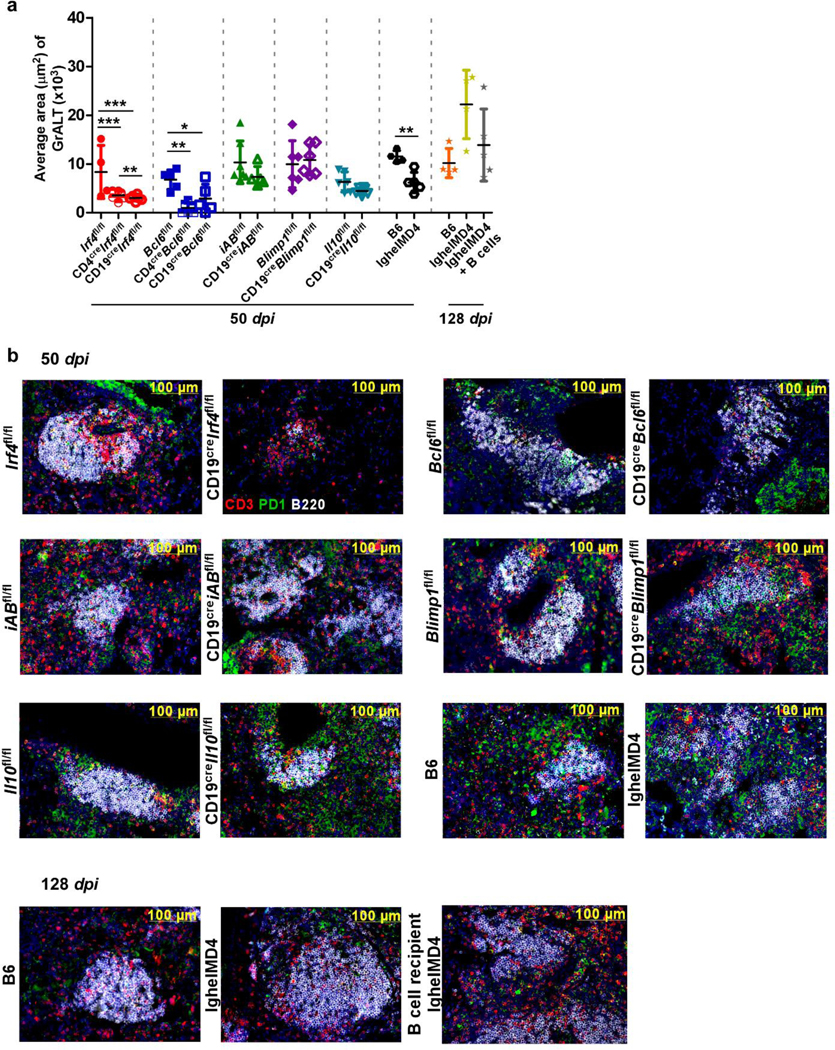
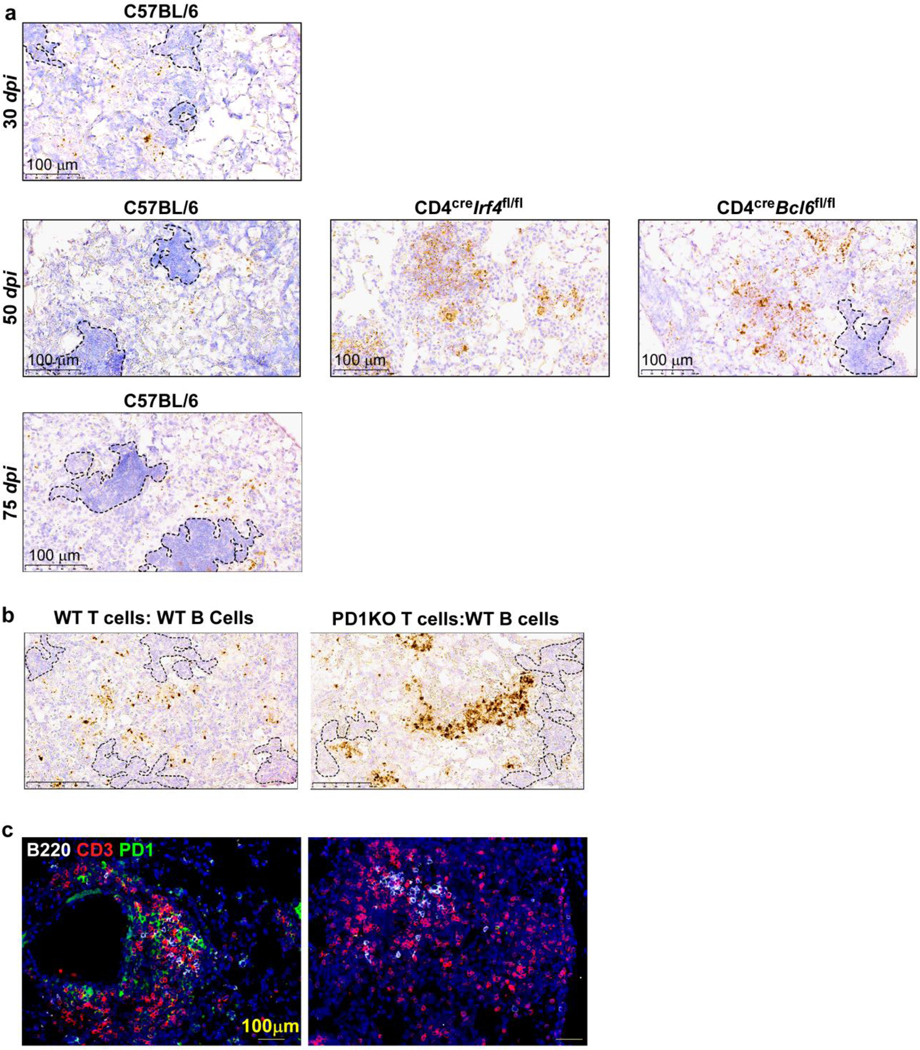
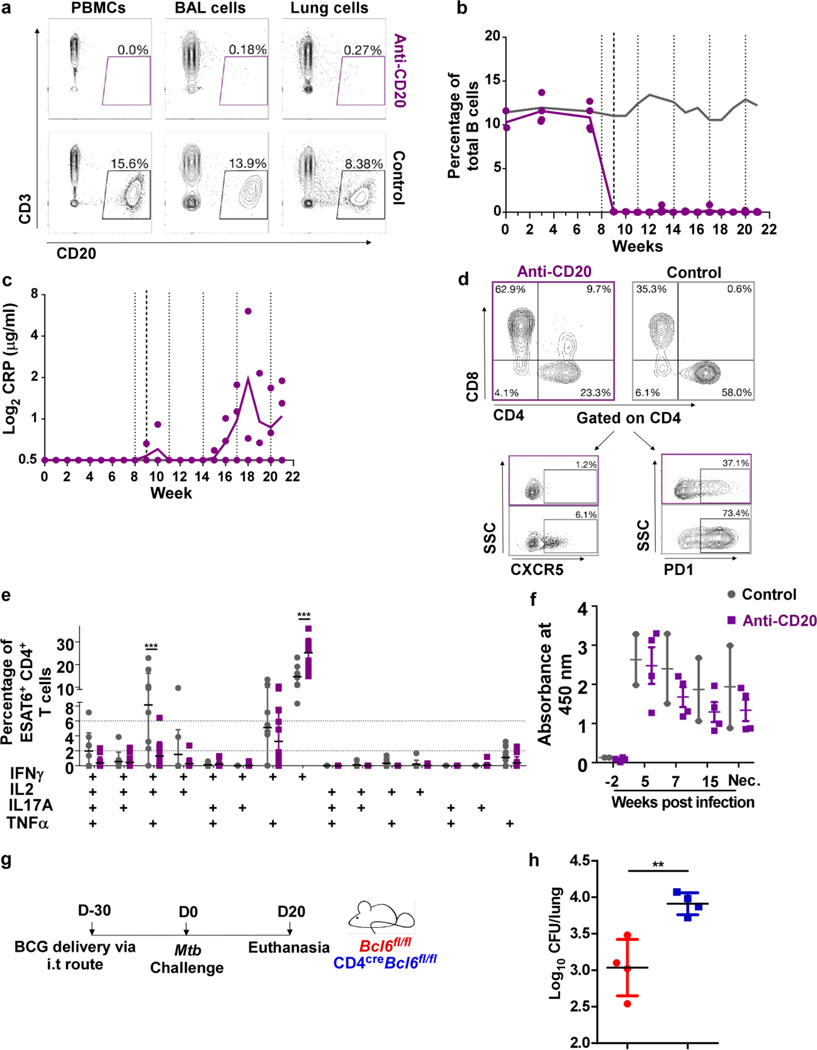
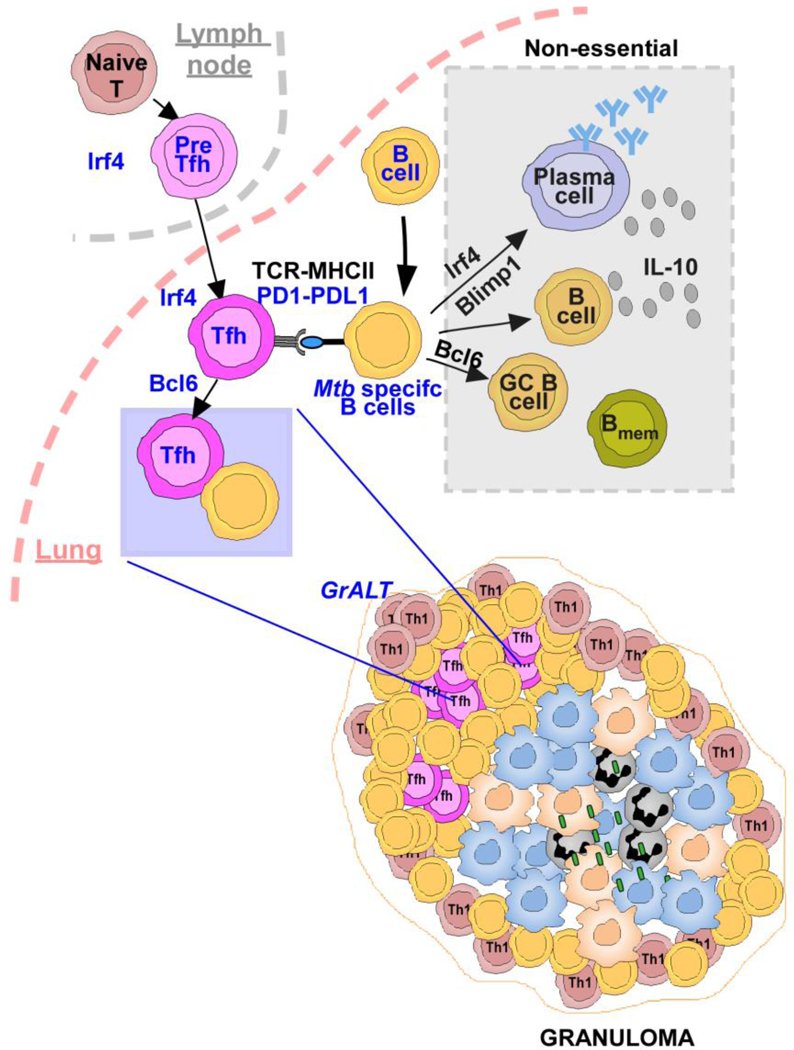
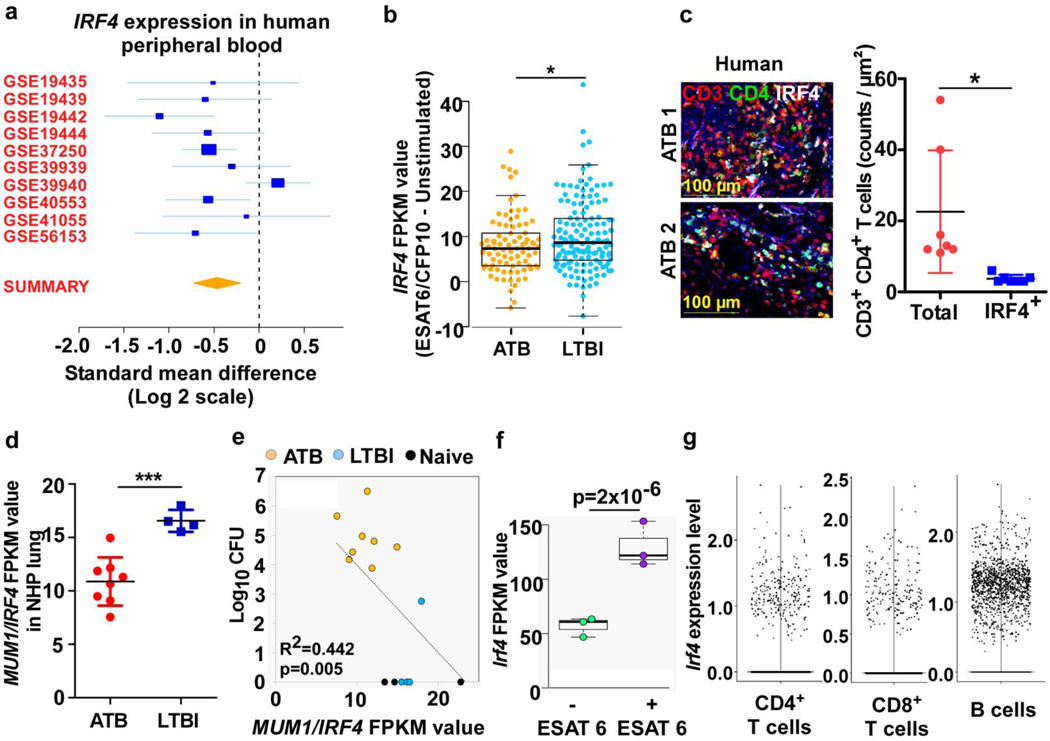
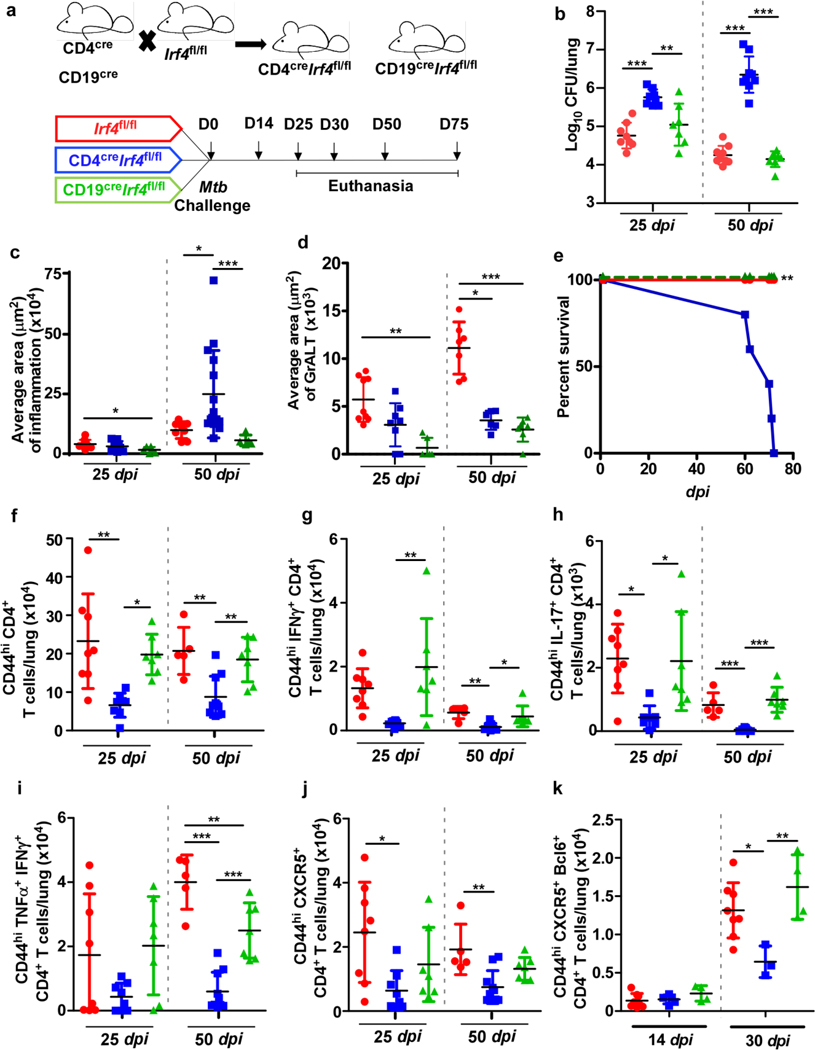
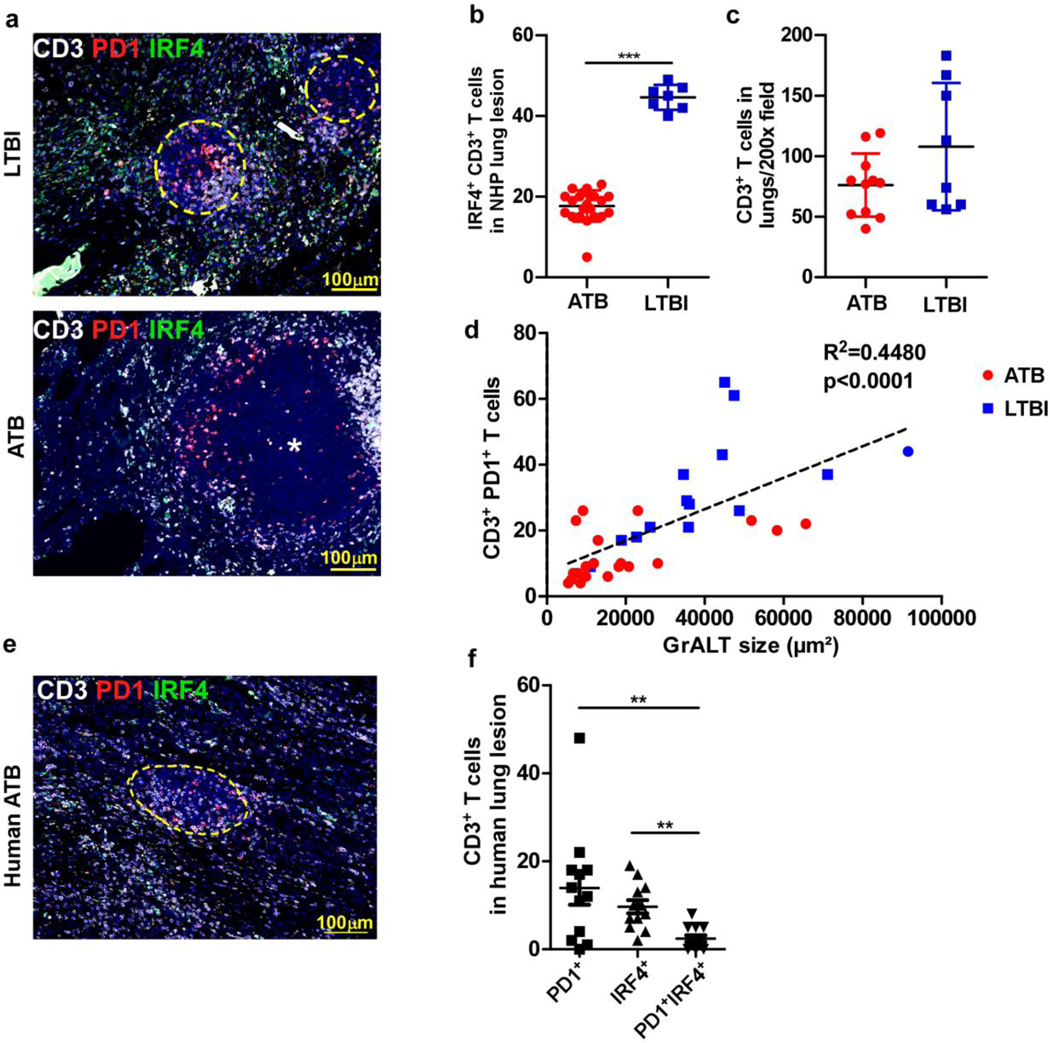
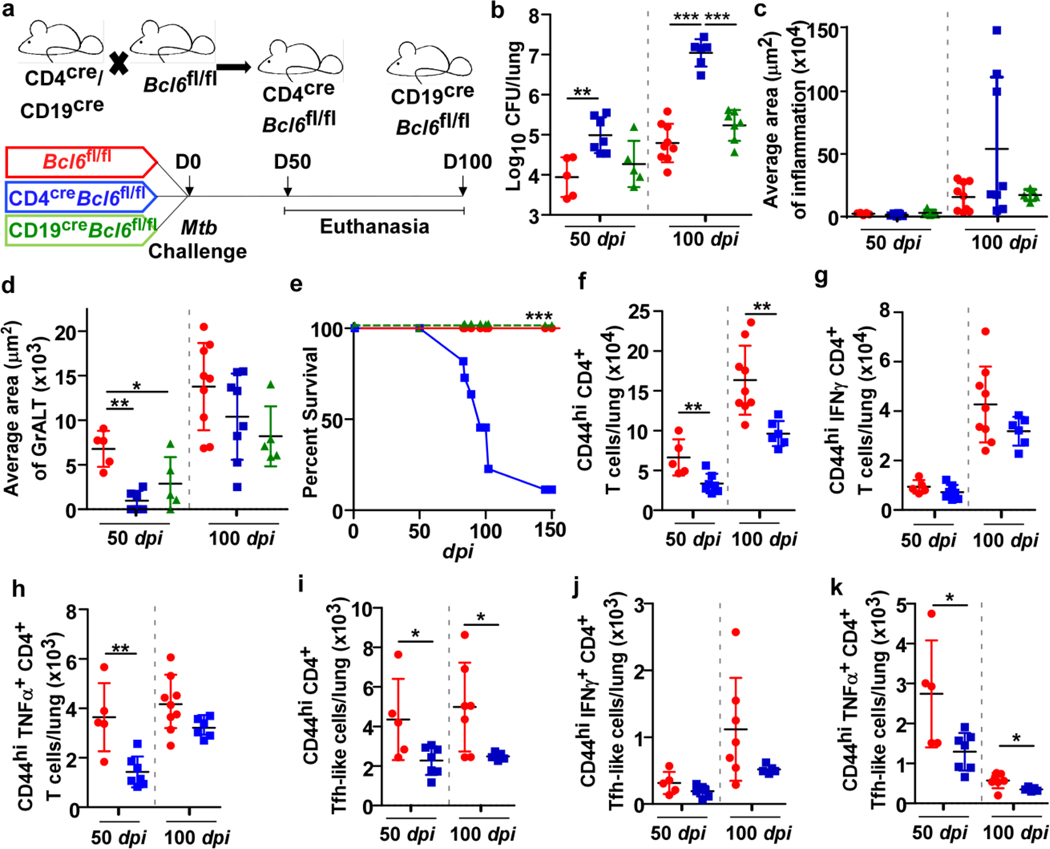
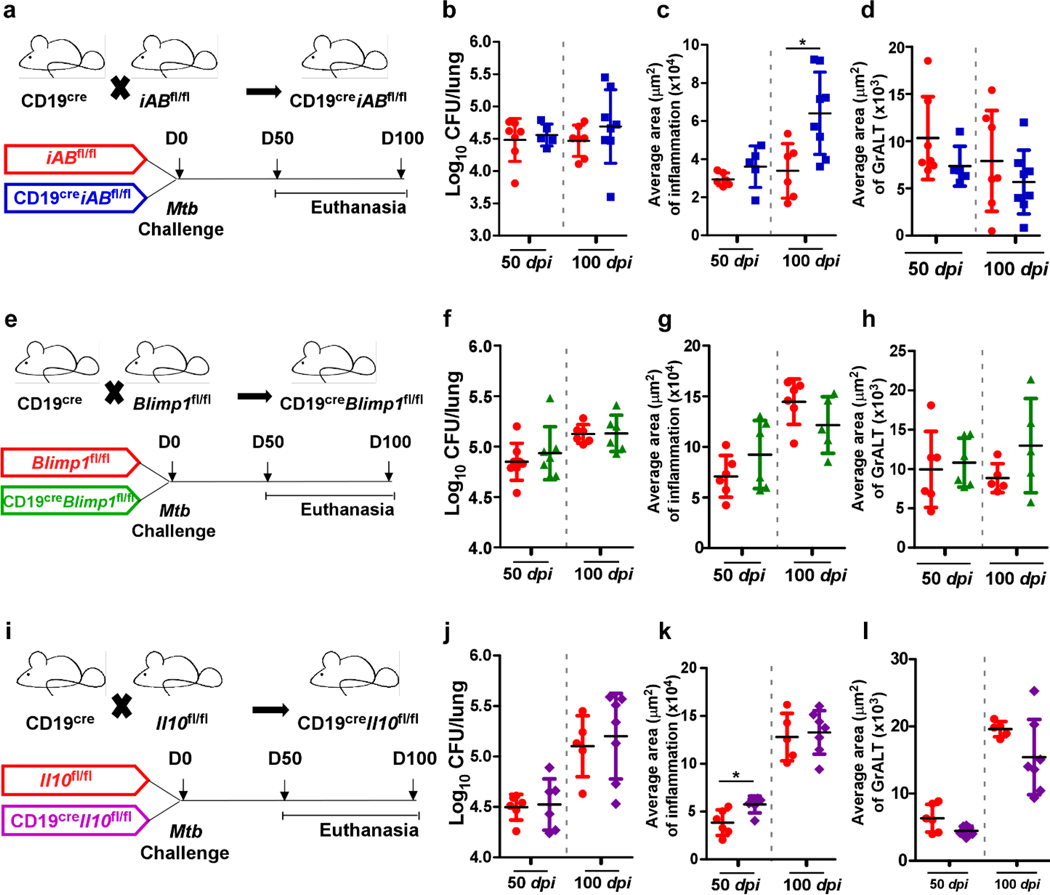
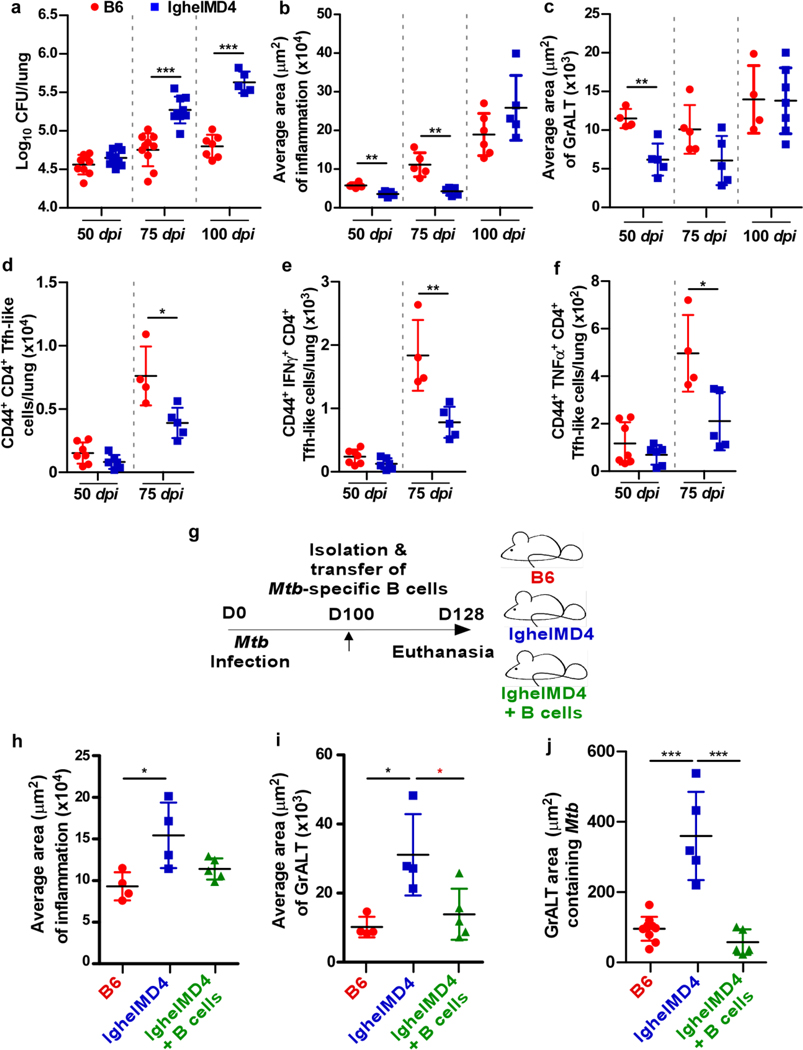
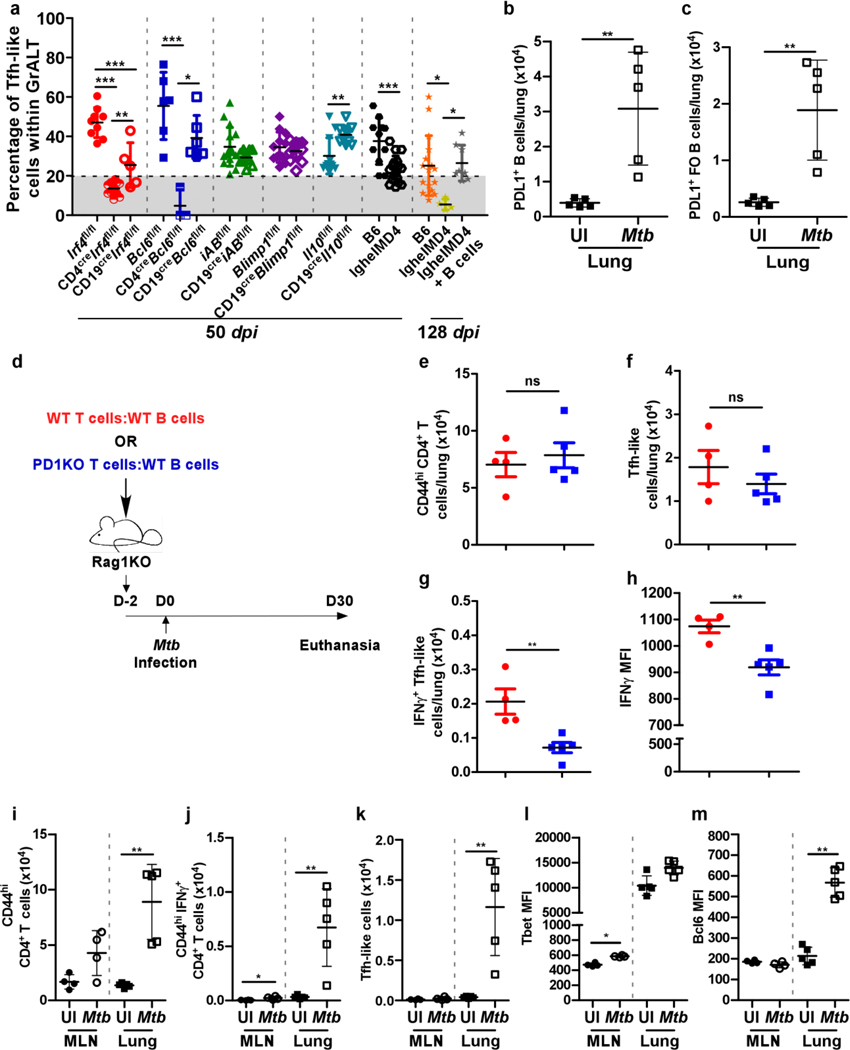
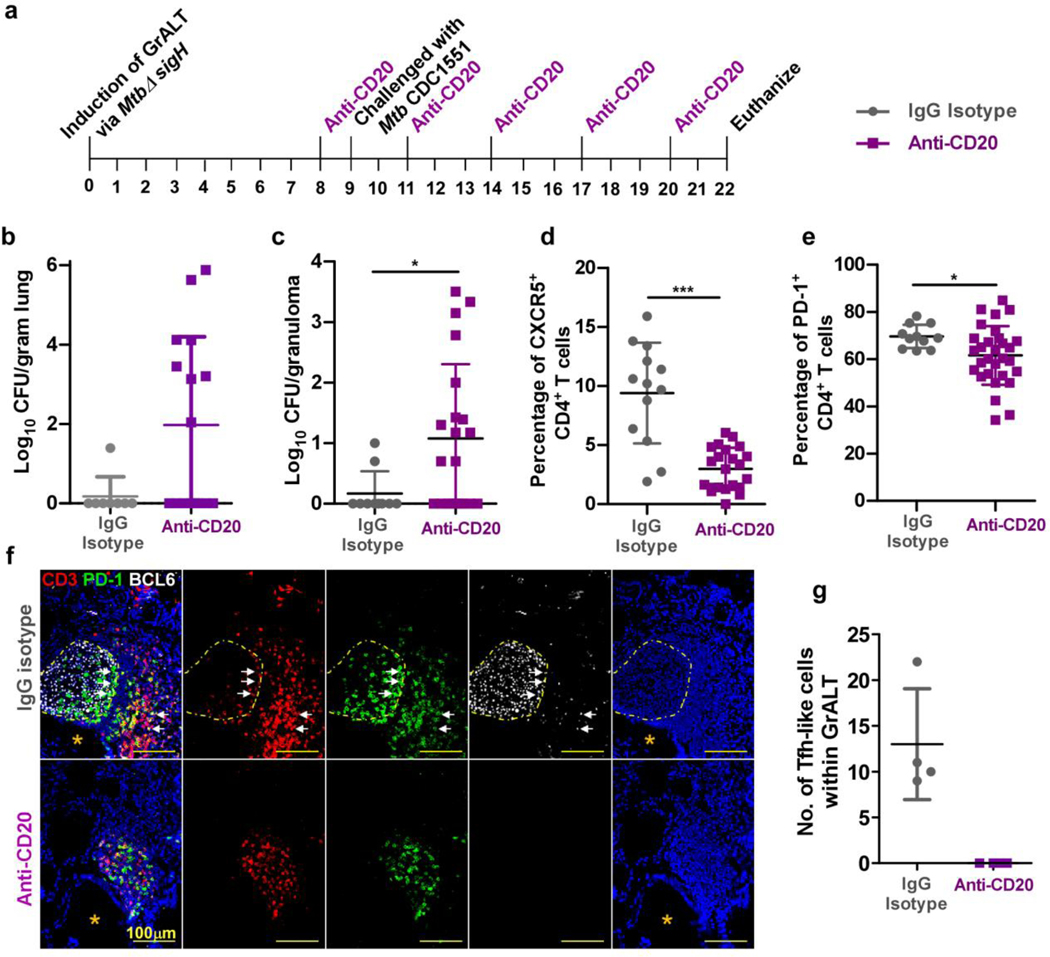
Tuberculosis (TB), caused by Mycobacterium tuberculosis (Mtb), is a global cause of death. Granuloma-associated lymphoid tissue (GrALT) correlates with protection during TB, but the mechanisms of protection are not understood. During TB, the transcription factor IRF4 in T cells but not B cells is required for the generation of the TH1 and TH17 subsets of helper T cells and follicular helper T (TFH)-like cellular responses. A population of IRF4+ T cells coexpress the transcription factor BCL6 during Mtb infection, and deletion of Bcl6 (Bcl6fl/fl) in CD4+ T cells (CD4cre) resulted in reduction of TFH-like cells, impaired localization within GrALT and increased Mtb burden. In contrast, the absence of germinal center B cells, MHC class II expression on B cells, antibody-producing plasma cells or interleukin-10-expressing B cells, did not increase Mtb susceptibility. Indeed, antigen-specific B cells enhance cytokine production and strategically localize TFH-like cells within GrALT via interactions between programmed cell death 1 (PD-1) and its ligand PD-L1 and mediate Mtb control in both mice and macaques.


Conflict of interest statement

Competing interests.

The authors declare no completing interests

Figures

Extended Data Fig 1.
Extended Data Fig 1.. Irf4 expression by CD19+ B cells is required for accumulation of FO B cells in the lung.
Irf4fl/fl, CD4creIrf4fl/fl, and CD19creIrf4fl/fl mice (n = 5–10 mice/group) were infected with Mtb HN878 and euthanized at 25 and 50 dpi. (a) MHC-IIhi AMs, (b) neutrophils, (c) total B cells, (d) GC B cells, and (e) FO B cells were determined by flow cytometry. Sera collected from mice (50 dpi; dilution shown 1:30) was analyzed via ELISA for levels of (f) IgG2a and IgG2b specific for Mtb antigen CFP-10. Data represent mean ± SD, analysis was performed using one-way ANOVA with Tukey’s multiple comparison test (a, c, d, f), and Kruskal-Wallis ANOVA with Dunn’s multiple comparison test (b, e). *, p≤0.05; **,p≤0.005; ***, p≤0.0005.
Extended Data Fig 2.
Extended Data Fig 2.. Bcl6 expression by CD19+ B cells is required for optimal infiltration by B cell subsets in the Mtb-infected lung.
scRNA-seq of cells isolated from the lungs of C57BL/6 mice, either uninfected (n = 2 mice), or Mtb-infected at 50 dpi (n = 3 mice) or 100 dpi (n = 3 mice). (a) Swarm plot showing expression of Bcl6, a downstream target of Irf4, in CD4+, CD8+ T and B cells. Bcl6fl/fl, CD4creBcl6fl/fl, and CD19creBcl6fl/fl mice (n = 5–9 mice/group) were infected with Mtb HN878, euthanized at 50 and 100 dpi, and lungs analyzed by flow cytometry for (b) MHC-IIhi AMs, (c) neutrophils, (d) total B cells, (e) GC B cells, and (f) FO B cells. (g) IgG2a and IgG2b antibody specific against Mtb antigen CFP-10 in peripheral blood serum (diluted 1:30) collected at 50 dpi. (h) Tfh-like cells in the lungs of Bcl6fl/fl vs CD19creBcl6fl/fl mice. Data represent mean ± SD, analysis was performed using Kruskal-Wallis ANOVA with Dunn’s multiple comparison test (b), one-way ANOVA with Tukey’s multiple comparison test (c to g), and two-sided unpaired t-test (h). *, p≤0.05; **,p≤0.005; ***, p≤0.0005.
Extended Data Fig 3.
Extended Data Fig 3.. Blimp1 deficiency in B cells impairs antibody production in mice.
iABfl/fl, and CD19creiABfl/fl mice (n = 6–8 mice/group) were infected with Mtb HN878, euthanized at 50 and 100 dpi, and lungs analyzed by flow cytometry for (a) Tfh-like cells. Blimp1fl/fl, and CD19creBlimp1fl/fl mice (n = 6–8 mice/group) were infected with Mtb HN878, euthanized at 50 and 100 dpi. Lungs analyzed by flow cytometry for (b) Tfh-like cells. (c) Immunoglobulin specificity against Mtb antigen CFP-10 in peripheral blood serum (diluted 1:30) collected at 50 dpi were detected by ELISA. Il10fl/fl, and CD19creIl10fl/fl mice (n = 6–8 mice/group) were infected with Mtb HN878 and euthanized at 50 and 100 dpi. (d) Tfh-like cells were enumerated by flow cytometry. Data represent mean ± SD and statistical analysis was performed with two-sided unpaired t-test. *, p≤0.05; **,p≤0.005; ***, p≤0.0005.
Extended Data Fig 4.
Extended Data Fig 4.. IghelMD4 mice show reduced Mtb-specific antibody production.
B6 and IghelMD4 mice (n = 5–10 mice/group) were infected with Mtb HN878, euthanized at 50, 75 and 100 dpi and organs were collected and processed. (a) CD44hiCD4+ T cells, (b) IFNγ-producing CD4+ T cells, (c) TNFα-producing CD4+ T cells, (d) total B cells, (e) GC B cells, and (f) FO B cells were determined by flow cytometry. (g) Immunoglobulin specificity against Mtb antigen CFP-10 in peripheral blood serum (diluted 1:15) collected at 100 dpi. Data is mean ± SD, analysis was performed using two-sided unpaired t-test (a to f), and two-sided Mann-Whitney U-test (g). *, p≤0.05; **,p≤0.005.
Extended Data Fig 5.
Extended Data Fig 5.. B cell depletion in Mtb-infected mice compromises the accumulation of Tfh-like cells in the lung.
C57BL/6 mice (n = 3–5 mice/group) were infected with Mtb, and infection established over 50 days. At 50 dpi, mice either received B cell depleting antibodies (α-B220 and α-CD19) or isotype via the intratracheal route every 3 – 4 days, over a 25 days period. Mice were euthanized at 75 dpi, and the lungs collected and processed. (a) Experimental scheme. Flow cytometry was used to enumerate (b) CD19+ B220hi B cells, and (c) immunoglobulin specificity against Mtb antigen CFP-10 in peripheral blood serum (diluted 1:30) was determined via ELISA. (d) Bacterial burden was determined in the lungs of Mtb-infected mice receiving either isotype or B cell-depleting antibodies. Formalin-fixed lung lobes were cut and stained to analyze (e) inflammation (average area) and (f) average area of GrALT. Flow cytometry was used to enumerate (g) activated CD4+ T cells, (h) activated CD4+ Tfh-like cells, (i) IL17+ CD4+ Tfh-like cells and (j) IFNγ+ CD4+ Tfh-like cells in the lungs. Data represents mean ± SD, and statistical analyses performed using two-sided unpaired t-test. *, p≤0.05; **,p≤0.005.
Extended Data Fig 6.
Extended Data Fig 6.. Strategic positioning of PD1+ Tfh-like cells within GrALT structures mediates Mtb control.
(a) Average area of GrALT collated from all mouse models (n = 3–10 mice/group) used in studies at 50 dpi and 128 dpi. (b) Representative images from FFPE lung sections stained with CD3 (red), PD-1 (green) and CD45R/B220 (white) in indicated models at 50 or 128 dpi. Data represent mean ± SD and statistical analysis was performed using one-way ANOVA with Tukey’s multiple comparison test (3 groups), and two-tailed unpaired t-test (2 groups). *, p≤0.05; **,p≤0.005.
Extended data Fig 7.
Extended data Fig 7.. Mtb 16sRNA is located outside GrALT areas and Pd1+ T cells are critical to control Mtb in mice.
FFPE lungs sections from Mtb-infected B6 and gene deficient mice were stained for the presence of Mtb 16S rRNA via in situ hybridization (ISH) at (a) 30, 50, and 75 dpi. FFPE lungs sections from Rag1KO Mtb-infected mice that either received WT T cells:WT B cells or Pd1KO T cells:WT B cells, were stained for (b) the presence of Mtb 16S rRNA via in situ hybridization (ISH) at 30 dpi, (c) presence of GrALT via immunofluorescence; CD3 (red); B220 (white); PD-1 (green).
Extended data Fig 8.
Extended data Fig 8.. Compromised accumulation of Tfh-like cells in macaques and mice lungs dampens vaccine mediated protection against Mtb.
Macaques were aerosol exposed to MtbΔsigH prior to challenge with virulent Mtb CDC1551 and received either CD20 depleting (n = 4 NHPs) or IgG isotype control antibodies (n = 2 NHPs). Clinical samples were collected throughout the study and at necropsy. (a) FACS profiles for detection of B cells in PBMCs (left panel), BAL (middle panel), and lung (right panels) in CD20-depleted (upper panels) and control macaques (lower panels). (b) The percentage of total peripheral blood B cells (flow cytometry) and (c) Levels of C-reactive protein (CRP) were determined from samples collected throughout the study. (d) FACS profile for detection of T cell subsets in macaque lungs. (e) ESAT6+ CD4+ T cells producing IFNγ, IL2, IL17 and TNFα in lung tissue were enumerated by flow cytometry at the final end-point. (f) CFP-10 specific antibody levels in serum (diluted 1:15) collected at indicated time points. Data represent mean ± SD and statistical analysis was performed with two-sided Mann-Whitney U-test. ***, p≤0.0005. Bcl6fl/fl and CD4creBcl6fl/fl mice (n = 4 to 7 mice/group) were mucosally vaccinated with BCG and rested for thirty days following which mice were infected with Mtb HN878. Mice were euthanized at 20 dpi. (g) Experimental scheme. Lungs were collected and bacterial burden was determined in (h) Bcl6fl/fl and CD4creBcl6fl/fl mice. Data represent mean ± SD and statistical analysis was performed with two-sided unpaired t-test. **, p≤0.005.
Extended data Fig 9.
Extended data Fig 9.. Gating strategy for B cells and T cells flow-cytometric analysis.
Representative FACS plots with gates defining (a) total B cells, GC B cells, and FO B cells, and (b) CD4 T cells, cytokine producing Th1 cells, Tfh-like cells and cytokine producing Tfh-like cells.
Extended data Fig 10.
Extended data Fig 10.. Graphical abstract: Mtb specific B cells and Tfh-like cells interact to mediate protection against Mtb.
B cell effector functions including formation of GC B cells, IL-10 production and antibody/plasma cells have non-essential roles during in vivo Mtb infection. However, Mtb antigen-specific B cells interact with Tfh-like cells likely through PDL1-PD1 to drive differentiation and effective localization of cytokine-producing Tfh-like cells within GrALT to mediate Mtb control (left). Key transcription factors Irf4 and Bcl6 (blue text) are essential for differentiation of Tfh-like cells from naive CD4+ T cells. PD1-PDL1 (blue text) receptor-ligand axis likely drive Tfh-like cell localization and homing into GrALT but this interaction is independent of TCR-MHCII interaction, IL-10 production or antibody response (black text). Thus, Tfh-like cells and B cell interactions play critical roles in mediating Mtb control within GrALT.
Figure 1.
Figure 1.. Analysis of IRF4 expression in animal models and in human TB.
(a) Forest plot showing IRF4 expression in whole blood transcriptome of human active TB patients (n = 10) in comparison to healthy controls with (n = 8) or without (n = 2) Mtb infection (Table S1). (b) Swarm plot showing relative IRF4 mRNA expression following ESAT6/CFP10-stimulation of purified human T cells from ATB and LTBI donors, data is normalized to unstimulated values (n = 85 ATB and 112 LTBI). Data was analyzed using two-sided t-test, unequal variance. p-values represent significance of differential expression according to DEseq. (c) Representative IF images of lung lesion from patients with ATB (n = 1 male; 72 years of age and 1 female; 51 years of age) show IRF4+CD3+CD4+ T cells; CD3-red, CD4-green, IRF4-white. Graph shows total number of CD3+CD4+ T cells counted and the number of IRF4+ cells among them. Data represents mean ± SD, with two-sided unpaired t-test used to compare groups. (d) MUM1/IRF4 (ID: ENSMUSG00000020156) mRNA levels in NHP lungs (ATB, n=8 and LTBI, n= 4) determined via bulk RNA-seq analysis. (c-d) Data represents mean ± SD, with two-sided unpaired t-test used to compare groups. (e) Correlation between log10 CFU vs MUM1/IRF4 mRNA levels in the lungs of NHP ATB (n = 8), LTBI (n = 4) and naïve (n=4). (f) IRF4 expression by CD4+ T cells sorted from lungs of Mtb-infected C57BL/6 mice, incubated with or without ESAT6/CFP10 peptide (n = 3). FPKM normalization was performed in order to plot the data. DESeq2 was used to calculate significance of differential expression between each of the sample groups. The significance of the Pearson correlation values was tested using a two-tailed t-distribution test with degrees of freedom equal to n – 2. (g) scRNA-seq of cells isolated from the lungs of B6 mice, either uninfected (n = 2), or Mtb-infected at 50 dpi (n = 3) or 100 dpi (n = 3), swarm plot showing expression of Irf4 in CD4+, CD8+ T and B cells. Swarm plot was prepared using the “boxplot” R function and the “beeswarm” R package. The boxed area indicates the interquartile range (IQR) of the data; values below are the lowest 25% of data points, and values above are the highest 25% of data points. The thick black line in the center indicates the median value, and the whiskers extend to the minima and maxima data values, excluding outliers. Outliers are defined as any points 1.5 x IQR above the 3rd quartile or 1.5 x IQR below the 1st quartile (b and f). *, p≤0.05; **,p≤0.005; ***, p≤0.0005.
Figure 2.
Figure 2.. Irf4 expression in T cells is indispensable for Mtb control.
CD4creIrf4fl/fl, CD19creIrf4fl/fl and Irf4fl/fl mice were infected with Mtb HN878 and were euthanized at indicated timepoints. (a) Experimental scheme. (b) Bacterial burden was determined in the lungs of CD4creIrf4fl/fl, CD19creIrf4fl/fl, and Irf4fl/fl mice. Formalin-fixed lung lobes were sectioned and stained with H&E and immunofluorescence to analyze (c) inflammation (average area) and (d) average area of GrALT. (e) CD4creIrf4fl/fl, CD19creIrf4fl/fl and Irf4fl/fl mice were monitored over 75 dpi for disease severity and to enumerate (f) activated CD4+ T cells, (g) IFNγ-producing CD4+ T cells, (h) IL-17-producing CD4+ T cells, (i) CD4+ T cells co-producing IFNγ and TNFα, and (j) CXCR5+ CD4+ T cells by flow cytometry. (k) The mice lungs were assessed for the presence of CXCR5+Bcl6+CD4+ T cells at 14 and 30 dpi. Data represents the mean ± SD, analysis was performed using one-way ANOVA with Tukey’s multiple comparison test (b and f to k), and Kruskal-Wallis ANOVA with Dunn’s multiple comparison test (c and d). Survival between CD4creIrf4fl/fl, CD19creIrf4fl/fl and Irf4fl/fl mice post-infection were compared using the Mantel-Cox test (e). *, p≤0.05; **,p≤0.005; ***, p≤0.0005; n = 4–10 mice/group (b to j) and 3–4 mice /group (k).
Figure 3.
Figure 3.. IRF4+ BCL6+ T cells increase during Mtb infection.
(a) Representative image of inflammatory lesion in lung of NHP LTBI (left) vs ATB (right) stained with antibodies specific for CD3 = white; IRF4 = green; PD1 = red. Circles with yellow dashed lines depict ectopic lymphoid structures and asterix = center of granuloma. The numbers of (b) IRF4+ CD3+ (n = 4 NHPs; 7–21 data points from different fields) and (c) only CD3+ (n=3 NHPs/ group) T cells in NHP ATB vs LTBI lung lesions were estimated by blinded morphometric analysis. (d) Correlation between the number of CD3+CD4+PD1+ Tfh-like cells inside B cell areas with the average area of the GrALT in the lungs of Mtb-infected NHPs (n = 5–6 NHPs/group). (e) Representative human ATB lesion, (f) number of T cells in human lung lesion expressing either PD1, IRF4 or both (n = 3 males and 1 female lung biopsies; age: 29–41 years). Data represents the mean ± SD. Statistical significance was determined with two-sided unpaired t-test (b and c), Pearson’s correlation (d) and Kruskal-Wallis ANOVA with Dunn’s post-hoc test (f). *, p≤0.05; **,p≤0.005; ***, p≤0.0005.
Figure 4.
Figure 4.. Tfh-like cells but not GC B cells mediate control of Mtb.
CD4creBcl6fl/fl and CD19creBcl6fl/fl mice were infected with Mtb HN878 alongside Bcl6fl/fl littermate controls (n = 3–9 mice/group), and lungs were collected and processed at indicated timepoints. (a) Experimental scheme. (b) Bacterial burden was determined in the lungs of CD4creBcl6fl/fl, CD19creBcl6fl/fl, and Bcl6fl/fl mice. Formalin-fixed lung lobes were cut and stained to analyze (c) inflammation (average area) and (d) average area of GrALT. (e) Survival of CD4creBcl6fl/fl, CD19creBcl6fl/fl and Bcl6fl/fl mice were monitored over time. CD4creBcl6fl/fl mice were infected with Mtb HN878 alongside Bcl6fl/fl littermate controls, and flow cytometry was used to enumerate (f) activated CD4+ T cells, (g) IFNγ+ CD4+ T cells, (h) TNFα+ CD4+ cells (i) activated CD4+ Tfh-like cells, (j) IFNγ+ CD4+ Tfh like cells and (k) TNFα+ CD4+ Tfh-like cells in the lungs at the indicated time points. Data represents mean ± SD, and statistical analyses performed using one-way ANOVA with Tukey’s multiple comparison test (b and d), Kruskal-Wallis ANOVA with Dunn’s post-hoc test (c), Mantel-Cox analysis assessing survival distributions between CD4creBcl6fl/fl and Bcl6fl/fl mice post-infection (e), two-sided unpaired t-test (f to k). *, p≤0.05; **,p≤0.005; ***, p≤0.0005.
Figure 5.
Figure 5.. Dispensable B cell effector functions in Mtb control.
Conditional B cell knock-out mice and littermate controls were infected with Mtb HN878 (n = 4–10 mice/group). Lungs were collected and processed at the indicated time points. CD19cre mice were crossed with iABfl/fl mice to generate CD19creiABfl/fl mice (MHC-II deficient B cells). (a) Experimental scheme, (b) bacterial burden, (c) average area of inflammation and (d) average area of GrALT are shown. CD19cre mice were crossed with Blimp1fl/fl mice to generate CD19creBlimp1fl/fl mice, and the (e) experimental scheme, (f) bacterial burden, (g) average area of inflammation and (h) average area of GrALT are shown. CD19cre mice were crossed with Il-10fl/fl mice to generate CD19creIl-10fl/fl mice, and the (i) experimental scheme, (j) bacterial burden, (k) average area of inflammation and (l) average area of GrALT are shown. Data represents mean ± SD, and statistical analyses were performed using two-sided unpaired t-test. *, p≤0.05.
Figure 6.
Figure 6.. Mtb-specific B cells control chronic Mtb infection.
IghelMD4 mice were infected with Mtb HN878 alongside controls (n = 3–10 mice/group). Lungs were collected and processed at indicated timepoints. (a) Bacterial burden was determined in the lungs. Formalin-fixed lung lobes were sectioned and stained to analyze (b) average area of inflammation and (c) average area of GrALT. (d) Activated CD4+ Tfh-like cells, (e) IFNγ+CD4+Tfh-like cells, and (f) TNFα+CD4+ Tfh-like cells were enumerated by flow cytometry. IghelMD4 mice were infected with Mtb HN878 alongside controls (n = 3–10 mice/group). B cells were isolated from the lungs of Mtb-infected C57BL/6 mice and transferred to IghelMD4 mice (100 dpi). C57BL/6, IghelMD4 and IghelMD4 mice receiving B cells were euthanized at 128 dpi (28 days after transfer) and the lungs were collected and processed. (g) Experimental scheme. Formalin-fixed lung lobes were sectioned and stained with H&E and immunofluorescence to analyze the (h) average area of inflammation, (i) average area of GrALT, and (j) GrALT area containing Mtb. Data represents the mean ± SD. Statistical significance was calculated with unpaired t-test (a to e), one-way ANOVA with Tukey’s multiple comparison test (j and h), Kruskal-Wallis ANOVA with Dunn’s multiple comparison test (i) and Mann-Whitney U test (f and i (red star)). *, p≤0.05; **,p≤0.005; ***, p≤0.0005.
Figure 7.
Figure 7.. PD1+ Tfh-like cells localize within GrALT for Mtb control.
Irf4fl/fl, CD4creIrf4fl/fl, CD19creIrf4fl/fl, Bcl6fl/fl, CD4creBcl6fl/fl, CD19creBcl6fl/fl, iABfl/fl, CD19creiABfl/fl, Blimp1fl/fl, CD19creBlimp1fl/fl, Il10fl/fl, CD19creIl10fl/fl, C57BL/6 and IghelMD4 mice were infected with Mtb HN878 (n = 3–10 mice/group). Lungs were collected and processed at 50 dpi. Mtb-infected B6, IghelMD4 and IghelMD4 (recipient) mice were euthanized, and lungs were collected and processed at 128 dpi. Formalin-fixed lung lobes were sectioned and stained with immunofluorescent antibodies to determine the (a) percentage of PD1+CD3+ Tfh-like cells within B cell areas. Uninfected or Mtb-infected (30 dpi) C57BL/6 mice (n = 5 mice/group) were euthanized, and lung cells were subjected to flow cytometric analysis for PD-L1 (CD247) expression on (b) total B cells and (c) FO B cells. B cells isolated from the spleens and lymph nodes of C57BL/6 mice and T cells isolated from the spleens and lymph nodes of either C57BL/6 or Pd1KO mice were co-transferred to Rag1KO mice, 1–2 days prior to infection with Mtb HN878 (n = 4–5 mice/group). Mice were euthanized 30 dpi. (d) Experimental scheme. (e) activated CD4+ T cells, (f) CD4+ Tfh-like cells (g) IFNγ+CD4+ Tfh-like cells and (h) IFNγ mean fluorescent intensity in activated CD4+ T cells in the lungs were determined by flow cytometry. Uninfected or Mtb-infected C57Bl/6 mice were euthanized (30 dpi) to collect lung (n = 5 mice/group) and mediastinal lymph node (MLN) (n = 4 mice/group). (i) Activated CD4+ T cells, (j) CD4+IFNγ+ T cells in both MLN and lungs; (k) Tfh like cells; MFIs for transcription factors (l) Tbet and (m) Bcl6 in both MLN and lungs activated CD4+ T cells were determined by flow cytometry. Data represents mean ± SD. Statistical significance was calculated with one-way ANOVA with Tukey’s multiple comparison test for group of three and two-sided unpaired t-test for group of two (a-c and e-h), and two-sided Mann-Whitney U-test (i to m). *, p≤0.05; **,p≤0.005; ***, p≤0.0005.
Figure 8.
Figure 8.. B cells mediate control in MtbΔsigH-vaccinated macaques.
Macaques were aerosol exposed to MtbΔsigH prior to challenge with virulent Mtb CDC1551 and received either CD20 depleting (n = 4 NHP) or IgG isotype control antibodies (n = 2 NHP). Clinical samples were collected, and macaques were monitored for clinical signs of disease throughout the study. (a) Experimental scheme. Bacterial burden was determined in (b) bulk lung tissue and (c) individual granulomas at necropsy. (d) CXCR5+CD4+ T cells, and (e) PD1+CD4+ T cells were detected by flow cytometry at the time of necropsy. (f) Representative images of a B cell follicle in lungs of a macaque which received IgG control isotype antibodies (top panels) and images of lung tissue from a macaque which received CD20 depleting antibodies (bottom panels); CD3-red, PD1-green, BCL6-white; dotted yellow line indicate germinal center, white arrows indicate CD3+BCL6+PD1+ Tfh-like cells, orange asterix indicates the bronchus. (g) The number of BCL6+ Tfh-like cells with the GrALT. Data represents mean ± SD. Statistical significance was calculated with tow-sided Mann-Whitney U-test (b to e); no statistics calculated as anti-CD20 treated NHP had all ‘zero’ values (g). *, p≤0.05, ***, p≤0.0005.

References

    1. WHO. Global Tuberculosis Report (2020).
    1. Scott NR, Swanson RV, Al-Hammadi N, Domingo-Gonzalez R, Rangel-Moreno J, Kriel BA, Bucsan AN, Das S, Ahmed M, Mehra S, Treerat P, Cruz-Lagunas A, Jimenez-Alvarez L, Muñoz-Torrico M, Bobadilla-Lozoya K, Vogl T, Walzl G, du Plessis N, Kaushal D, Scriba TJ, Zúñiga J, Khader SA S100A8/A9 regulates CD11b expression and neutrophil recruitment during chronic tuberculosis. J Clin Invest 130, 3098–3112 (2020). - PMC - PubMed
    1. Slight SR, Rangel-Moreno J, Gopal R, Lin Y, Fallert Junecko BA, Mehra S, Selman M, Becerril-Villanueva E, Baquera-Heredia J, Pavon L, Kaushal D, Reinhart TA, Randall TD, Khader SA CXCR5⁺ T helper cells mediate protective immunity against tuberculosis. J. Clin. Invest. 123, 712–726 (2013). - PMC - PubMed
    1. Esaulova E, Das S, Singh DK, Choreño-Parra JA, Swain A, Arthur L, Rangel-Moreno J, Ahmed M, Singh B, Gupta A, Fernández-López LA, de la Luz Garcia-Hernandez M, Bucsan A, Moodley C, Mehra S, García-Latorre E, Zuniga J, Atkinson J, Kaushal D, Artyomov MN, Khader SA The immune landscape in tuberculosis reveals populations linked to disease and latency. Cell Host Microbe 29, 165–178 e168 (2021). - PMC - PubMed
    1. Ahmed M, Thirunavukkarasu S, Rosa BA, Thomas KA, Das S, Rangel-Moreno J, Lu L, Mehra S, Mbandi SK, Thackray LB, Diamond MS, Murphy KM, Means T, Martin J, Kaushal D, Scriba TJ, Mitreva M, Khader SA Immune correlates of tuberculosis disease and risk translate across species. Sci Transl Med 12, 528 eaay0233 (2020). - PMC - PubMed

Methods References.

    1. Haynes WA, Vallania F, Liu C, Bongen E, Tomczak A, Andres-Terrè M, Lofgren S, Tam A, Deisseroth CA, Li MD, Sweeney TE, Khatri P. Empowering Multi-Cohort Gene Expression Analysis to Increase Reproducibility. Pac Symp Biocomput. 22, 144–153 (2016). - PMC - PubMed
    1. Khader SA, Bell GK, Pearl JE, Fountain JJ, Rangel-Moreno J, Cilley GE, Shen F, Eaton SM, Gaffen SL, Swain SL, Locksley RM, Haynes L, Randall TD, Cooper AM. IL-23 and IL-17 in the establishment of protective pulmonary CD4+ T cell responses after vaccination and during Mycobacterium tuberculosis challenge. Nat Immunol 8, 369–377 (2007). - PubMed
    1. Zak DE, Penn-Nicholson A, Scriba TJ, Thompson E, Suliman S, Amon LM, Mahomed H, Erasmus M, Whatney W, Hussey GD, Abrahams D, Kafaar F, Hawkridge T, Verver S, Hughes EJ, Ota M, Sutherland J, Howe R, Dockrell HM, Boom WH, Thiel B, Ottenhoff THM, Mayanja-Kizza H, Crampin AC, Downing K, Hatherill M, Valvo J, Shankar S, Parida SK, Kaufmann SHE, Walzl G, Aderem A, Hanekom WA; ACS and GC6–74 cohort study groups. A blood RNA signature for tuberculosis disease risk: a prospective cohort study. The Lancet 387, 2312–2322 (2016). - PMC - PubMed
    1. Mahomed H, Hawkridge T, Verver S, Geiter L, Hatherill M, Abrahams DA, Ehrlich R, Hanekom WA, Hussey GD; SATVI Adolescent Study Team. Predictive factors for latent tuberculosis infection among adolescents in a high-burden area in South Africa. Int J Tuberc Lung Dis 15, 331–336 (2011). - PubMed
    1. Zerbino DR, Achuthan P, Akanni W, Amode MR, Barrell D, Bhai J, Billis K, Cummins C, Gall A, Girón CG, Gil L, Gordon L, Haggerty L, Haskell E, Hourlier T, Izuogu OG, Janacek SH, Juettemann T, To JK, Laird MR, Lavidas I, Liu Z, Loveland JE, Maurel T, McLaren W, Moore B, Mudge J, Murphy DN, Newman V, Nuhn M, Ogeh D, Ong CK, Parker A, Patricio M, Riat HS, Schuilenburg H, Sheppard D, Sparrow H, Taylor K, Thormann A, Vullo A, Walts B, Zadissa A, Frankish A, Hunt SE, Kostadima M, Langridge N, Martin FJ, Muffato M, Perry E, Ruffier M, Staines DM, Trevanion SJ, Aken BL, Cunningham F, Yates A, Flicek P. Ensembl 2018. Nucleic Acids Res 46, D754–D761 (2018). - PMC - PubMed

Publication types

Substances