. 2022 Jan 29;10(1):254-266.
doi: 10.1016/j.gendis.2021.12.016. eCollection 2023 Jan.

LOX upregulates FAK phosphorylation to promote metastasis in osteosarcoma

Affiliations

LOX upregulates FAK phosphorylation to promote metastasis in osteosarcoma

Xiang Chen et al. Genes Dis. .

Abstract

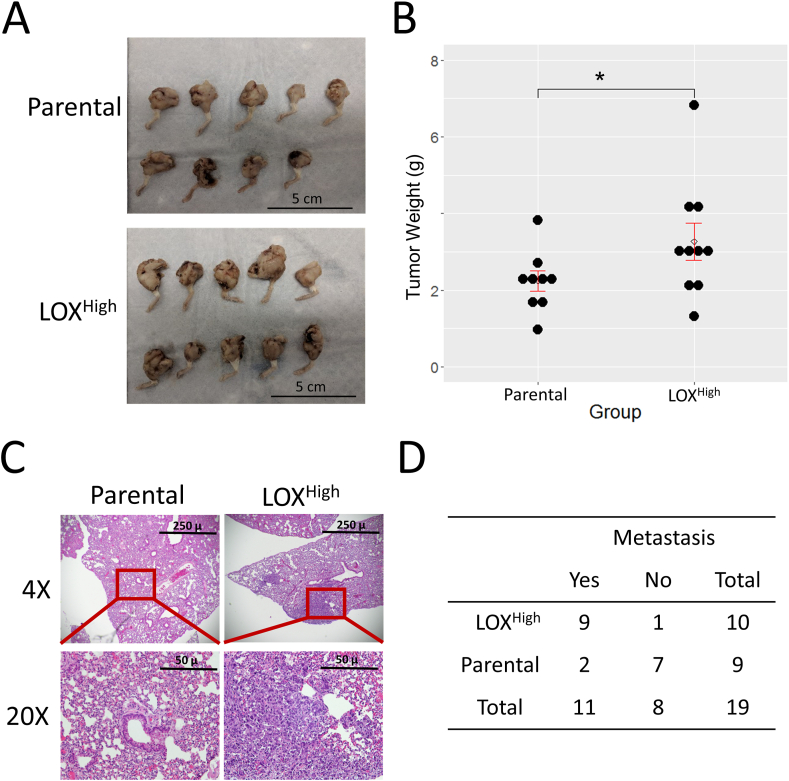
Osteosarcoma is a malignant bone tumor that commonly occurs in the pediatric population. Despite the use of chemotherapy and surgery, metastasis remains to be the leading cause of death in patients with osteosarcoma. We have previously reported that cytoplasmic mislocalization of p27 is associated with a poor outcome in osteosarcoma. In this study, we further show that lysyl oxidase (LOX) expression was associated with p27 mislocalization. LOX is an enigmatic molecule that acts as a tumor suppressor or a metastatic promoter; however, its role in osteosarcoma is still unclear. Hence, we performed both in vitro and in vivo analyses to dissect the role of LOX in osteosarcoma. The result of our survival analysis indicated that LOX expression significantly correlated with a poor outcome in osteosarcoma with or without controlling for the initial metastasis status (P < 0.05). Functionally, we found that higher LOX expression promoted osteosarcoma cell proliferation, migration, and invasiveness in vitro and produced a higher number of mice with pulmonary metastases in an orthotopic xenograft mouse model. Mechanistically, phospho-FAK was increased in osteosarcoma cells with high LOX expression. Our results further showed that FAK inhibition significantly reduced tumor cell proliferation and migration in vitro as well as LOX-mediated metastasis in mice. Together, our findings suggest that there is a novel link between p27 mislocalization and LOX expression. LOX plays a pivotal role in osteosarcoma metastasis by upregulating FAK phosphorylation. FAK inhibition may constitute a promising therapeutic strategy to reduce the development of metastasis in osteosarcoma with LOX overexpression.

Keywords: Focal adhesion kinase; Lysyl oxidase; Metastasis; Osteosarcoma.


Figures

Figure 1
Figure 1
LOX expression correlates with cytoplasmic p27 expression in OS cells. (A) Western blotting of LOX in an OS cell line with (NES-p27) and without (Empty) cytoplasmic p27 as previously described. (B) Representative images of high- and low-staining of LOX (upper panel) and p27 (lower panel) of the same tumor cores in the OS tissue array (20X). (C) Pie charts showing the score distribution of cytoplasmic p27 and LOX staining in TMA. The staining scores represent the following, Intensity: 0 - Trace (background, minimal), 1 - Weak, 2 - Moderate, 3 - Strong; Proportion: 0 - <1% of cell population stained, 1 - 1–25% of cell population stained, 2 - >25–50% of cell population stained, 3 - >50–75% of cell population stained, 4 - >75% of cell population stained. (D) Box plots showing the correlation of LOX and p27 staining in the OS tissue microarray. The staining scores of LOX (y-axis) are plotted against the p27 staining score groups (x-axis) of the OS cases (left: intensity; right: proportion). The darker horizontal line within the box denotes the median value of LOX staining scores. The lower and upper limits of the box represent the 1st and 3rd quartiles of the scores. Whiskers indicate the maximum or minimum values of staining scores and the circles denote outlier scores.
Figure 2
Figure 2
Kapan-Meier survival analyses in OS patients from the TARGET consortium. (A) The overall survival of OS patients based on the RNAseq data. (B) The overall survival of OS patients based on RNA expression profiling data. (C) The event-free survival of OS patients based on the RNAseq data. (D) The event-free survival of OS patients based on RNA expression profiling data. The survival curves are stratified using the 3rd quartile of LOX expression as a cut-off.
Figure 3
Figure 3
LOX expression promotes OS cell proliferation, migration, and invasion. (A) Western blotting of LOX in five commonly used OS cell lines. GAPDH is used as a loading control. (B) Western blotting of LOX and phospho-FAKY397 in two high LOX mutants (LOXHigh) and their parental cell lines (Parental). (C) Growth curves of high LOX mutants and their respective parental cell lines. Five wells per cell line were measured; error bars represent standard deviations of the replicates. Experiments were replicated three times with similar results. (D) Representative images of the cell comb scratch assays of the LOXhigh mutants and their respective parental cell lines at 0 and 24 h after scratches were initiated. Red dash lines indicate the front of migrated cells. Experiments were replicated with similar results. (E) Representative images of the transwell invasion assays of the high LOX mutants and their respective parental cell lines (left) and quantification of the transwell invasion assays (right). Invaded cells were stained, counted, and averaged using ImageJ software in five random and independent microscopic fields (10X). The experiment was replicated three times with similar results. In the quantification, error bars and asterisks represent standard deviations and statistical significance (Student's t-test; ∗, P < 0.05; ∗∗, P < 0.01; ∗∗∗, P < 0.001, respectively).
Figure 4
Figure 4
LOX expression promotes tumor growth and lung metastasis in vivo. (A) Images of the primary tumors generated from the orthotopic injection of parental 143B (n = 9) and high LOX mutant cells (n = 10). (B) Scatterplot showing the measurement of tumor weights shown in A. The open circle denotes the average, and the upper and lower bars denote the standard errors of the weights. (C) Representative H&E staining (4X) of mouse lung sections from the 143B and high LOX mutant groups (upper panel). High magnification (20×) of the red rectangle areas in low magnification images (lower panel). (D) Table showing the numbers of mice with or without pulmonary metastases in the high LOX and parental groups (Fisher's exact test, P = 0.0049).
Figure 5
Figure 5
FAK knockdown reduces cell proliferation and migration but not invasion in the LOXhigh mutants. (A) Western blotting of phospho-FAKY397 in the FAK knockdown mutants of the 143B-LOXhigh and U2OS-LOXhigh mutants. GAPDH was used as a loading control. Two transfection doses (10 nM and 25 nM) were tested in each of the siRNA constructs. CTL referred to cells transfected with universal negative control particles (10 nM). The 10 nM dose was selected for subsequent functional assays. (B) Growth curve of the two FAK siRNA mutants and the negative controls (CTL) in the 143B-LOXHigh and U2OS-LOXHigh mutants. Five wells per cell line were measured; error bars represented standard deviations of replicates. Experiments were replicated three times with similar results. (C) Representative images of the cell comb scratch assays of the FAK siRNA mutants and their respective control cells (CTL) at 0 and 24 h after scratches were initiated. Red dash lines indicate the front of migrated cells. Experiments were replicated with similar results. (D) Representative images (left) and quantification (right) of the transwell invasion assays of the FAK siRNA mutants and their respective control cells. Invaded cells were stained, counted, and averaged using ImageJ software in five random and independent microscopic fields (10X). The experiment was replicated three times with similar results. In the quantification, error bars and asterisks represent standard deviations and statistical significance (Student's t-test; ∗, P < 0.05; ∗∗, P < 0.01; ∗∗∗, P < 0.001, respectively).
Figure 6
Figure 6
Small molecule FAK inhibitor reduces lung metastasis in the mice injected with LOXHigh cells. (A) Images of the primary tumors generated from orthotopically injected high LOX mutant cells treated with or without the FAK inhibitor. (B) Scatterplot showing the measurement of tumor weights shown in A. Open circle denotes the average, and the upper and lower bars denote the standard errors of the weights. (C) Representative H&E staining (4X) of mouse lung sections from the FAK inhibitor-treated and -untreated groups (upper panel). High magnification (20×) of the red rectangle areas in low magnification images (lower panel). (D) Table showing the numbers of mice with or without pulmonary metastases in the FAK inhibitor-treated and untreated groups (Fisher's exact test, P = 0.03). (E) A proposed model of the p27-LOX-FAK axis in OS metastasis.
figs1
figs1
figs2
figs2
figs3
figs3
figs4
figs4
figs5
figs5

References

    1. Link M.P., Eilber F. In: Principles and Practice of Pediatric Oncology. 3rd ed. Pizzo M.D., Poplack D.G., Adamson M.D., et al., editors. Lippincott-Raven Publishers; Philadelphia, PA: 1997. Osteosarcoma; pp. 889–920.
    1. Anderson M.E. Update on survival in osteosarcoma. Orthop Clin N Am. 2016;47(1):283–292. - PubMed
    1. Chen X., Cates J.M.M., Du Y.C., et al. Mislocalized cytoplasmic p27 activates PAK1-mediated metastasis and is a prognostic factor in osteosarcoma. Mol Oncol. 2020;14(4):846–864. - PMC - PubMed
    1. Li Y., Nakka M., Kelly A.J., et al. p27 is a candidate prognostic biomarker and metastatic promoter in osteosarcoma. Cancer Res. 2016;76(13):4002–4011. - PMC - PubMed
    1. Mäki J.M., Sormunen R., Lippo S., et al. Lysyl oxidase is essential for normal development and function of the respiratory system and for the integrity of elastic and collagen fibers in various tissues. Am J Pathol. 2005;167(4):927–936. - PMC - PubMed

LinkOut - more resources