Alteration in the number of neuronal and non-neuronal cells in mouse models of obesity
- PMID: 37013172
- PMCID: PMC10066574
- DOI: 10.1093/braincomms/fcad059
Alteration in the number of neuronal and non-neuronal cells in mouse models of obesity
Abstract
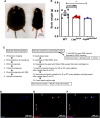
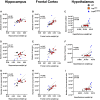
Obesity is defined as abnormal or excessive fat accumulation that may impair health and is a risk factor for developing other diseases, such as type 2 diabetes and cardiovascular disorder. Obesity is also associated with structural and functional alterations in the brain, and this condition has been shown to increase the risk of Alzheimer's disease. However, while obesity has been associated with neurodegenerative processes, its impact on brain cell composition remains to be determined. In the current study, we used the isotropic fractionator method to determine the absolute composition of neuronal and non-neuronal cells in different brain regions of the genetic mouse models of obesity Lepob/ob and LepRNull/Null . Our results show that 10- to 12-month-old female Lepob/ob and LepRNull/Null mice have reduced neuronal number and density in the hippocampus compared to C57BL/6 wild-type mice. Furthermore, LepRNull/Null mice have increased density of non-neuronal cells, mainly glial cells, in the hippocampus, frontal cortex and hypothalamus compared to wild-type or Lepob/ob mice, indicating enhanced inflammatory responses in different brain regions of the LepRNull/Null model. Collectively, our findings suggest that obesity might cause changes in brain cell composition that are associated with neurodegenerative and inflammatory processes in different brain regions of female mice.
Keywords: isotropic fractionator; neurodegeneration; neuroinflammation; neuronal loss; obesity.
© The Author(s) 2023. Published by Oxford University Press on behalf of the Guarantors of Brain.
Conflict of interest statement
The authors declare that they have no known competing financial interests or personal relationships that could have appeared to influence the work reported in this paper.
Figures


Similar articles
-
An allosteric antibody to the leptin receptor reduces body weight and reverses the diabetic phenotype in the Lep(ob) /Lep(ob) mouse.Obesity (Silver Spring). 2016 Aug;24(8):1687-94. doi: 10.1002/oby.21539. Epub 2016 Jun 21. Obesity (Silver Spring). 2016. PMID: 27330016
-
Heterozygosity for Lep(ob) or Lep(rdb) affects body composition and leptin homeostasis in adult mice.Am J Physiol. 1998 Apr;274(4):R985-90. doi: 10.1152/ajpregu.1998.274.4.R985. Am J Physiol. 1998. PMID: 9575960
-
Morphometric analysis of obesity (ob/ob)- and diabetes (db/db)-associated hypothalamic neuronal degeneration in C57BL/KsJ mice.Brain Res. 1989 Oct 30;501(1):162-70. doi: 10.1016/0006-8993(89)91037-8. Brain Res. 1989. PMID: 2804691
-
CRISPR-Cas9-mediated generation of obese and diabetic mouse models.Exp Anim. 2018 May 10;67(2):229-237. doi: 10.1538/expanim.17-0123. Epub 2018 Jan 16. Exp Anim. 2018. PMID: 29343656 Free PMC article.
-
The genetic basis of obesity-associated type 2 diabetes (diabesity) in polygenic mouse models.Mamm Genome. 2014 Oct;25(9-10):401-12. doi: 10.1007/s00335-014-9514-2. Epub 2014 Apr 22. Mamm Genome. 2014. PMID: 24752583 Free PMC article. Review.
Cited by
-
Leptin receptor reactivation restores brain function in early-life Lepr-deficient mice.Brain. 2024 Aug 1;147(8):2706-2717. doi: 10.1093/brain/awae127. Brain. 2024. PMID: 38650574 Free PMC article.
-
Inflammatory Pathways in Overweight and Obese Persons as a Potential Mechanism for Cognitive Impairment and Earlier Onset Alzeihmer's Dementia in the General Population: A Narrative Review.Biomedicines. 2023 Dec 6;11(12):3233. doi: 10.3390/biomedicines11123233. Biomedicines. 2023. PMID: 38137454 Free PMC article. Review.
-
Exploring the impact of lipid stress on sperm cytoskeleton: insights and prospects.Nat Rev Urol. 2025 May;22(5):294-312. doi: 10.1038/s41585-024-00952-1. Epub 2024 Nov 11. Nat Rev Urol. 2025. PMID: 39528754 Review.
-
Neuropsychiatric Abnormalities in Metabolic Disturbances: Interplay of Adipokines and Neurotransmission.Mol Neurobiol. 2025 Jul;62(7):8824-8842. doi: 10.1007/s12035-025-04797-6. Epub 2025 Mar 5. Mol Neurobiol. 2025. PMID: 40042730 Review.
-
Investigating the Interplay between Cardiovascular and Neurodegenerative Disease.Biology (Basel). 2024 Sep 26;13(10):764. doi: 10.3390/biology13100764. Biology (Basel). 2024. PMID: 39452073 Free PMC article. Review.
References
-
- McCafferty BJ, Hill JO, Gunn AJ. Obesity: Scope, lifestyle interventions, and medical management. Tech Vasc Interv Radiol. 2020;23(1):100653. - PubMed
-
- Peeters A, Barendregt JJ, Willekens F, et al. . Obesity in adulthood and its consequences for life expectancy: A life-table analysis. Ann Intern Med. 2003;138(1):24–32. - PubMed
-
- Blüher M. Obesity: Global epidemiology and pathogenesis. Nat Rev Endocrinol. 2019;15(5):288–298. - PubMed
LinkOut - more resources
Full Text Sources
Miscellaneous
