. 2023 Apr 3;21(1):70.
doi: 10.1186/s12915-023-01570-w.

Stress decreases spermatozoa quality and induces molecular alterations in zebrafish progeny

Affiliations

Stress decreases spermatozoa quality and induces molecular alterations in zebrafish progeny

David G Valcarce et al. BMC Biol. .

Abstract

Background: Chronic stress can produce a severe negative impact on health not only in the exposed individuals but also in their offspring. Indeed, chronic stress may be contributing to the current worldwide scenario of increasing infertility and decreasing gamete quality in human populations. Here, we evaluate the effect of chronic stress on behavior and male reproductive parameters in zebrafish. Our goal is to provide information on the impact that chronic stress has at molecular, histological, and physiological level in a vertebrate model species.

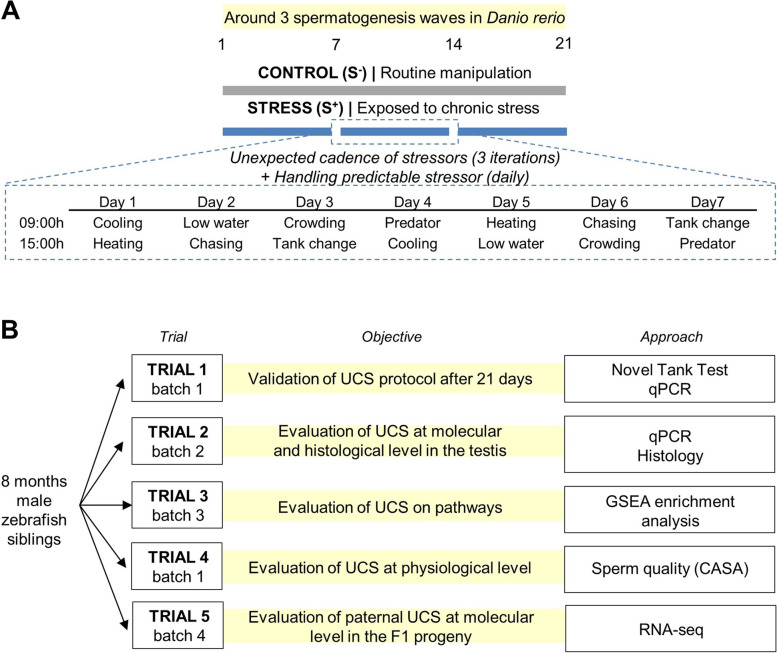
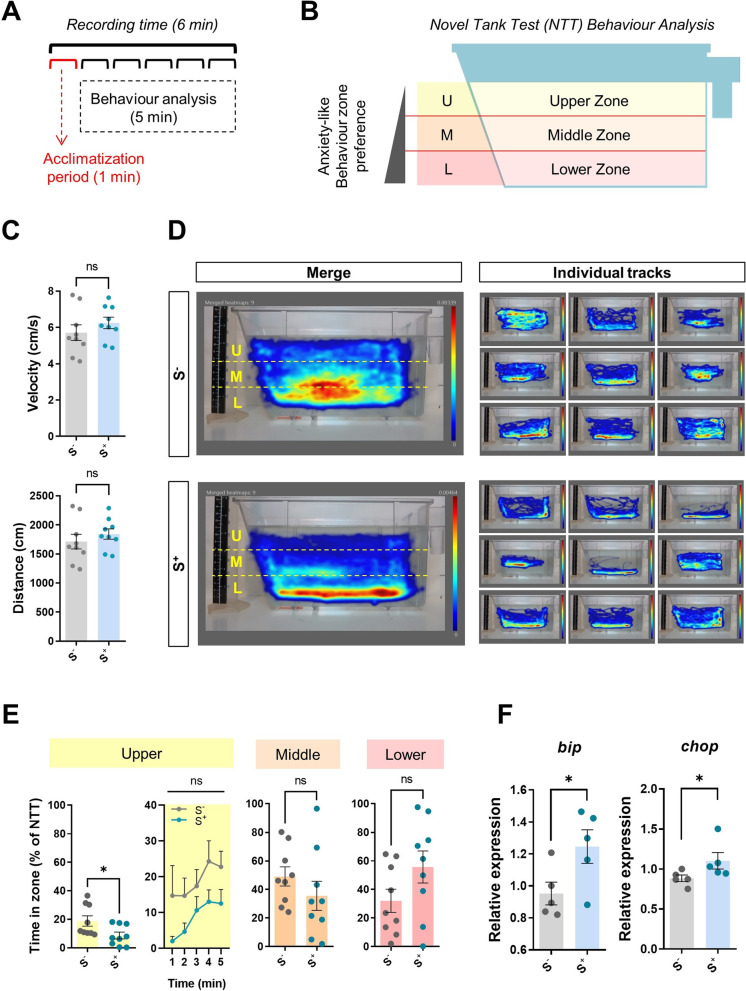
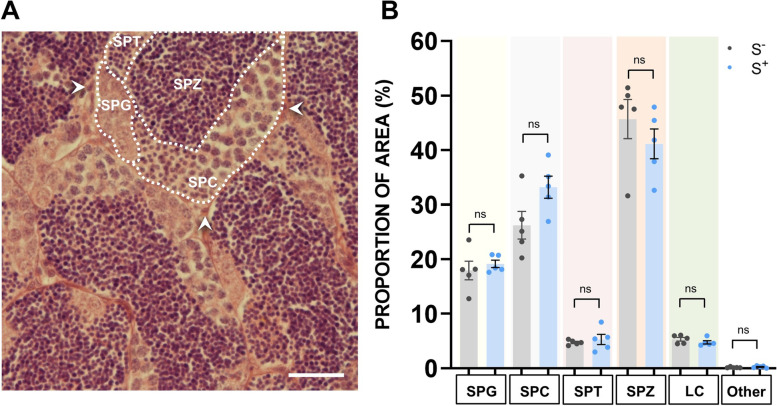
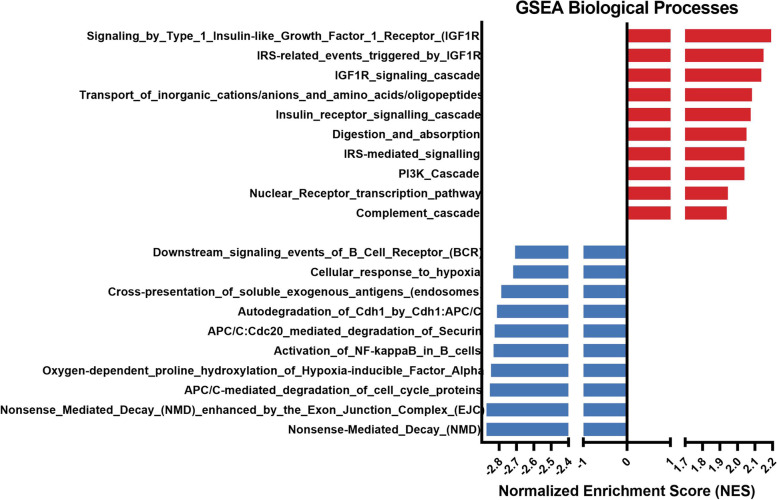
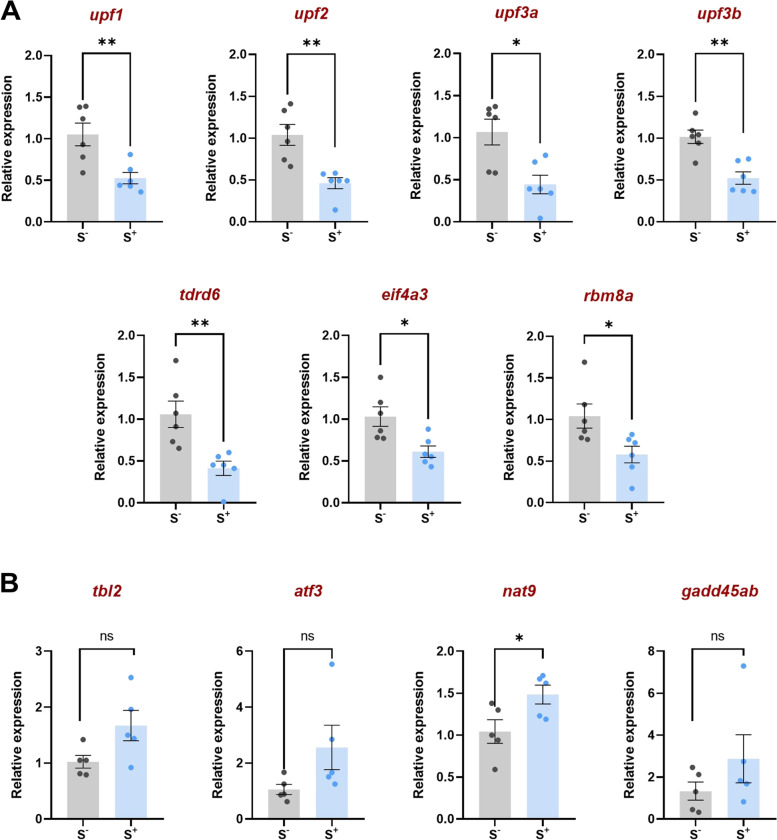
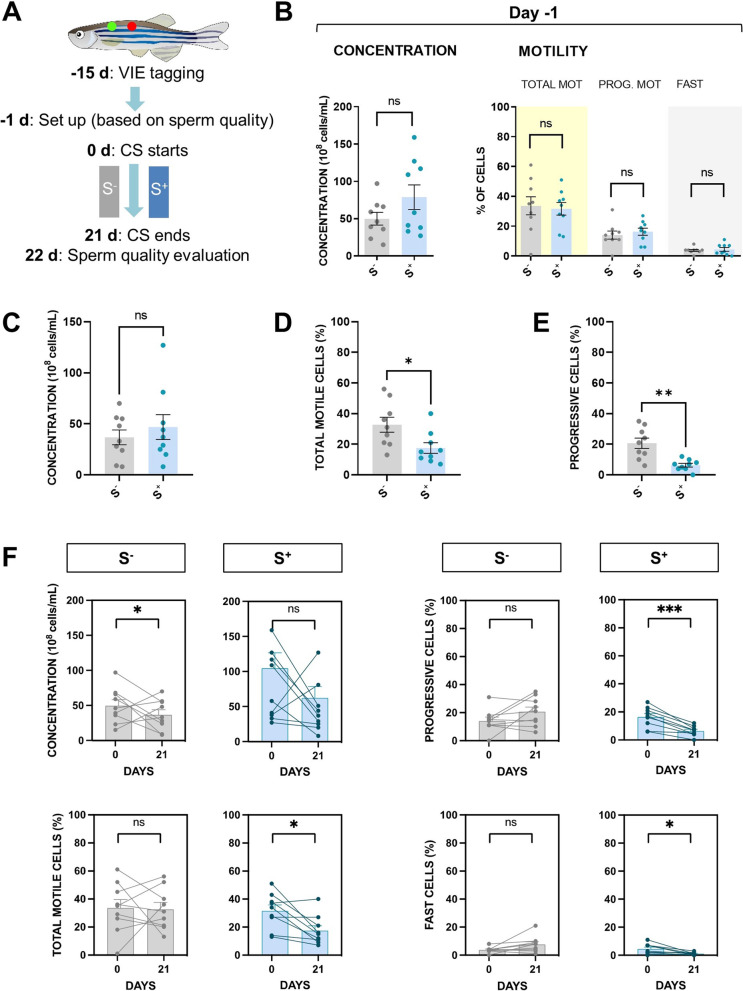
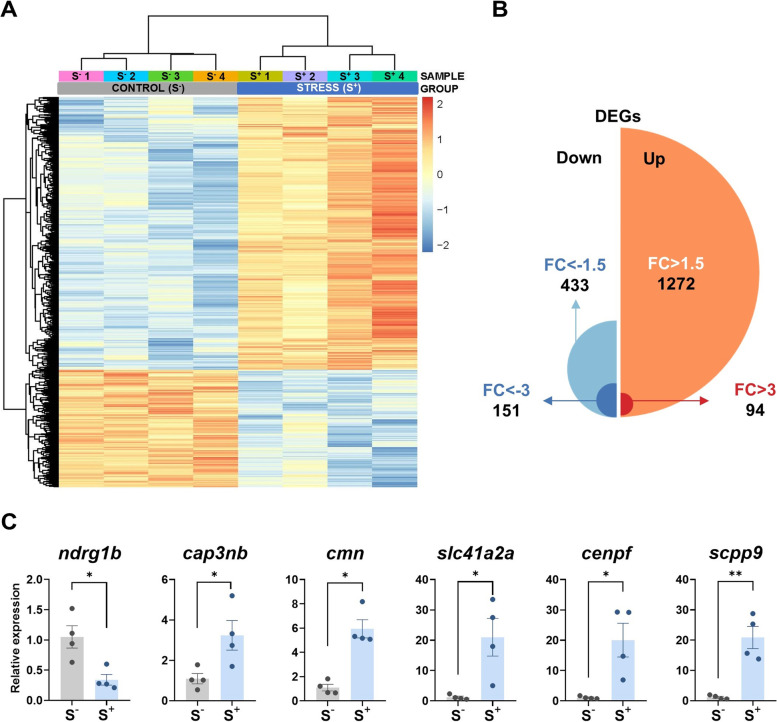
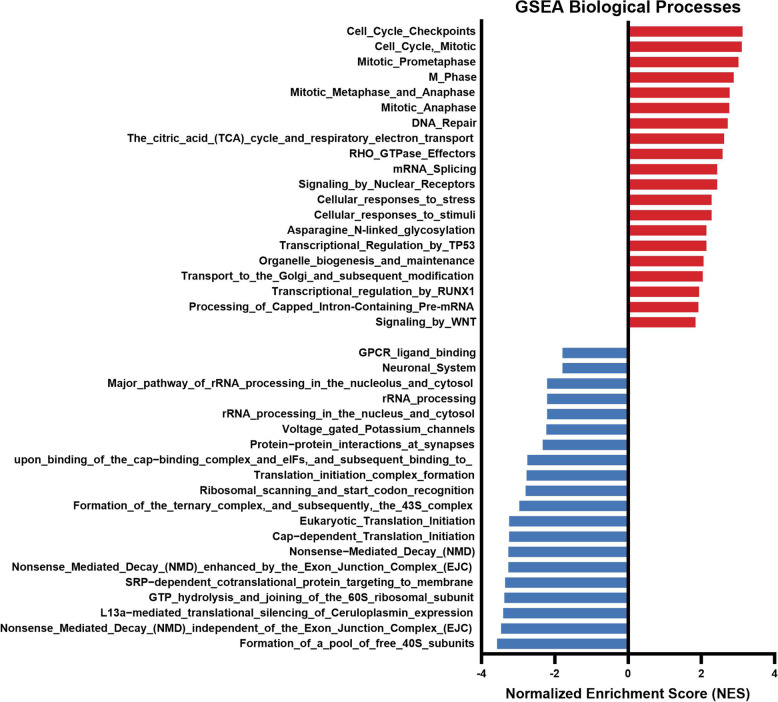
Results: We evaluated the effects of a 21-day chronic stress protocol covering around three full waves of spermatogenesis in Danio rerio adult males. The induction of chronic stress produced anxiety-like behavior in stressed males as assessed by a novel tank test. At a molecular level, the induction of chronic stress consistently resulted in the overexpression of two genes related to endoplasmic reticulum (ER) stress in the brain. Gene set enrichment analysis (GSEA) of testes suggested a dysregulation of the nonsense-mediated decay (NMD) pathway, which was also confirmed on qPCR analysis. Histological analysis of the testicle did not show significant differences in terms of the relative proportions of each germ-cell type; however, the quality of sperm from stressed males was compromised in terms of motility. RNA-seq analysis in stress-derived larval progenies revealed molecular alterations, including those predicted to affect translation initiation, DNA repair, cell cycle control, and response to stress.

Conclusions: Induction of chronic stress during a few cycles of spermatogenesis in the vertebrate zebrafish model affects behavior, gonadal gene expression, final gamete quality, and progeny. The NMD surveillance pathway (a key cellular mechanism that regulates the stability of both normal and mutant transcripts) is severely affected in the testes by chronic stress and therefore the control and regulation of RNAs during spermatogenesis may be affected altering the molecular status in the progeny.

Keywords: Chronic stress; NMD; Progeny; Sperm; Testis; Zebrafish.


Conflict of interest statement

The authors declare that they have no competing interests.

Figures

Fig. 1
Fig. 1
Experimental design. A Chronic stress (CS) protocol lasting 21 days to cover around three waves of spermatogenesis period in zebrafish. CS consisted of a predictable handling source of stress (twice per day) and a main body of unpredictable chronic stress (UCS). Each stressor included in the UCS was applied twice per week. Seven stressors were used in the UCS protocol: (1) cooling: 30 min in a tank at 23 °C; (2) heating: 30 min in a tank at 33 °C; (3) low water level: 2 min in a tank with extreme low water level exposing the dorsal body of the fish to the air; (4) chasing: 8 min of chasing with a net; (5) crowding: 50 min of crowding animals in a 250-mL beaker; (6) tank change: three consecutive relocations of the animals in a new tank after 30 min, and (7) predator: 50 min exposure to a video of the zebrafish predator Archocentrus nigrofasciatus. B Five trials performed to validate CS protocol (trial 1), perform molecular and histological analyses after CS protocol (trial 2), find altered pathways in the gonads after CS (trial 3), evaluate CS protocol at physiological level (trial 4), and analyze the molecular scenario in the derived progenies (trial 5). The fish batch used in each trial is codified by a number for easier interpretation of the experimental design (batch 1; batch 2, batch 3, and batch 4). CASA, computer-assisted sperm analysis
Fig. 2
Fig. 2
CS protocol validation. A Diagram of NTT experimental design (1-min acclimatization + 5-min evaluation). B Virtual zones (upper, middle, and lower) of evaluation area stablished with Noldus Ethovision® XT16 software. C Kinetic parameters: velocity (cm/s) and distance (cm). D Merge (n = 9) and individual heatmaps from both experimental groups showing the minimum amount of time an individual spent in each pixel in dark blue and the maximum in red. E Time spent by males in the upper, middle, and lower zones (%). F Relative gene expression in zebrafish brain of two genes involved in endoplasmic reticulum (ER) stress: bip and chop. S: control males. S+: males exposed to the chronic stress (CS) protocol. Data are presented as mean ± SEM (kinetics and preference data: n = 9; gene expression analysis: n = 5; fish batch 1). *p < 0.0500
Fig. 3
Fig. 3
Histological analysis. A Representative H&E histological field of testes sections from S and S+. SPG, spermatogonia; SPC, spermatocytes; SPT, spermatids; SPZ, spermatozoa; LC, Leydig cells; Other, other cell types. Scale bar: 25 μm. B Quantitative analysis of spermatogenesis. Proportion (%) of area occupied by cells in S and S+. S: control males. S+: males exposed to the CS protocol. Data are presented as mean ± SEM (n = 5; fish batch 2)
Fig. 4
Fig. 4
GSEA enrichment analysis in adult zebrafish testis tissue from males exposed to the CS protocol (fish batch 3). Normalized Enrichment Score (NES) was applied to correct differences in enrichment score between gene-sets due to differences in gene-set size
Fig. 5
Fig. 5
Relative gene expression in zebrafish testes of A Seven players involved in the nonsense mediated decay (NMD) pathway and B four substrates of the NMD pathway. S: control males. S+: males exposed to the CS protocol. Data are presented as mean ± SEM (n = 5–6; batch 2). *p < 0.0500, **p < 0.0100
Fig. 6
Fig. 6
CS effects on zebrafish males in terms of sperm quality after approximately three rounds of spermatogenesis exposure. A Trial 4 design summary. Males were individually tagged 15 days before the beginning of the trial using visible implant elastomers (VIE). One day before the beginning of the CS protocol, males were divided into in homogeneous groups in terms of sperm quality parameters. After the 21-day CS protocol, on day 22, sperm samples were processed to evaluate the effect of chronic stress in the S+ group. B Sperm concentration, total motility, progressive motility, and fast cells fraction of the groups at day − 1. Mean values of C cell concentration, D total motility (%), and E progressive motility (%) after the trial 4 conclusion. F Before–after graphs for the experimental groups S and S+ for the endpoints concentration, total motility, progressive motility, and fast cell subpopulation. S: control males. S+: males exposed to the CS protocol. Data are presented as mean ± SEM (n = 9; fish batch 1). *p < 0.0500, **p < 0.0100, ***p < 0.0010, ns, not significant (p > 0.0500)
Fig. 7
Fig. 7
RNA-seq analysis of zebrafish 7-dpf larvae (control and stressed). Stressed progenies (S+) were obtained from a control female crossed with a male exposed to the 21-day CS protocol. Control progenies (S) derived from a control unexposed male crossed with a control female. A Heatmap generated by unsupervised hierarchical clustering of RNAseq expression z-scores computed for the 1705 differentially expressed genes (DEGs) (cut-off criteria: p. adjusted < 0.0500; |FC| > 1.5) between S and S+ larvae. The heatmap was generated with the “pheatmap” R package (https://CRAN.R-project.org/package=pheatmap) (n = 4 progenies/treatment). B Representation of the 1705 DEGs (S+ vs S) detected by RNA-seq passing the stablished threshold identifying the number of upregulated and downregulated DEGs and classifying them by their FC. C Normalized gene expression obtained in the qPCR validation assay for the RNA-seq. Data in C are shown as mean ± SEM (*p < 0.0500; **p < 0.0100)
Fig. 8
Fig. 8
GSEA enrichment analysis considering biological processes of RNA-seq in zebrafish 7 dpf S+ progenies (derived from males exposed to the chronic stress protocol). Normalized enrichment score (NES) was applied to correct differences in enrichment score between gene-sets due to differences in gene-set size

Similar articles

Cited by

References

    1. Sullivan EA, Zegers-Hochschild F, Mansour R, Ishihara O, de Mouzon J, Nygren KG, et al. International Committee for Monitoring Assisted Reproductive Technologies (ICMART) world report: assisted reproductive technology 2004. Hum Reprod. 2013;28:1375–90. doi: 10.1093/humrep/det036. - DOI - PubMed
    1. World Health Organization . WHO Fact Sheet: Infertility. 2020.
    1. Thoma ME, McLain AC, Louis JF, King RB, Trumble AC, Sundaram R, et al. Prevalence of infertility in the United States as estimated by the current duration approach and a traditional constructed approach. Fertil Steril. 2013;99:1324–1331.e1. doi: 10.1016/j.fertnstert.2012.11.037. - DOI - PMC - PubMed
    1. Pfeifer S, Butts S, Dumesic D, Fossum G, Gracia C, La Barbera A, et al. Diagnostic evaluation of the infertile male: a committee opinion. Fertil Steril. 2015;103:e18–25. doi: 10.1016/j.fertnstert.2014.12.103. - DOI - PubMed
    1. Li Y, Lin H, Li Y, Cao J. Association between socio-psycho-behavioral factors and male semen quality: systematic review and meta-analyses. Fertil Steril. 2011;95:116–23. doi: 10.1016/j.fertnstert.2010.06.031. - DOI - PubMed

Publication types

LinkOut - more resources