. 2023 Apr 3;21(1):65.
doi: 10.1186/s12915-023-01568-4.

Plasmodium falciparum gametocytes display global chromatin remodelling during sexual differentiation

Affiliations

Plasmodium falciparum gametocytes display global chromatin remodelling during sexual differentiation

Myriam D Jeninga et al. BMC Biol. .

Abstract

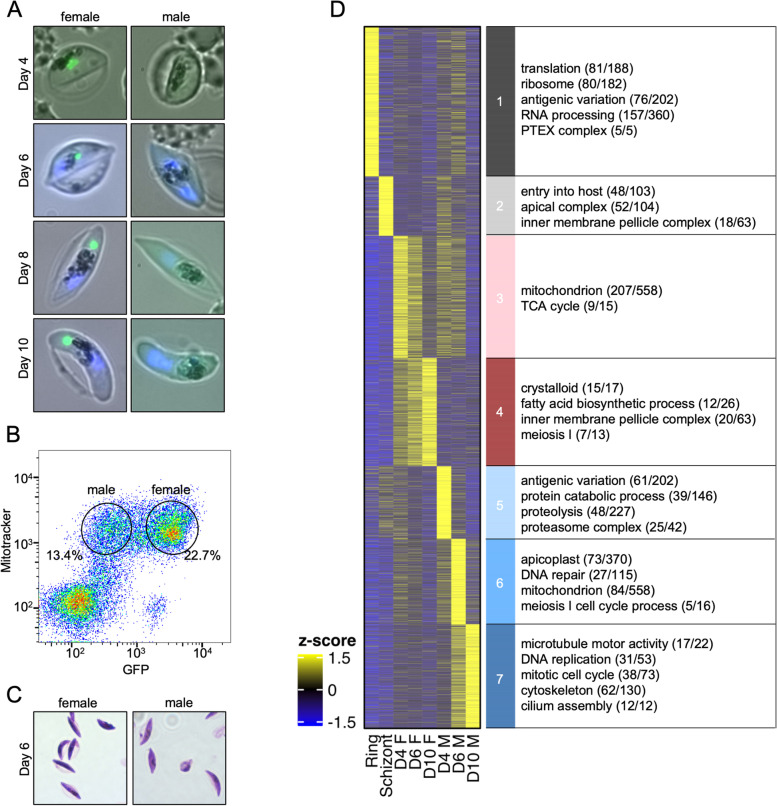
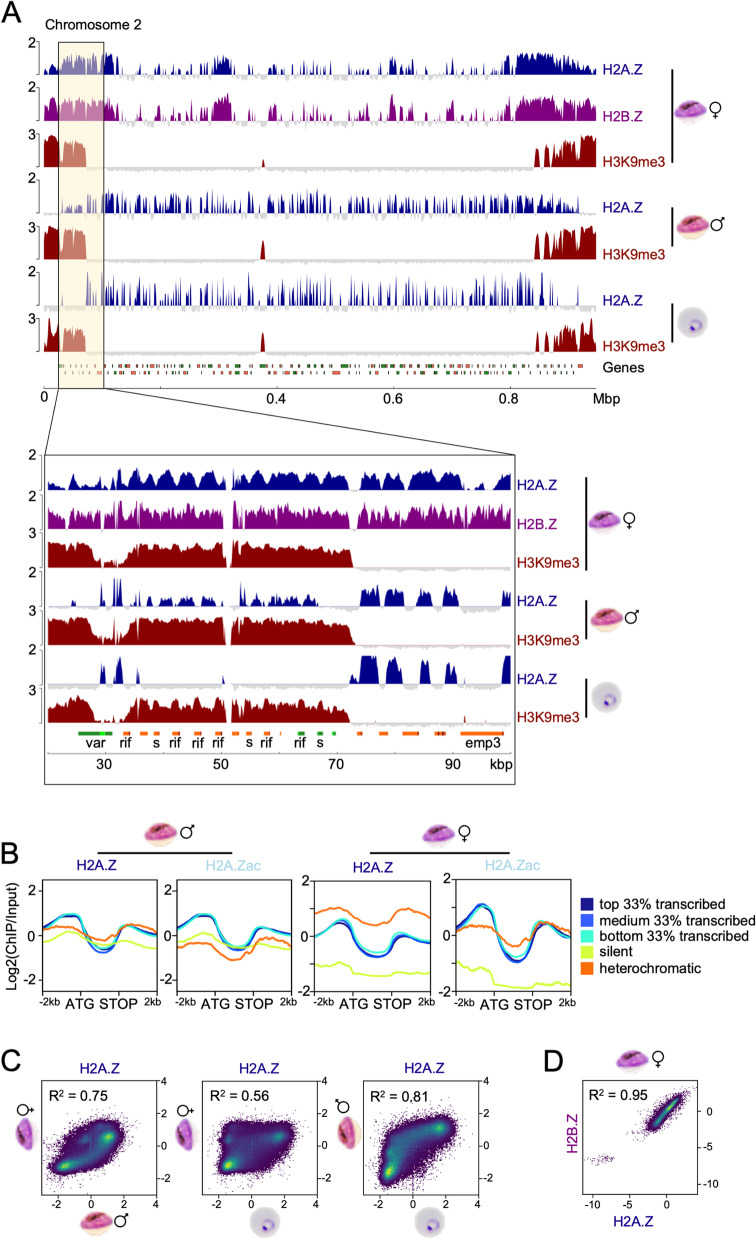
Background: The protozoan malaria parasite Plasmodium falciparum has a complex life cycle during which it needs to differentiate into multiple morphologically distinct life forms. A key process for transmission of the disease is the development of male and female gametocytes in the human blood, yet the mechanisms determining sexual dimorphism in these haploid, genetically identical sexual precursor cells remain largely unknown. To understand the epigenetic program underlying the differentiation of male and female gametocytes, we separated the two sexual forms by flow cytometry and performed RNAseq as well as comprehensive ChIPseq profiling of several histone variants and modifications.

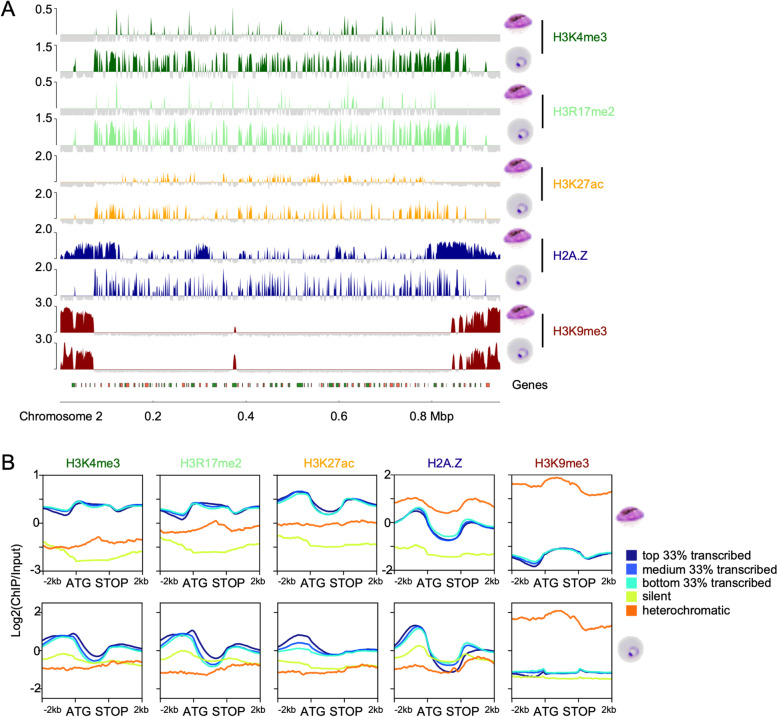
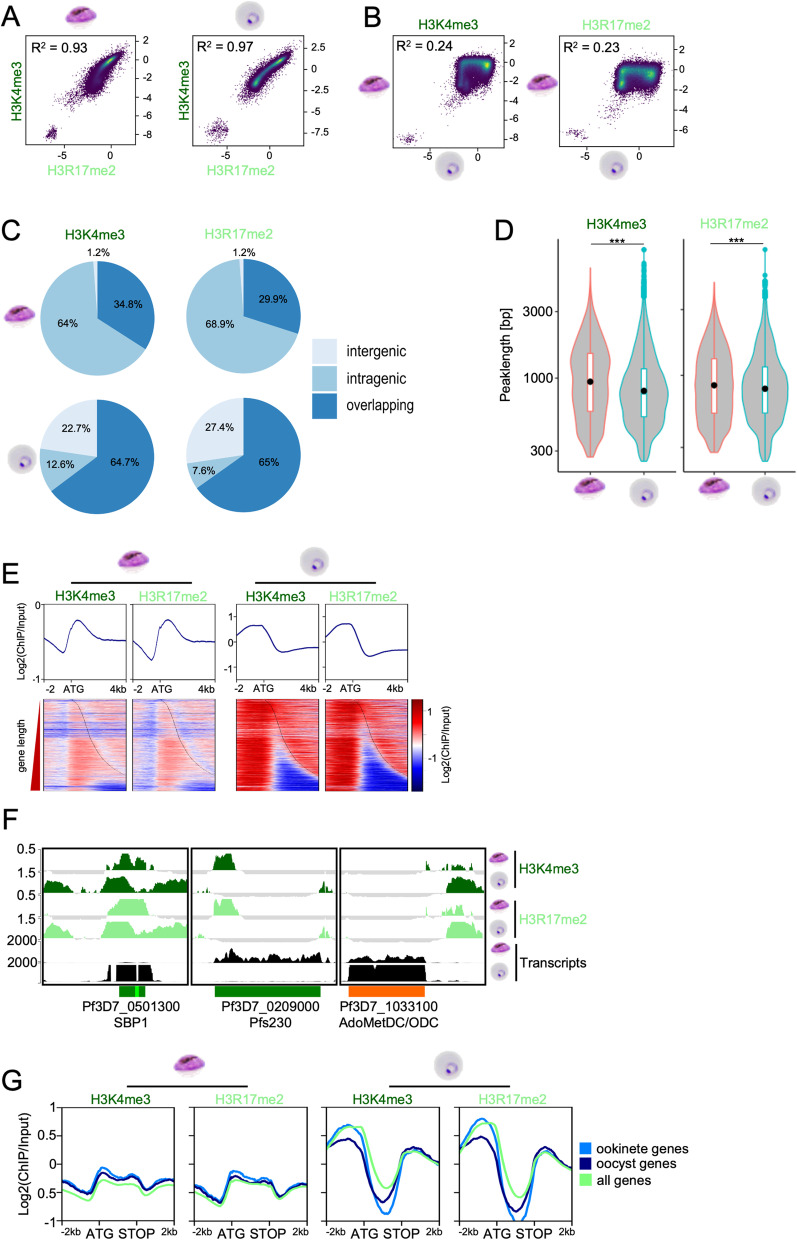
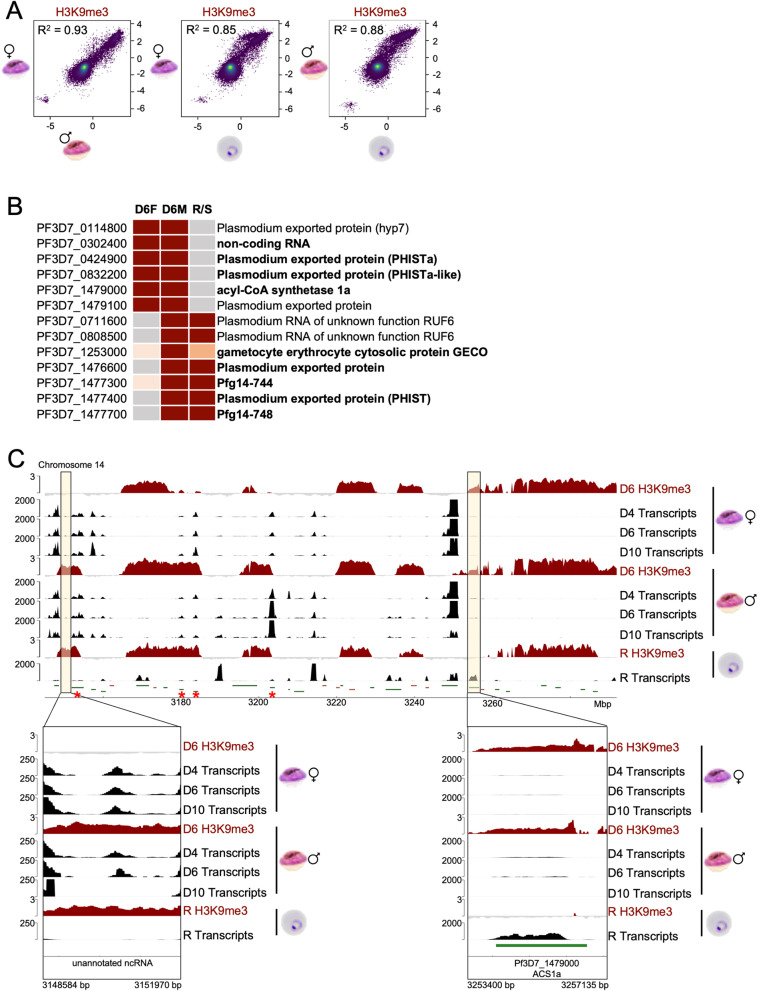
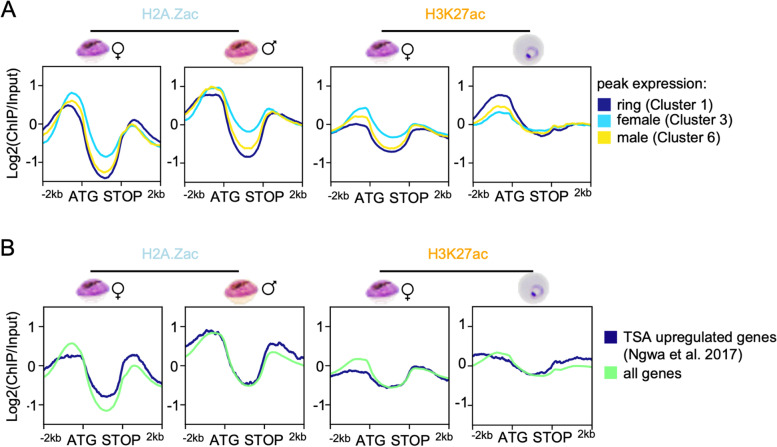
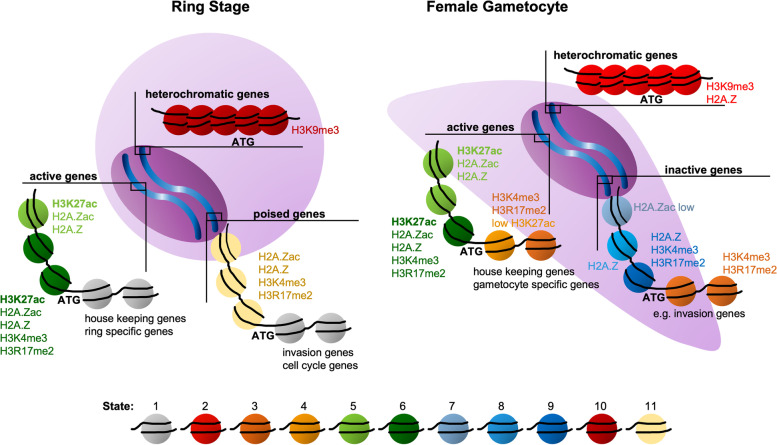
Results: We show that in female gametocytes the chromatin landscape is globally remodelled with respect to genome-wide patterns and combinatorial usage of histone variants and histone modifications. We identified sex specific differences in heterochromatin distribution, implicating exported proteins and ncRNAs in sex determination. Specifically in female gametocytes, the histone variants H2A.Z/H2B.Z were highly enriched in H3K9me3-associated heterochromatin. H3K27ac occupancy correlated with stage-specific gene expression, but in contrast to asexual parasites this was unlinked to H3K4me3 co-occupancy at promoters in female gametocytes.

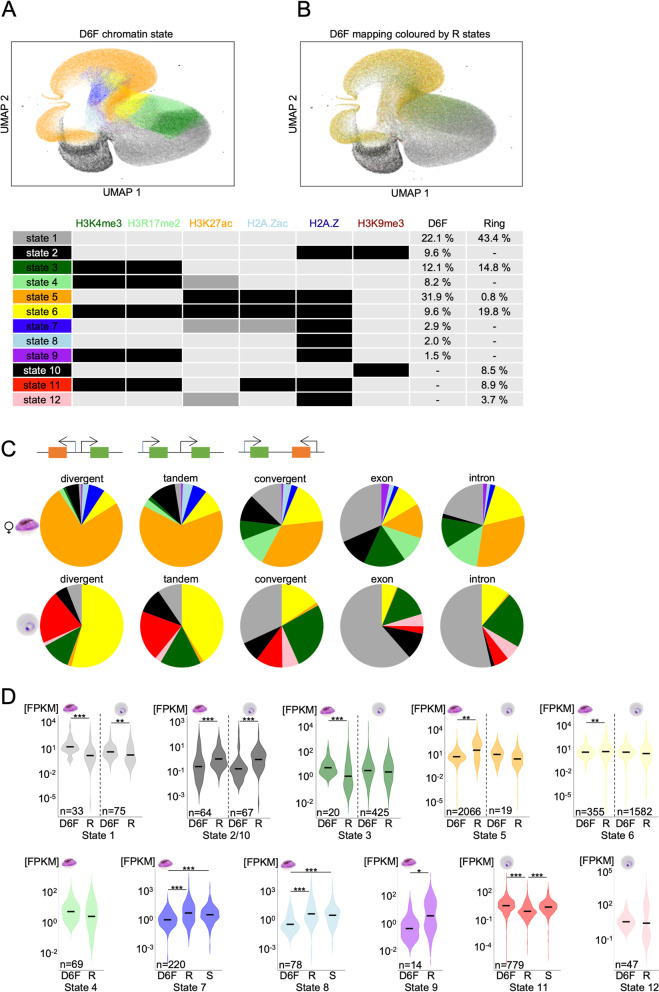
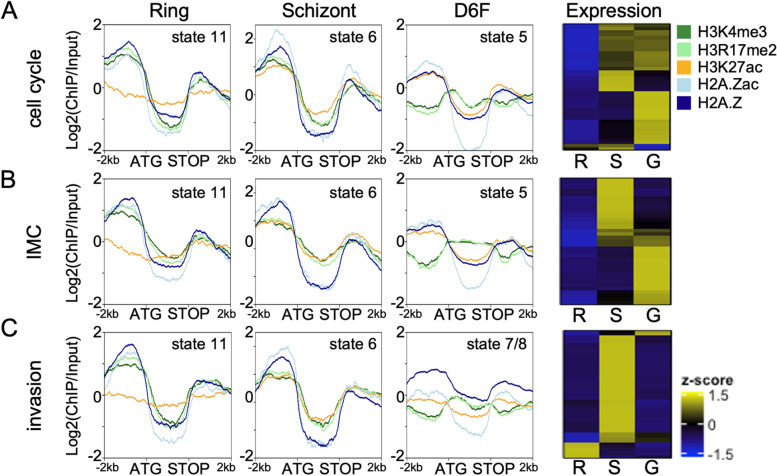
Conclusions: Collectively, we defined novel combinatorial chromatin states differentially organising the genome in gametocytes and asexual parasites and unravelled fundamental, sex-specific differences in the epigenetic code. Our chromatin maps represent an important resource for future understanding of the mechanisms driving sexual differentiation in P. falciparum.

Keywords: Epigenome; Gametocytogenesis; Histone variants; Malaria; Plasmodium falciparum; Transcriptome.


Conflict of interest statement

The authors declare that they have no competing interests.

Figures

Fig. 1
Fig. 1
Gene expression profiling of asexual and sexual parasites. Parasites expressing GFP- tagged ABCG2 [56] were tightly synchronised and induced to generate gametocytes that were subsequently FACS-sorted to separate male and female gametocytes. A Validation of sex- specific GFP expression over the course of gametocytogenesis by fluorescence microscopy. GFP signal is shown in green, Hoechst33342 signal is shown in blue. B Gating strategy for FACS sorting of viable male (MitoTrackerTM Deep Red positive, GFP low) and female (MitoTrackerTM Deep Red positive, GFP positive) gametocytes. C Validation of morphology by Giemsa staining after sorting. D RNA of FACS sorted male (day 4: n = 3, day 6: n = 2, day 10: n = 1) and female gametocytes (day 4: n = 2, day 6: n = 4, day 10: n = 4) harvested on day 4, 6, or 10 of gametocytogenesis was sequenced along with RNA from ring (n = 2) and schizont stage (n = 1) parasites. The z-scored, k-means clustered heatmap indicates peak expression of sense transcripts in the different parasite stages. The most significant gene ontology (GO) terms are shown and gene numbers are indicated in brackets
Fig. 2
Fig. 2
Global differences in the chromatin landscape between asexual parasites and gametocytes. ChIPseq was conducted on female day 6 gametocytes and ring stage parasites using antibodies against H3K4me3 (n = 2 for female gametocytes and ring stage parasites), H3R17me2 (n = 2 for female gametocytes and ring stage parasites), H3K27ac (n = 3 for female gametocytes, n = 2 for ring stage parasites), H2A.Z (n = 6 for female gametocytes, n = 2 for ring stage parasites), and H3K9me3 (n = 5 for female gametocytes, n = 2 for ring stage parasites). A Overview of log2-transformed ChIP/Input ratio tracks from female day 6 gametocytes and ring stage parasites along chromosome 2. Genes are indicated at the bottom, with green and orange referring to the transcriptional orientation. B Line plots showing the average log2-transformed ChIP/Input coverage of genes (ATG to STOP) and their 2 kb up- and downstream regions for each modification in female gametocytes (upper panel) and rings (lower panel) sorted into groups according to expression levels from stage-matched RNAseq data. Heterochromatic genes were defined by H3K9me3 enrichment 500 bp around the ATG. Silent genes were defined as genes with 0 FPKM by RNA-Seq. The remaining genes were divided into top, medium and bottom transcribed tertiles
Fig. 3
Fig. 3
H3K4me3 and H3R17me2 overlap genome-wide and are shifted into gene bodies in gametocytes. A Scatter plots showing the spearman correlation of mean H3K4me3 versus H3R17me2 coverage from two biological replicates in female day 6 gametocytes and ring stage parasites. B mean H3K4me3 or H3R17me2 coverage from two biological replicates in gametocytes versus ring stage parasites, respectively. The genome was divided into 150 bins and the average log2-transformed ChIP/Input ratio was calculated. R2, spearman correlation coefficient. C Piechart showing percentages of peaks intersecting intergenic regions, intragenic regions, or both (overlapping). D Violin plot of peak lengths. Peaks were called by MACS2 in female gametocytes and ring stage parasites. A two-sided student’s t-test showed for H3K4me3 peaks test statistic t = 17.505, degrees of freedom df = 19,404, p-value < 2.2e-16; and for H3R17me2 peaks test statistic t = 6.3903, degrees of freedom df = 17,222, p-value = 1.698e-10. E Profile plots and heatmap of log2-tranformed ChIP/Input data from 2 kb upstream to 4 kb downstream of every gene centred on the ATG and sorted by gene length. The dashed line shows the STOP site of the respective genes. F Examples of H3K4me3 or H3R17me2 ChIPseq profiles for a selection of loci with differential peaks in female gametocytes and rings. Transcripts detected by RNA-Seq are shown in the bottom line (FPKM). SBP1, skeleton binding protein (ring specific expression), region shown from 65.5 kbp to 72 kbp; Pfs230, 6-cysteine protein P230 (gametocyte specific expression), region shown from 368.4 kbp to 381.16 kbp; AdoMetDC/ODC, S-adenosylmethionine decarboxylase/ornithine decarboxylase (upstream peaks in both stages), region shown from 1.324 Mbp to 1.332 Mbp. Genes are marked by orientation either green (+ genes) or orange (- genes), with introns marked in either light green or dark red. G Average log2-transformed ChIP/Input coverage plots for H3K4me3 and H3R17me2 in day 6 female gametocytes and ring stage parasites over ookinete specifically expressed genes (defined by [48], available on PlasmoDB), oocyst specific genes (compared to blood stage genes, defined by [74], available on PlasmoDB), and all genes
Fig. 4
Fig. 4
Differences in H3K9me3-associated heterochromatin between immature female and male gametocytes and ring stage parasites. A Scatter plot shows pearson correlation of mean H3K9me3 coverage per 150 bp bin between the three parasite stages (n = 5 for female gametocytes, n = 2 for male gametocytes, n = 2 for ring stage parasites). R2, pearson correlation coefficient. B Table of genes marked differentially with H3K9me3 in the three stages. Red = H3K9me3, grey = no H3K9me3, orange = partial H3K9me3 (in promoter region but not in the gene body), light orange = reduced coverage with H3K9me3, D6M = male day 6 gametocyte, D6F = female day 6 gametocyte, R/S = rings and schizonts. C Overview over transcription profiles (black) and log2-transformed ChIP/Input ratio tracks of H3K9me3 (dark red) covering the right end of chromosome 14 to depict differences in the subtelomeric region between male and female gametocytes and rings. RNAseq data are shown for males and females from day 4, day 6, and day 10 during gametocytogenesis. The enlargement highlights two regions that are differentially marked: a putative lncRNA identified between Pf3D7_1476500 and Pf3D7_1476600 (left), and acyl-CoA synthetase ACS1a (right). H3K9me3 coverage of the lncRNA locus in rings and day 6 male gametocytes correlates with suppressed transcription in rings and day 10 male gametocytes. H3K9me3 coverage of ACS1a in male and female gametocytes correlates with suppressed transcription throughout gametocyte differentiation
Fig. 5
Fig. 5
H2A.Z is associated with heterochromatic areas in day 6 female gametocytes. A Overview over chromosome 2 showing log2-transformed ChIP/Input coverage for H2A.Z (deep blue) (n = 6 for female gametocytes, n = 2 for male gametocytes, n = 2 for ring stage parasites) and H3K9me3 (deep red) (n = 5 for female gametocytes, n = 2 for male gametocytes, n = 2 for ring stage parasites) in rings, male and female gametocytes as well as H2B.Z (purple) in female gametocytes (n = 1). Lower panel shows zoom into the heterochromatin/euchromatin boundary in the left subtelomeric region of chromosome 2, which includes several var, stevor (marked with an “s”), and rif genes. Genes are marked by orientation either green (+ genes) or orange (- genes), with introns marked in either light green or dark red. B Average profile plots of log2-transformed ChIP/Input signals for H2A.Z and H2A.Zac over gene bodies (ATG to STOP) and their 2 kb up-/downstream region in male and female day 6 gametocytes grouped by gene expression. C Correlation scatter plot of log2-tranformed ChIP/Input H2A.Z coverage per 150 bp bin comparing the different parasite stages against each other. R2, spearman correlation. D Correlation scatter plot of H2A.Z versus H2B.Z in female day 6 gametocytes
Fig. 6
Fig. 6
Histone acetylation H3K27ac and H2A.Zac correlate with stage specific gene expression in ring stage parasites and female gametocytes. A Average profile plots of log2-transformed ChIP/Input signals from H2A.Zac (n = 2 for female gametocytes, n = 1 for male gametocytes) and H3K27ac (n = 3 for female gametocytes) in female and male day 6 gametocytes for stage specifically expressed genes. Ring, female, and male specific genes represent clusters 1, 3, and 5, respectively, from Additional File 1: Figure S1. B Average log2-transformed ChIP/Input coverage plots for H2A.Zac and H3K27ac in day 6 male and female gametocytes over genes that are upregulated after TSA treatment in early gametocytes (Ngwa et al. 2017, available as Supplementary Table 2), and all genes
Fig. 7
Fig. 7
UMAP of the chromatin landscape defines chromatin states. A UMAP of the chromatin of female day 6 gametocytes, divided in bins of 50 bp, coloured by their individual chromatin states. B UMAP of female day 6 gametocytes coloured by ring stage chromatin states, showing conserved and remodelled bins. C Pie charts of the distribution of chromatin states over different genetic elements per parasite stage. D Violin plots showing the FPKM values of the genes that carried a region of at least 300 bp of the different states in their 2 kb upstream region in female day 6 gametocytes and ring stage parasites, respectively, indicated by the parasite stage above the plot. The FPKM values are compared between gametocyte gene expression (D6F), ring stage gene expression (R) and schizont stage gene expression (S) on the x-axis. Differences between the groups were investigated using Wilcoxon rank sum test with continuity correction (* p < 0.05, ** p < 0.01, *** p < 0.001). The black line represents the mean FPKM value
Fig. 8
Fig. 8
Chromatin states are linked to differential gene expression across parasite stages. The line plots show the log2-transformed ChIP/Input coverage of the different histone modifications in the 2 kb upstream region, gene body (ATG to STOP) and 2 kb downstream region in rings, schizonts and day 6 female gametocytes. Heatmaps show the relative expression (FPKM z-scored) of the same groups in rings (R), schizonts (S), and female day 6 gametocytes (G). Gene lists were defined by genes of this group that had a defined chromatin state in rings, resulting in 53 cell cycle genes, 41 IMC genes and 55 invasion genes. A) Genes involved in cell cycle. B) Genes of the inner membrane complex (IMC). C) Genes involved in invasion. The chromatin states observed in each panel are indicated
Fig. 9
Fig. 9
Overview over different chromatin states indexing the genome in ring stage parasites and female gametocytes. A ring stage parasite and a female gametocyte are schematically depicted. The differently coloured spheres represent nucleosomes that carry distinct histone variants and modifications. The ATG indicates the position of the gene starts. Heterochromatic genes are shown as more condensed areas either in dark red as nucleosomes containing only H3K9me3 (state 10 in rings), or in light red as nucleosomes containing both H3K9me3 and H2A.Z (state 2 in female gametocytes). In the euchromatin compartment, regions upstream of active genes contain mostly state 6 nucleosomes (dark green), and to a lesser extent state 5 nucleosomes (light green) in ring stage parasites, whereas this ratio is reversed in female gametocytes with most nucleosomes present in state 5. In female gametocytes, most gene bodies contain state 3 nucleosomes (orange), which are dominated by H3K4me3 and H3R17me2 and some state 4 nucleosomes (light orange), that additionally carry low levels of H3K27ac—in contrast to rings where state 1 (none of the investigated modifications) is predominant (grey). Further, genes poised in ring stage parasites for activation later during the asexual cycle (e.g. invasion, cell cycle) carry state 11 nucleosomes in their upstream region (yellow). In female gametocytes, genes that are inactivated, such as invasion genes, are characterized by state 7, 8, and 9 nucleosomes in their upstream region depicted in shades of blue. State 12 was mostly prevalent in convergent intergenic regions and introns and is therefore not represented in this figure

Similar articles

Cited by

References

    1. WHO . WHO Malaria Report 2020. 2020.
    1. Aguilar R, Magallon-Tejada A, Achtman AH, Moraleda C, Joice R, Cistero P, et al. Molecular evidence for the localization of Plasmodium falciparum immature gametocytes in bone marrow. Blood. 2014;123(7):9. doi: 10.1182/blood-2013-08-520767. - DOI - PMC - PubMed
    1. Joice R, Nilsson SK, Montgomery J, Dankwa S, Egan E, Morahan B, et al. Plasmodium falciparum transmission stages accumulate in the human bone marrow. Sci Transl Med. 2014;6:244re5. doi: 10.1126/scitranslmed.3008882. - DOI - PMC - PubMed
    1. Lasonder E, Rijpma SR, van Schaijk BC, Hoeijmakers WA, Kensche PR, Gresnigt MS, et al. Integrated transcriptomic and proteomic analyses of P. falciparum gametocytes: molecular insight into sex-specific processes and translational repression. Nucleic Acids Res. 2016;44:6087–101. doi: 10.1093/nar/gkw536. - DOI - PMC - PubMed
    1. van Biljon R, van Wyk R, Painter HJ, Orchard L, Reader J, Niemand J, et al. Hierarchical transcriptional control regulates Plasmodium falciparum sexual differentiation. BMC Genomics. 2019;20:920. doi: 10.1186/s12864-019-6322-9. - DOI - PMC - PubMed

Publication types