

Pathological variants in TOP3A cause distinct disorders of mitochondrial and nuclear genome stability
- PMID: 37013609
- PMCID: PMC10165364
- DOI: 10.15252/emmm.202216775
Pathological variants in TOP3A cause distinct disorders of mitochondrial and nuclear genome stability
Abstract
Topoisomerase 3α (TOP3A) is an enzyme that removes torsional strain and interlinks between DNA molecules. TOP3A localises to both the nucleus and mitochondria, with the two isoforms playing specialised roles in DNA recombination and replication respectively. Pathogenic variants in TOP3A can cause a disorder similar to Bloom syndrome, which results from bi-allelic pathogenic variants in BLM, encoding a nuclear-binding partner of TOP3A. In this work, we describe 11 individuals from 9 families with an adult-onset mitochondrial disease resulting from bi-allelic TOP3A gene variants. The majority of patients have a consistent clinical phenotype characterised by bilateral ptosis, ophthalmoplegia, myopathy and axonal sensory-motor neuropathy. We present a comprehensive characterisation of the effect of TOP3A variants, from individuals with mitochondrial disease and Bloom-like syndrome, upon mtDNA maintenance and different aspects of enzyme function. Based on these results, we suggest a model whereby the overall severity of the TOP3A catalytic defect determines the clinical outcome, with milder variants causing adult-onset mitochondrial disease and more severe variants causing a Bloom-like syndrome with mitochondrial dysfunction in childhood.
Keywords: Bloom syndrome; TOP3A; mitochondrial disease; mtDNA.
© 2023 The Authors. Published under the terms of the CC BY 4.0 license.
Conflict of interest statement
The authors declare that they have no competing interests.
Figures

Pedigrees and segregation of TOP3A variants in mitochondrial disease patients described in this study. Affected individuals are shown as filled shapes. Males are represented as squares, females are represented as circles and deceased individuals are indicated with diagonal lines. Arrows indicate the probands.
Domain structure of the TOP3A protein. Domains are assigned according to Bocquet et al (2014). The locations of truncating variants in TOP3A are indicated above the diagram and missense variants are below the diagram. Variants found in mitochondrial disease patients are shown in blue, and variants found in Bloom syndrome that are included in this study are shown in orange.
Sequence conservation of pathological TOP3A variants. Affected residues are highlighted in yellow, and sequence homology is indicated below the sequences.
Location of pathological variants within the structure of TOP3A (PDB: 4CGY). Domains are coloured according to the assignments in (B). Affected residues are shown in red. The location of the catalytic tyrosine residue (Tyr362) and magnesium ion cofactor (Mg2+) are also indicated. RMI1 is not shown.
Enlarged images of affected residues as in (D). Interactions involving the side chains of these residues are depicted as black lines.

- A–E
Creation of an assembled haplotype at the TOP3A locus in Pa5‐1. (A) Three reads highlighted in brown, orange and blue span the interval between target variants c.298A>G and c.1723A>G. (B) Read‐level data for the haplotype assembled reads (highlighted brown and orange), which are reference nucleotide supporting at position c.1723. (C) Read‐level data used to create the assembled haplotype through variant‐supporting nucleotides at positions c.1282–21 and c.1468–11. (D) Read‐level data for the haplotype assembled read (highlighted blue), which is variant supporting at position c.298. (E) A schematic illustration of the assembled haplotype, for target variants c.298A>G and c.1723A>G, which are consistent with a trans configuration (arranged on different parental alleles). Nomenclature provided according to transcript NM_004618.5.
- F–J
Creation of an assembled haplotype at the TOP3A locus in Pa6. (F) Two reads highlighted in red and pink span the interval between target variants c.778C>T and c.1723A>G. (G) Read‐level data for the haplotype assembled read (highlighted red), which is variant nucleotide supporting at position c.1723. (H) Read‐level data used to create the assembled haplotype from reference supporting nucleotides at positions chr17:18195268 and chr17:18195287 (red and pink highlighted reads). (I) Read‐level data for the haplotype assembled read (highlighted pink), which is reference supporting at position c.778. (J) A schematic illustration of the assembled haplotype for target variants c.778C>T and c.1723A>G, which are consistent with a trans configuration (arranged on different parental alleles). Nomenclature provided according to transcript NM_004618.5.
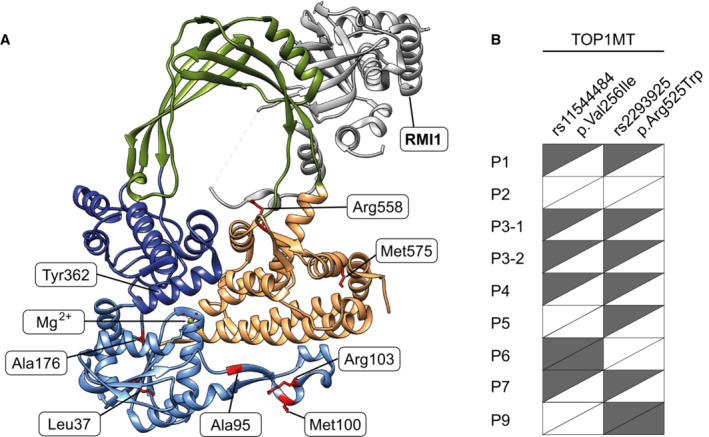
The location of pathological variants within the crystal structure of TOP3A, including RMI1, a nuclear‐binding partner of TOP3A (PDB: 4CGY). The affected residues are shown in red, and domains are coloured according to format shown in Fig 1B.
The presence of previously identified SNPs in TOP1MT (rs11544484, p.Val256Ile; and rs2293925, p.Arg525Trp; Zhang et al, 2017) in TOP3A patients reported in this study for which the information is available. Half‐filled rectangles indicate a heterozygous SNP, and filled rectangles indicate a homozygous SNP.

- A
Sequential COX‐SDH histochemical staining in muscle biopsies of Pa2, Pa3‐1, Pa4 and Pa6 (as indicated), indicating a mosaic pattern of COX deficiency. Scale bar represents 100 μm.
- B
Quadruple immunofluorescence assay to detect deficiency in complex I (NDUFB8) and complex IV (COXI) in Pa3‐1 (left) and Pa6 (right).
- C
Long‐range PCR assay to detect mtDNA deletions in TOP3A patient muscle (lanes 2–5). Samples from unaffected individuals (lanes 6 and 7) and a single‐deletion mitochondrial disease patient (lane 8) are used as negative and positive controls respectively. “M” indicates marker.
- D–G
Mapping of mtDNA rearrangements in TOP3A mitochondrial disease patients. Total DNA samples from Pa2 (D), Pa3‐1 (E), Pa4 (F) and Pa5 (G) were analysed by whole‐genome sequencing, and the data were processed using the MitoSAlt pipeline. Deleted regions are shown as blue bars and predicted duplicated regions as red bars. The intensity of the colour corresponds to the abundance of the rearrangement.

Enlargement of the NCR region in whole‐genome sequence data of Pa2, indicating the locations of small mtDNA rearrangements. The locations of mtDNA cis‐elements in this region are indicated (LSP, light‐strand promoter; HSP, heavy‐strand promoter; OriH, origin of heavy‐strand replication; CSBs, conserved sequence blocks).
Mitochondrial DNA rearrangements from Pa1 (Nicholls et al, 2018). Whole‐genome sequencing data were analysed using the same version of the MitoSAlt pipeline as for newly reported individuals (Fig 2) to permit comparison of breakpoint mapping datasets. Deleted regions are shown as blue bars and predicted duplicated regions as red bars. The intensity of the colour corresponds to the abundance of the rearrangement.
Analysis of mtDNA rearrangements in Pa2 and Pa5‐1 using Southern blotting. Total muscle DNA (250 ng) was restricted with BamHI, and then left further untreated or incubated with 1 U of T7 endonuclease I, separated on agarose and Southern blotted using probe A (indicated with a black bar). Diagrams indicate the structures visible.

- A, B
Analysis of mtDNA structure in muscle from individuals with TOP3A‐related mitochondrial disease using Southern blotting following restriction with BamHI (A) or PvuII (B). The black bar indicates the probe (nt. 16262‐128).
- C–F
mtDNA phenotypes in U2OS Flp‐In cells treated with TOP3A siRNA, rescued using variant‐containing siRNA‐resistant forms of TOP3A. (C) Western blot of TOP3A protein expression. Cells were untransfected (lane 1) or transfected with TOP3A siRNA (lanes 2–11), then induced to express WT TOP3A (lane 3) or pathological variants of TOP3A (lanes 4–11). Note that TOP3A Ser810* does not carry a C‐terminal HA tag. β‐actin is used as a loading control. (D) mtDNA copy number for TOP3A rescue cells as in (C) determined using qPCR. Error bars represent SEM, n = 3 (Ala95Val) or n = 4 (all other samples), where each data point represents the mean of three technical triplicates. Significance values are shown for one‐way ANOVA compared to untreated wild‐type cells, *P < 0.05, **P < 0.01, ***P < 0.001, ****P < 0.0001. (E) Southern blot of mtDNA structure from cells as in (C). The probe (black bar, nt. 16262‐128) detects both full‐length (FL) mtDNA and 7S DNA. The presence of hemicatenated mtDNAs is indicated. (F) Southern blot of uncut mtDNA to visualise different topological forms, from cells as in (C). Control DNA treated with BamHI (lane 1) or E. coli topoisomerase I (lane 2) acts as markers for linear and relaxed monomeric mtDNA respectively. Diagrams indicate the migration of different mtDNA forms.

- A
Western blot of HeLa cells treated with TOP3A siRNA, with or without transient expression of TOP3A Ser810*. The band corresponding to TOP3A Ser810* migrates close to a non‐specific band (indicated with #). β‐actin is used as a loading control.
- B
Electrophoretic mobility shift assay (EMSA) using either 80‐mer or 40‐mer ssDNA substrates. Diagrams indicate singly and doubly shifted substrate.
- C, D
Controls for substrate migration in plasmid relaxation assays. Negatively supercoiled pUC19 plasmid DNA was either left untreated (lane 2) or treated with the indicated enzymes. E. coli TopoI‐treated plasmid DNA (lane 3) shows the migration of covalently closed relaxed DNA, BamHI‐treated DNA (lane 4) shows the migration of linearised plasmid and Nt.BspQI‐treated DNA (lane 5) shows the migration of nicked circular plasmid. Reactions were separated either in the absence of ethidium bromide (EtBr) and post‐stained for imaging (C) or run in the presence of EtBr (D). The migration of relaxed open, circular DNA and supercoiled DNA is indicated to the right of figure.
- E
Controls for TOP3A nicking activity. Negatively supercoiled pUC19 plasmid DNA was incubated with WT TOP3A protein as in Fig 5A, then separated on an agarose gel containing EtBr. The migration of nicked DNA and supercoiled DNA is indicated to the right of the figure. “M” indicates marker.

- A
Purification of TOP3A variants. Each variant (3 pmol) was separated on a 4–20% stain‐free Criterion TGX SDS–PAGE gel (Bio‐Rad) and imaged using a stain‐free imager.
- B–J
Electrophoretic mobility shift assay (EMSA) to assess DNA‐binding activity of TOP3A variants to a 5′ radiolabelled 80‐nt‐long ssDNA oligonucleotide.
- K
Quantification of DNA‐binding activity as in (B–J), expressed as the proportion of bound DNA. Data represent mean values with at least three independent experiments per data point. Error bars represent SEM. Symbols represent significance values (one‐way ANOVA) and are colour coded to the data points. *P < 0.05, **P < 0.01, ****P < 0.0001.

- A–I
Relaxation of negatively supercoiled pUC19 substrate by recombinant TOP3A variants. “M” indicates marker.
- J
Quantification of DNA relaxation data as in (A–I). Data represent the percentage of substrate released from negatively supercoiled form, expressed as the mean of three independent experiments (except WT, for which n = 4). Error bars represent SEM. Symbols represent significance values (one‐way ANOVA) and are colour coded to the data points. ****P < 0.0001.

- A
Schematic of substrate construction for ssDNA decatenation assays. The two ring oligos (R1 and R2) are held in an Lk1 conformation by holder oligos (R1 and R2) and ligated (red arrows) with the aid of splint oligos (S1 and S2), and then purified. Incubation with TOP3A decatenates this substrate into two independent circular ssDNA oligos.
- B–J
ssDNA decatenation assays using TOP3A variants, using substrates constructed as in (A).
- K
Quantification of ssDNA decatenation activity as in (B–J). Data represent the percentage of decatenated substrate expressed as mean values, ±SEM, from independent experiments, n = 3 (WT, p.Ala95Val, p.Met100Val and p.Arg558Trp), n = 4 (p.Ala176Val), n = 5 (p.Met575Val) and n = 2 (p.Leu37Val). Symbols represent significance values (one‐way ANOVA) and are colour coded to the data points. *P < 0.05, **P < 0.01.
- L
ssDNA decatenation assays using combinations of compound heterozygous TOP3A variants. Reactions contained 50 fmol of protein (for single variants, lanes 2–7) or 25 fmol for each of two variants (lanes 8–10).
- M
Quantifications of ssDNA decatenation assays as in (L). Data represent the mean percentage of decatenated substrate from three independent experiments. Significance values are shown for one‐way ANOVA compared to the WT protein. *P < 0.05, **P < 0.01, ***P < 0.001.

Synthesis of Lk1 ssDNA catenanes. Linear and circular R1 and R2 oligos are shown for size comparison (lanes 1–4). Products resulting from synthesis reactions omitting R2 (lane 5) or R1 (lane 6) are shown, as well as a complete synthesis reaction (lane 7). The migration of Lk1 ssDNA catenanes and circular and linear R1 and R2 oligos is indicated to the right of figure.
Verification of Lk1 ssDNA catenanes. Linear and circular R1 and R2 oligos are shown for size comparison (lanes 1–4). The treatment of linear R1 oligo with ExoI (lane 5) is shown as a positive control for ExoI activity. Lk1 ssDNA catenanes were treated with ExoI (lane 6), S1 nuclease (lane 7) or CviKI‐1 (lane 8). The migration of Lk1 ssDNA catenanes and circular and linear R1 and R2 oligos is indicated to the right of the figure.
References
-
- Bizard AH, Allemand JF, Hassenkam T, Paramasivam M, Sarlos K, Singh MI, Hickson ID (2019) PICH and TOP3A cooperate to induce positive DNA supercoiling. Nat Struct Mol Biol 26: 267–274 - PubMed
Publication types
MeSH terms
Substances
Grants and funding
LinkOut - more resources
Full Text Sources
Medical
Molecular Biology Databases
