. 2023 Apr 3;15(1):20.
doi: 10.1186/s13073-023-01170-x.

A novel transcriptional signature identifies T-cell infiltration in high-risk paediatric cancer

Affiliations

A novel transcriptional signature identifies T-cell infiltration in high-risk paediatric cancer

Chelsea Mayoh et al. Genome Med. .

Abstract

Background: Molecular profiling of the tumour immune microenvironment (TIME) has enabled the rational choice of immunotherapies in some adult cancers. In contrast, the TIME of paediatric cancers is relatively unexplored. We speculated that a more refined appreciation of the TIME in childhood cancers, rather than a reliance on commonly used biomarkers such as tumour mutation burden (TMB), neoantigen load and PD-L1 expression, is an essential prerequisite for improved immunotherapies in childhood solid cancers.

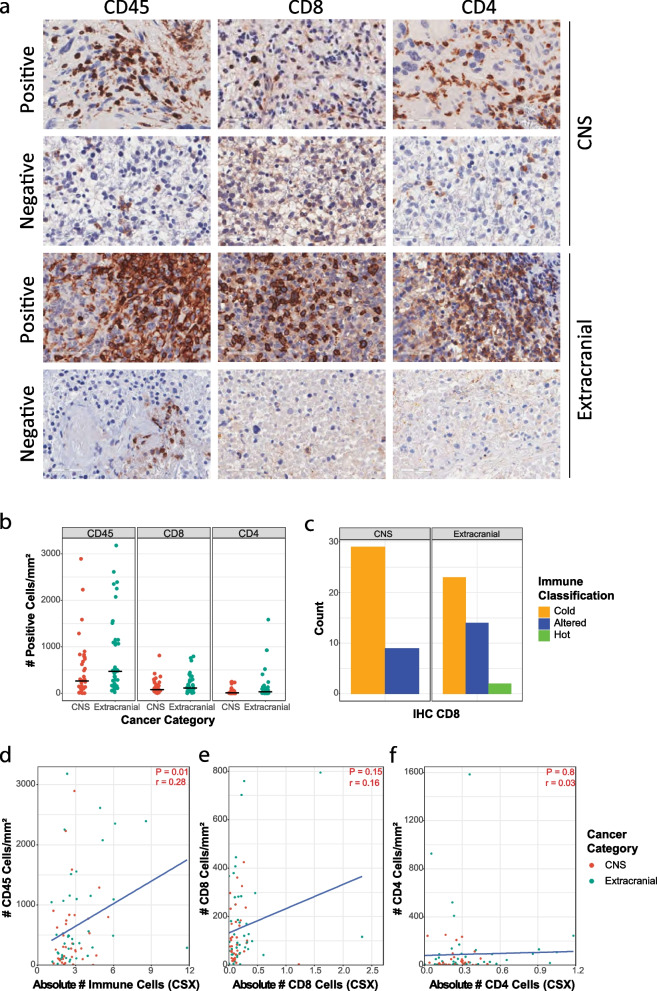
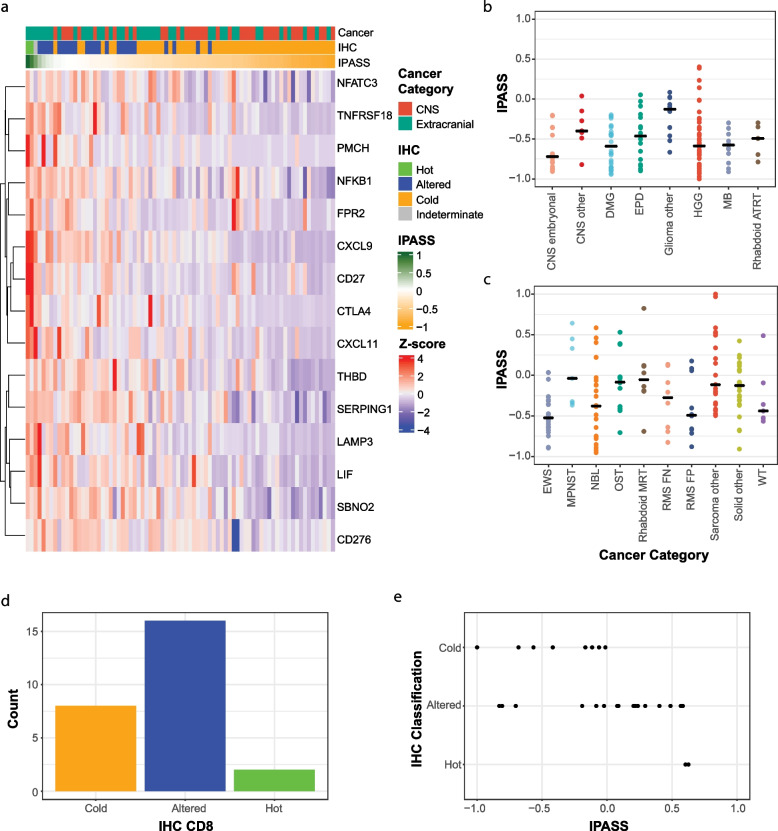
Methods: We combined immunohistochemistry (IHC) with RNA sequencing and whole-genome sequencing across a diverse spectrum of high-risk paediatric cancers to develop an alternative, expression-based signature associated with CD8+ T-cell infiltration of the TIME. Furthermore, we explored transcriptional features of immune archetypes and T-cell receptor sequencing diversity, assessed the relationship between CD8+ and CD4+ abundance by IHC and deconvolution predictions and assessed the common adult biomarkers such as neoantigen load and TMB.

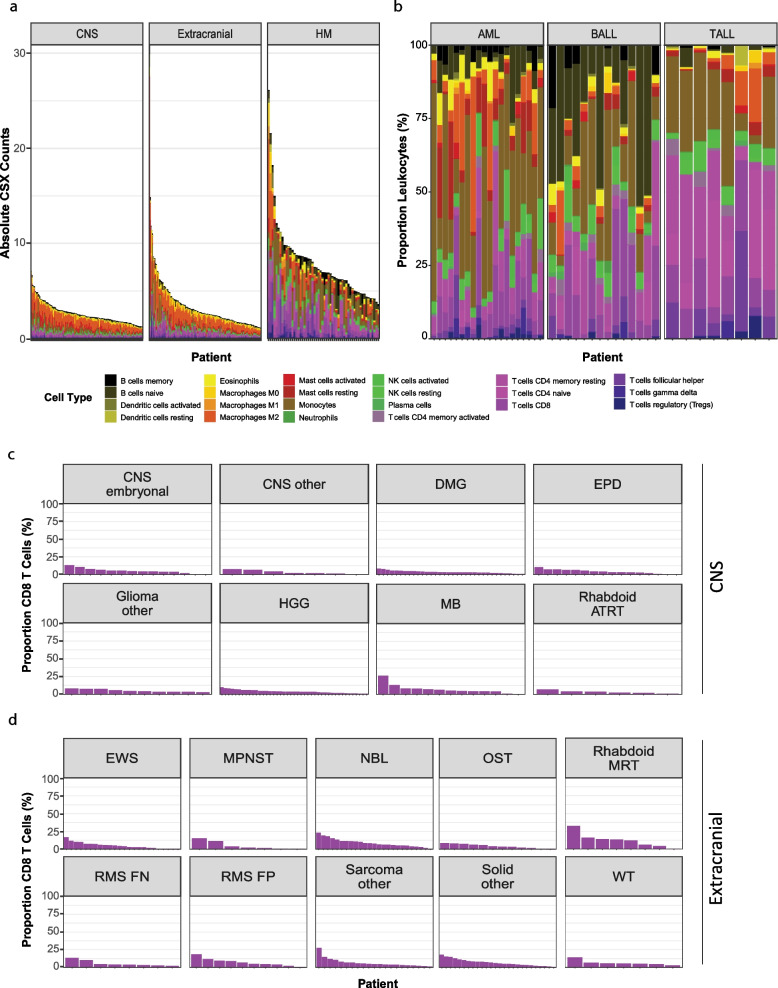
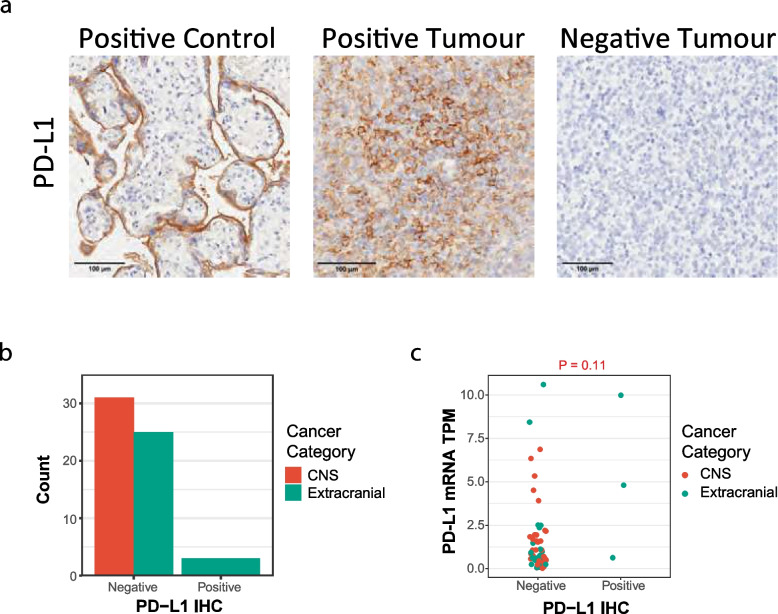
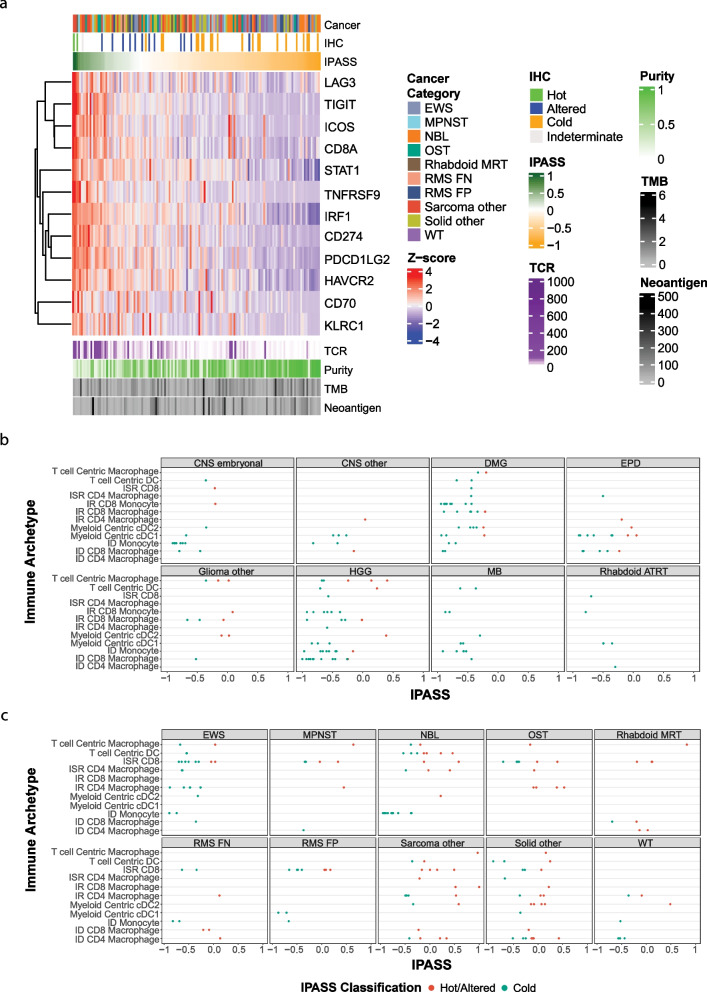
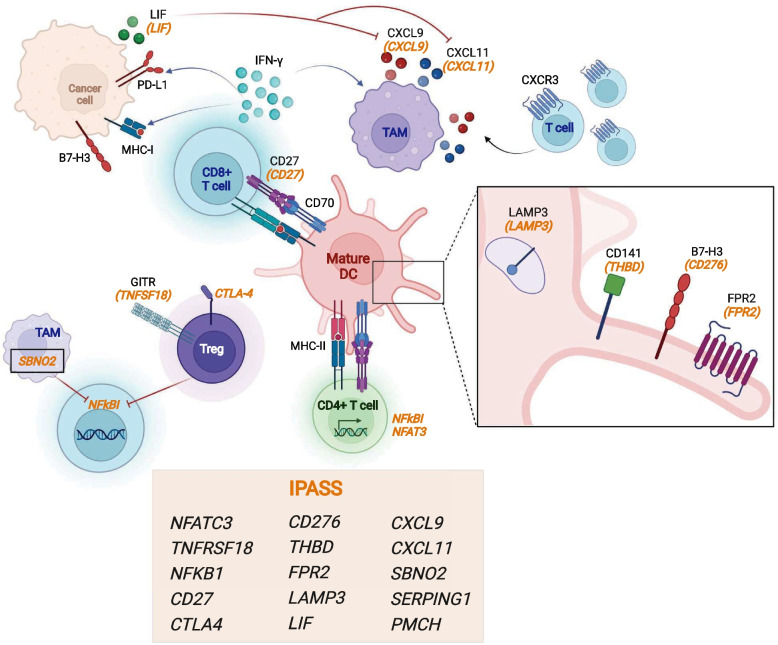
Results: A novel 15-gene immune signature, Immune Paediatric Signature Score (IPASS), was identified. Using this signature, we estimate up to 31% of high-risk cancers harbour infiltrating T-cells. In addition, we showed that PD-L1 protein expression is poorly correlated with PD-L1 RNA expression and TMB and neoantigen load are not predictive of T-cell infiltration in paediatrics. Furthermore, deconvolution algorithms are only weakly correlated with IHC measurements of T-cells.

Conclusions: Our data provides new insights into the variable immune-suppressive mechanisms dampening responses in paediatric solid cancers. Effective immune-based interventions in high-risk paediatric cancer will require individualised analysis of the TIME.

Keywords: Biomarkers; Paediatric cancer; T-cell infiltration; Transcriptome signature; Tumour immune microenvironment.


Conflict of interest statement

P.G.E receives an annual payment related to the Walter and Eliza Hall Institute distribution of royalties scheme. P.G.E. consults for Illumina. P.J.N. receives research funding from BMS, Roche Genentech, Allergan, Compugen, Merck Sharpe Dohme and Crispr therapeutics. J.R.H. declares honorarium or Bayer and Alexion Pharmaceuticals; Boxer Capital unrelated to this work. The remaining authors declare that they have no competing interests.

Figures

Fig. 1
Fig. 1
Deconvolution of bulk RNA sequencing in paediatric cancer. a Absolute immune cell abundance by CIBERSORTx (CSX) for each patient separated into central nervous system (CNS), extracranial, and haematological malignancies (HM), ordered from the highest number of leucocytes to the lowest. b Proportion of all leucocytes (y-axis) for each HM patient (x-axis) separated into acute myeloid leukaemia (AML), B-precursor acute lymphoblastic leukaemia (BALL) and T-cell acute lymphoblastic leukaemia (TALL). c, d Proportion of CD8 T-cells in CSX within each patient classed by CNS (c) and extracranial (d) tumour subtypes
Fig. 2
Fig. 2
High-risk paediatric cancers are predominantly PD-L1 negative. a Representative immunohistochemistry (IHC) images for PD-L1 in a control, positive and negative tumour. b Number of PD-L1-negative and PD-L1-positive samples with cancer category highlighted. c PD-L1 (< 1%) and PD-L1.+ (≥ 1%) by IHC compared to PD-L1 expression by RNA-seq (TPM, transcripts per million) in CNS (red) and extracranial tumours (blue)
Fig. 3
Fig. 3
Immunohistochemistry identifies immune-hot and immune-altered paediatric tumours. a Representative IHC images for CD45, CD8 and CD4 staining in CNS and extracranial tumours illustrating positive and negative tumours. b The number (cells/mm2) of CD45+, CD8+, and CD4+ cells in CNS and extracranial tumours by IHC. Black horizontal line represents the mean. c Number of CNS and extracranial samples classified by CD8 IHC as either immune-cold, immune-altered or immune-hot. d Correlation between the absolute number of immune cells by CIBERSORTx (CSX) compared to number/mm2 of CD45+ cells by IHC. e Correlation between the absolute number of CD8 T-cells by CSX compared to number/mm2 of CD8+ T-cells by IHC. f Correlation between the absolute number of CD4 T-cells by CSX compared to number/mm2 of CD4+ cells by IHC. Blue line in (d–f) is the correlation line of best fit
Fig. 4
Fig. 4
Novel paediatric immune signature predicts T-cell infiltrated tumours. a Heatmap of the novel 15-gene paediatric immune signature (IPASS) in patients with matched IHC (n = 78). The top annotation bar represents the cancer category, the second annotation is CD8 IHC classification and the third annotation bar is the normalised IPASS score measured between 1 (green) and − 1 (orange). IPASS distribution across b CNS and c extracranial tumours. d Number of validation samples classified by CD8 IHC as either immune-cold, immune-altered or immune-hot. e IPASS for each validation sample assigned to their IHC CD8 classification (n = 26)
Fig. 5
Fig. 5
Immune genes and archetypes provide insight into TIME of paediatric tumours. a Heatmap of 12 immune checkpoint genes associated with IPASS in extracranial tumours (n = 148). The top annotation bar represents the cancer category, the second annotation is CD8 IHC classification and the third annotation bar is the normalised IPASS score measured between 1 (green) and − 1 (orange). Below the heatmap, the annotation bars represent the number of T-cell receptor (TCR) clones, tumour purity (percentage of malignant cells), tumour mutation burden (TMB) and neoantigen load. b, c IPASS score (highlighted by hot/altered (red) or cold (blue)) for each sample assigned to their given dominant immune archetype in b CNS and c extracranial tumours. Archetype key: dendritic cells (DC), immune stromal rich (ISR), immune rich (IR), classical DC (cDC) and immune desert (ID)
Fig. 6
Fig. 6
The IPASS gene signature describes a complex immune network within paediatric cancers. A concept figure depicting the potential immune cell interactions which feature the IPASS genes. The IPASS describes interactions which both drive and control anti-tumour immunity. CD8+ T-cells (blue) recognise tumour-associated antigen on mature and cross-presenting dendritic cells (pink) [CD141, LAMP3] and secrete IFN-γ, which induces cancer cell MHC-I and PD-L1 expression. IFN-γ response genes [CXCL9, CXCL11] are derived from tumour associated macrophages (TAMs, mauve) and are key chemokines for trafficking of CXCR3+ effector T-cells into the tumour. Control over this effector T-cell trafficking is mediated by tumour cell secretion of LIF which suppresses TAM CXCL9. In addition, IL-10/STAT3 signalling in TAMs induces SBNO2, a transcriptional co-repressor which contributes to the anti-inflammatory response. The IPASS includes genes expressed by activated T-cells [NFATC3, NFKb1, CD27, CTLA4, GITR], in contrast to the immune suppressor Tregs (purple) constitutively express [GITR, CTLA4]. The functional effect of B7-H3 is context dependent, B7-H3 expression on tumour cells is immune suppressive. The transmembrane receptor FPR2 senses ligands from bacteria products and generates a danger signal. This figure was created in Biorender

References

    1. Wong M, Mayoh C, Lau LMS, Khuong-Quang DA, Pinese M, Kumar A, et al. Whole genome, transcriptome and methylome profiling enhances actionable target discovery in high-risk pediatric cancer. Nat Med. 2020;26(11):1742–1753. doi: 10.1038/s41591-020-1072-4. - DOI - PubMed
    1. van Tilburg CM, Pfaff E, Pajtler KW, Langenberg KPS, Fiesel P, Jones BC, et al. The Pediatric Precision Oncology INFORM Registry: clinical outcome and benefit for patients with very high-evidence targets. Cancer Discov. 2021;11(11):2764–2779. doi: 10.1158/2159-8290.CD-21-0094. - DOI - PMC - PubMed
    1. Downing JR, Wilson RK, Zhang J, Mardis ER, Pui CH, Ding L, et al. The Pediatric Cancer Genome Project. Nat Genet. 2012;44(6):619–622. doi: 10.1038/ng.2287. - DOI - PMC - PubMed
    1. Expanding the reach of anti-PD-1 therapy. Cancer Discov. 2015;5(7):684–5. - PubMed
    1. Vinay DS, Ryan EP, Pawelec G, Talib WH, Stagg J, Elkord E, et al. Immune evasion in cancer: mechanistic basis and therapeutic strategies. Semin Cancer Biol. 2015;35(Suppl):S185–S198. doi: 10.1016/j.semcancer.2015.03.004. - DOI - PubMed

Publication types