. 2023 Apr 3;42(1):79.
doi: 10.1186/s13046-023-02650-z.

Platform combining statistical modeling and patient-derived organoids to facilitate personalized treatment of colorectal carcinoma

Affiliations

Platform combining statistical modeling and patient-derived organoids to facilitate personalized treatment of colorectal carcinoma

George M Ramzy et al. J Exp Clin Cancer Res. .

Abstract

Background: We propose a new approach for designing personalized treatment for colorectal cancer (CRC) patients, by combining ex vivo organoid efficacy testing with mathematical modeling of the results.

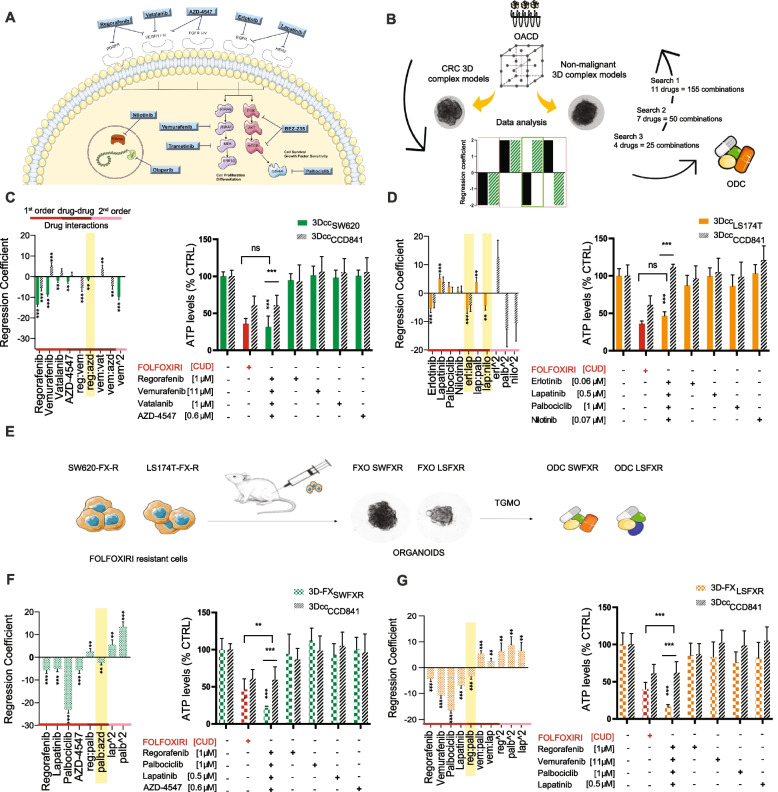
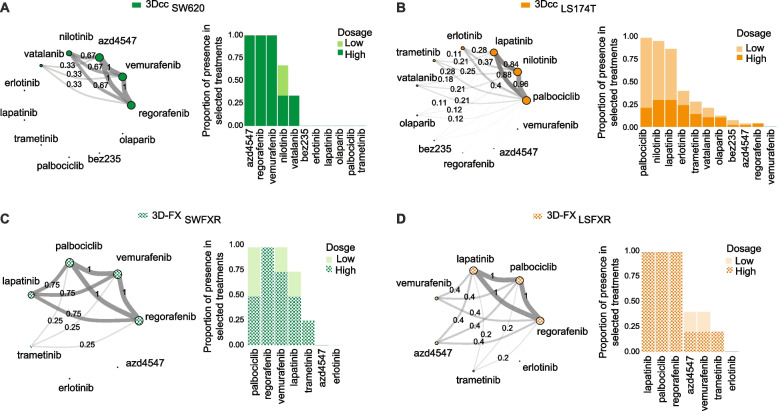
Methods: The validated phenotypic approach called Therapeutically Guided Multidrug Optimization (TGMO) was used to identify four low-dose synergistic optimized drug combinations (ODC) in 3D human CRC models of cells that are either sensitive or resistant to first-line CRC chemotherapy (FOLFOXIRI). Our findings were obtained using second order linear regression and adaptive lasso.

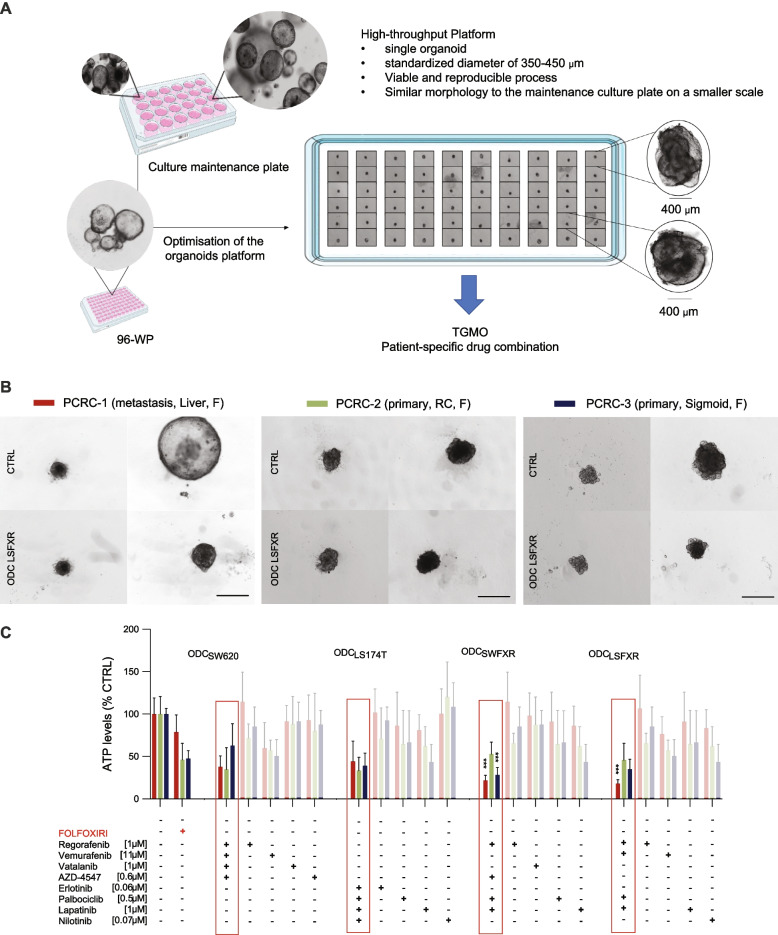
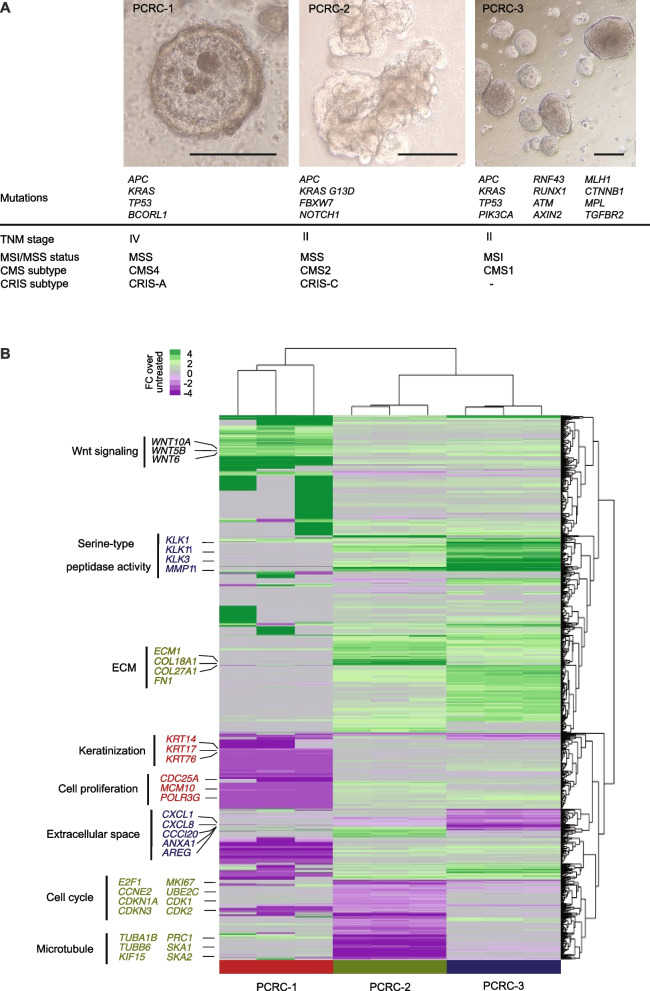
Results: The activity of all ODCs was validated on patient-derived organoids (PDO) from cases with either primary or metastatic CRC. The CRC material was molecularly characterized using whole-exome sequencing and RNAseq. In PDO from patients with liver metastases (stage IV) identified as CMS4/CRIS-A, our ODCs consisting of regorafenib [1 mM], vemurafenib [11 mM], palbociclib [1 mM] and lapatinib [0.5 mM] inhibited cell viability up to 88%, which significantly outperforms FOLFOXIRI administered at clinical doses. Furthermore, we identified patient-specific TGMO-based ODCs that outperform the efficacy of the current chemotherapy standard of care, FOLFOXIRI.

Conclusions: Our approach allows the optimization of patient-tailored synergistic multi-drug combinations within a clinically relevant timeframe.

Keywords: Drug resistance; Drug-drug interaction; Multidrug combination; Organoid; Phenotypic screen; Synergy; Targeted RNAseq.


Conflict of interest statement

P.N.-S. is inventor of a patent of drug combination optimization methods. The other authors declare no competing interests.

Figures

Fig. 1
Fig. 1
TGMO-based screen for cell line specific ODCs in CRC 3D complex models. A Initial selection of drugs used in the TGMO-based screen B. Schematic representation of the TGMO platform. Regression coefficients generated from search 3 of single drug 1st order, drug-drug and single drug 2nd order drug interactions (red, burgundy and pink lines, respectively) in 3DccSW620 3DccLS174T (green/orange bars respectively) and the therapeutic window (stripped black bars). E Schematic representation of the generation of complex CRC FOLFOXIRI resistant 3D models, 3D-FXLSFXR and 3D-FXSWFXR and respective ODC identification. F 3D-FXSWFXR and G 3D-FXLSFXR (solid green/orange squared bars respectively) in the left panel. In yellow is highlighted the most robust drug interaction that is maintained in each final ODC. In the corresponding right panels, the activity of the ODCs, corresponding monotherapies (colored bars) and FOLFOXIRI (folinic acid [0.5 µM], 5-FU [10 µM], SN38 [0.1 µM] and oxaliplatin [0.5 µM], red bars) in CRC 3D models, and activity in 3DccCCD841 (stripped black bars) used to generate the therapeutic window (TW). Activity is measured by ATP levels vs. CTRL (< 0.15% DMSO). Data are presented as the mean of N = 2–3 independent experiments, error bars represent SD. Significance is determined by one-way ANOVA (regression models, left panel) and two-way ANOVA (activity graphs, right panel) with *p < 0.05, **p < 0.01 and ***p < 0.001
Fig. 2
Fig. 2
ODC search using adaptive lasso. Left panel represents the network diagram of the drugs composing best ODCs with an PTW that falls into the CCI (95%) in 3Dcc SW620 (A) and 3Dcc LS174T (B), or with a minimal cancer cell viability that falls into the CCI (95%) in 3D-FXSWFXR (C) and 3D-FXLSFXR (D). In the corresponding right panel, we considered the dosages of each drug using two colors stacked bar graphs, where the height of a bar is proportional to the presence of the drug at a given dosage in all combinations in the CCI
Fig. 3
Fig. 3
Cross-validation of ODCs activity on patient-derived organoids. A Schematic representation of our patient-derived organoids platform. B Representative images of PDOs from PCRC-1, PCRC-2 and PCRC-3 treated with ODCLSFXR. Scale bar represents 500 µm C. Activity of all four ODCs, and corresponding monotherapies and FOLFOXIRI (folinic acid [0.5 µM], 5-FU [10 µM], SN38 [0.1 µM] and oxaliplatin [0.5 µM], red bars) in PDOs from PCRC-1 (burgundy bars), PCRC-2 (dark green bars) and PCRC-3 (navy bars). Activity is measured by ATP levels vs. CTRL (< 0.15% DMSO). Data is presented as mean of N = 3 independent experiments, error bars represent SD. Significance is determined by two-way ANOVA with *p < 0.05, **p < 0.01 and ***p < 0.001
Fig. 4
Fig. 4
Gene expression profiles and genomic mutations landscape in PDOs. A Representative images of the PDOs established from patients PCRC-1–3, their mutations in known CRC-related genes, and TNM stage, CMS, CRIS and MSS/MSI classification. Scale bars represent 200 μm, B. Gene expression changes of established PDOs from PCRC1-3 after treatment with ODCLSFXR for 72 h (N = 3). Differentially expressed pathways (Genes with the |log2FC|> 2) are highlighted in the right panel
Fig. 5
Fig. 5
Optimization of patient specific ODCs. A Regression coefficients generated from search 1 of the TGMO-based screen on PDOs, describing single drug 1st order, drug-drug and single drug 2nd order drug-drug interactions (red, burgundy and pink lines, respectively) for CRC-1 B. CRC-2 and C. CRC-3 (left panels). In yellow is highlighted the most robust drug-drug interaction in each patient specific ODC. In the corresponding middle panels, activity of the patient specific ODCs, corresponding monotherapies (solid colored bars), and FOLFOXIRI (folinic acid [0.5 µM], 5-FU [10 µM], SN38 [0.1 µM] and oxaliplatin [0.5 µM], red bars) in each PDO and in CCD841 3Dcc (black stripped bars). Activity is measured by ATP levels vs. CTRL (< 0.15% DMSO). Data is presented as mean of N = 3 independent experiments, error bars represent SD. Significance is determined by one-way ANOVA (regression models, left panel) and two-way ANOVA (activity graphs, right panel) with *p < 0.05, **p < 0.01 and ***p < 0.001. In the right panels, representative images of PDO treated with their corresponding patient specific ODC. Scale bar represents 500 µm

References

    1. Cervantes A, et al. Metastatic colorectal cancer: ESMO Clinical Practice Guideline for diagnosis, treatment and follow-up☆. Ann Oncol. 2022 doi: 10.1016/j.annonc.2022.10.003. - DOI - PubMed
    1. Venook AP, et al. Effect of first-line chemotherapy combined with Cetuximab or bevacizumab on overall survival in patients with Kras wild-type advanced or metastatic colorectal cancer: a randomized clinical trial. JAMA. 2017;317(23):2392–2401. doi: 10.1001/jama.2017.7105. - DOI - PMC - PubMed
    1. Heinimann K, Müller H, Dobbie Z. Microsatellite instability in colorectal cancer. N Engl J Med. 2000;342(21):1607–1608. doi: 10.1056/NEJM200005253422111. - DOI - PubMed
    1. Gryfe R, et al. Tumor microsatellite instability and clinical outcome in young patients with colorectal cancer. N Engl J Med. 2000;342(2):69–77. doi: 10.1056/nejm200001133420201. - DOI - PubMed
    1. Starostik P, Müller-Hermelink HK. Diagnosis of microsatellite instability-positive colorectal cancer. Expert Rev Mol Diagn. 2001;1(1):71–80. doi: 10.1586/14737159.1.1.71. - DOI - PubMed