. 2023 Jul;17(7):1173-1191.
doi: 10.1002/1878-0261.13431. Epub 2023 Apr 22.

Hypoxia-mediated regulation of DDX5 through decreased chromatin accessibility and post-translational targeting restricts R-loop accumulation

Affiliations

Hypoxia-mediated regulation of DDX5 through decreased chromatin accessibility and post-translational targeting restricts R-loop accumulation

Katarzyna B Leszczynska et al. Mol Oncol. 2023 Jul.

Abstract

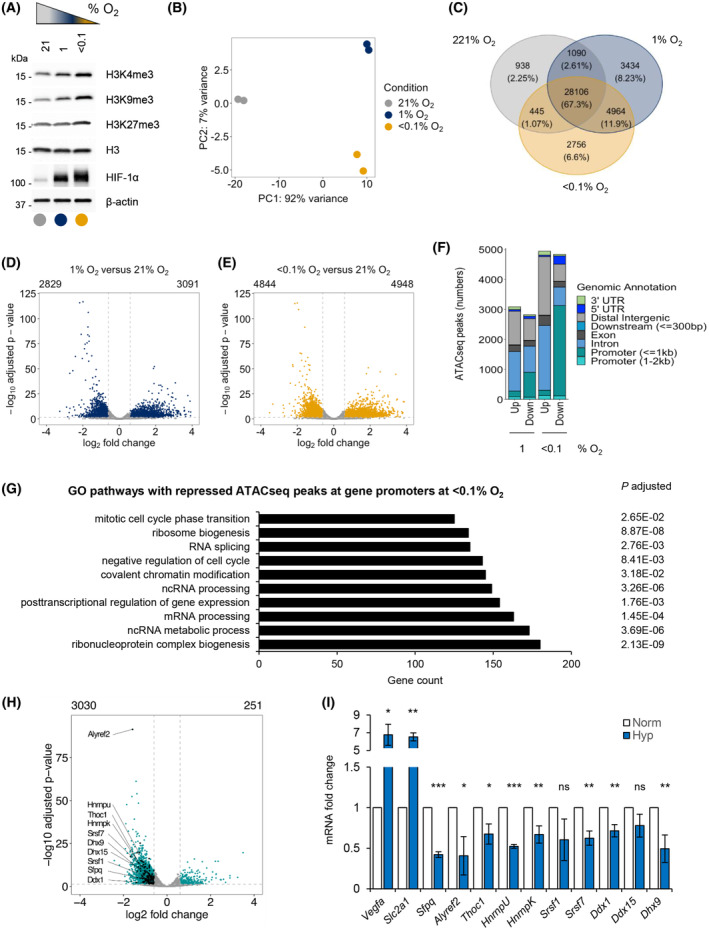
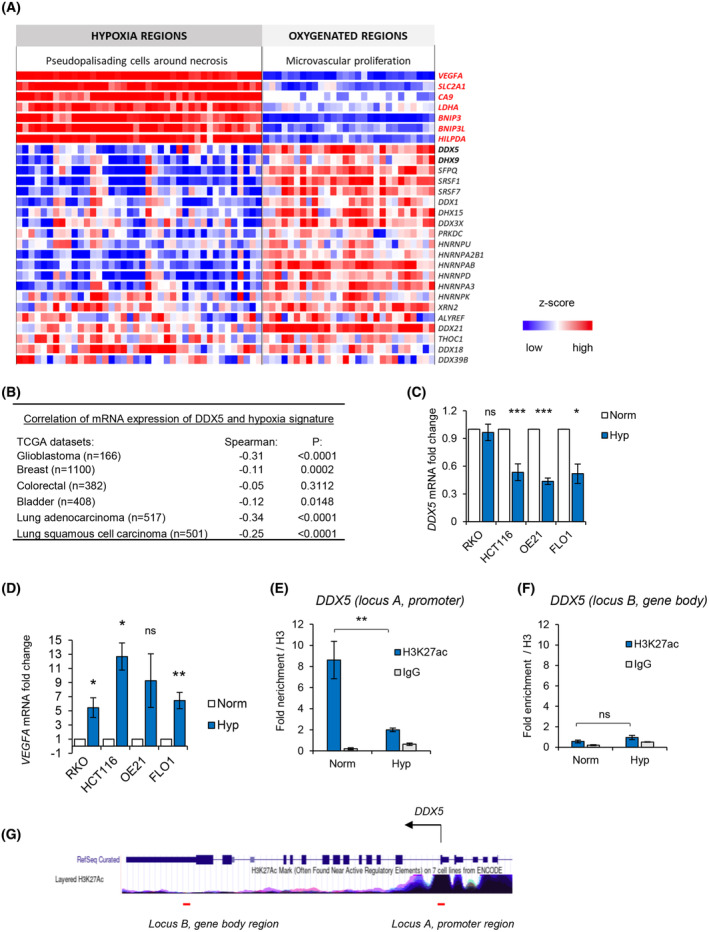
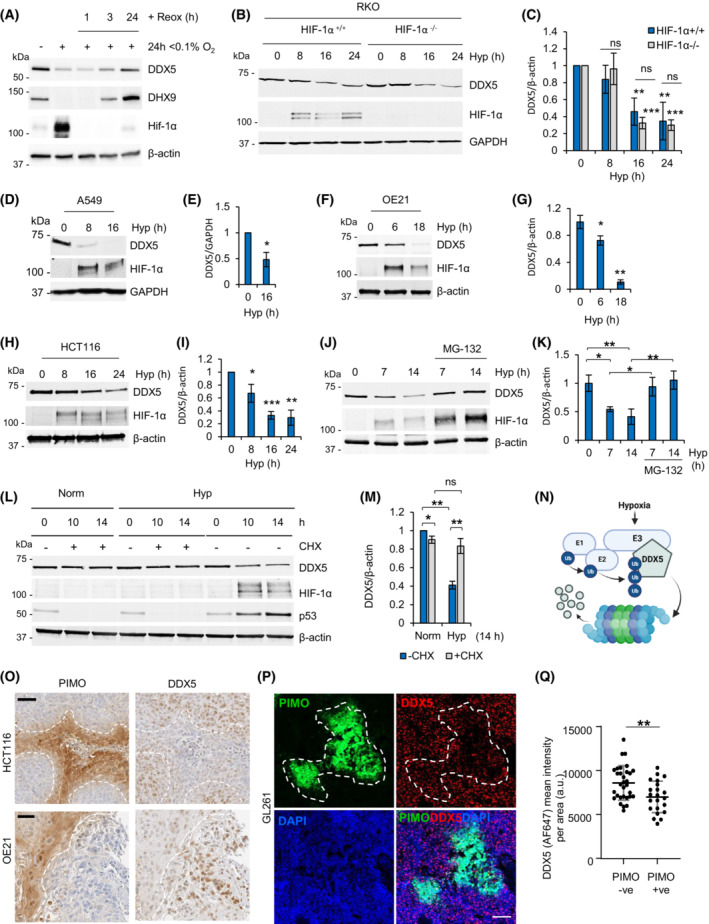
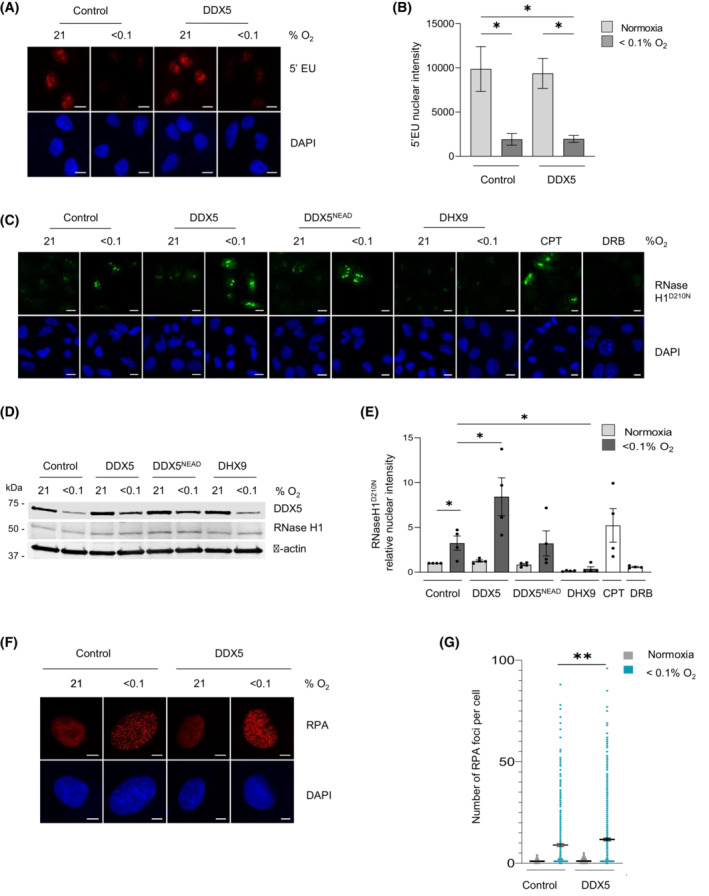
Local hypoxia occurs in most solid tumors and is associated with aggressive disease and therapy resistance. Widespread changes in gene expression play a critical role in the biological response to hypoxia. However, most research has focused on hypoxia-inducible genes as opposed to those that are decreased in hypoxia. We demonstrate that chromatin accessibility is decreased in hypoxia, predominantly at gene promoters and specific pathways are impacted including DNA repair, splicing, and the R-loop interactome. One of the genes with decreased chromatin accessibility in hypoxia was DDX5, encoding the RNA helicase, DDX5, which showed reduced expression in various cancer cell lines in hypoxic conditions, tumor xenografts, and in patient samples with hypoxic tumors. Most interestingly, we found that when DDX5 is rescued in hypoxia, replication stress and R-loop levels accumulate further, demonstrating that hypoxia-mediated repression of DDX5 restricts R-loop accumulation. Together these data support the hypothesis that a critical part of the biological response to hypoxia is the repression of multiple R-loop processing factors; however, as shown for DDX5, their role is specific and distinct.

Keywords: ATACseq; DDX5; R-loops; hypoxia.


Conflict of interest statement

The authors declare no conflict of interest.

Figures

Fig. 1
Fig. 1
Oxygen‐dependent chromatin alterations lead to a loss of promoter accessibility of numerous pathways, including RNA processing factors. (A) GL261 cell line was exposed to 21%, 1% or < 0.1% O2 for 16 h and subjected to western blotting for the histone modifications indicated. HIF‐1α was used as a hypoxia control. A representative western blot of three biological replicates is shown. (B) GL261 cells were exposed to 16 h of normoxia (21% O2) or two conditions of hypoxia (1% and < 0.1% O2). Samples were fixed and ATACseq carried out. Principal component analysis of ATACseq peaks for the three oxygen tensions is shown. (C) Venn diagram showing hypoxia specific or common ATACseq peaks detected in all oxygen conditions from (B). The percentage of peaks in the total amount of peaks is shown for each condition. (D) A volcano plot showing differentially altered ATACseq peaks in 1% O2 versus 21% O2. Statistically significant peaks with FDR < 0.05 and |log2 fold change| ≥ 0.6 are marked in blue. (E) A volcano plot showing differentially altered ATACseq peaks in < 0.1% O2 versus 21% O2. Statistically significant peaks with FDR < 0.05 and |log2 fold change| ≥ 0.6 are marked in yellow. (F) Differentially regulated ATACseq peaks from parts (D and E) annotated to distinct genomic regions at 1% or < 0.1% O2 in relation to normoxic control. ‘Up’ or ‘Down’ marks significantly increased or decreased peaks, respectively, for each hypoxic condition in relation to normoxia. (G) Top 10 Gene Ontology (GO) pathways (based on the highest gene count) associated with genes that had decreased ATACseq peaks at their promoters. Adjusted P value indicates statistical significance for each pathway shown. (H) A volcano plot showing differentially regulated ATACseq peaks at the gene promoters in cells treated with < 0.1% O2, with significantly up‐regulated 251 peaks and 3030 downregulated peaks. Statistically significant peak changes were annotated with green dots (FDR < 0.05 and |log2 fold change| ≥ 0.6). Black dots mark all significantly downregulated peaks for gene promoters of genes from the GO pathway ‘RNA splicing’ (GO:0008380) and some names of these genes are indicated (full list in Table S4). (I) qPCR validation of hypoxia‐dependent repression of splicing factors indicated in (H) in GL261 cell line treated for 16 h at < 0.1% O2. Mean ± standard deviation expression is shown from three biological repeats. Vegfa and Slc2a1 were used as positive hypoxia‐inducible controls. Statistical significance was calculated with two‐tailed Student's t‐test for each gene expression tested in hypoxia compared to normoxia (*P < 0.05, **P < 0.01, ***P < 0.001, ns, nonsignificant).
Fig. 2
Fig. 2
Loss of chromatin accessibility in hypoxia is mirrored by gene expression changes, including the loss of mRNA expression of DDX5. (A) A heatmap showing a z‐score expression of hypoxia markers as well as RNA processing factors in two anatomical regions of glioblastoma, including ‘microvascular proliferation’ region and ‘pseudopalisading cells around necrosis.’ Data was accessed via IvyGAP Glioblastoma project at http://glioblastoma.alleninstitute.org/ and selected genes are shown. Each column represents a separate sample for a given region and rows show expression of particular genes in these samples. (B) Expression of DDX5 (mRNA) was correlated with the hypoxia metagene signature in the indicated TCGA cancer patient cohorts: breast invasive carcinoma, colorectal adenocarcinoma, glioblastoma, bladder urothelial carcinoma, lung adenocarcinoma, and lung squamous cell carcinoma. The numbers of patient samples are shown in brackets. Spearman's rank correlation coefficient and P values are shown for the Log10 median expression of DDX5 and hypoxic signature. (C, D) The indicated cell lines were exposed to hypoxia (< 0.1% O2) for 18 h. Expression of DDX5 (C) and VEGFA (D) was determined by qPCR and normalized to 18S. Statistical significance was calculated with two‐tailed Student's t‐test for each cell line based on three biological replicates (*P < 0.05, **P < 0.01, ***P < 0.001, ns, nonsignificant). (E, F) HCT116 cells were exposed to 16 h of hypoxia (< 0.1% O2) followed by chromatin immunoprecipitation with H3, H3K27ac and IgG antibodies and qPCR analysis. Fold enrichment for H3K27ac and IgG normalized to total H3 enrichment is shown as mean ± standard deviation from three independent experiments. Statistical significance was calculated with two‐tailed Student's t‐test (**P < 0.01, ns, nonsignificant). (G) The DDX5 locus taken from the UCSC genome browser (https://genome.ucsc.edu/) at the human GRCh37/hg19 genome assembly is shown with a track underneath showing the layered H3K27ac profile across the DDX5 gene. Red lines underneath the track indicate the binding site of ChIP‐qPCR primers amplifying the promoter region (locus A) and gene body region (locus B) used in ChIP‐qPCR analysis in (E and F).
Fig. 3
Fig. 3
Hypoxia leads to the active repression of DDX5 protein. (A) GL261 cells were exposed to hypoxia (Hyp, 0.1% O2) for 24 h followed by reoxygenation (to 21% O2) for the indicated times following hypoxia. Western blotting was carried out for the antibodies shown (representative of three independent experiments). (B, C) RKOHIF‐1α+/+ and RKOHIF‐1α−/− were exposed to hypoxia (< 0.1% O2) for the times indicated and subjected to western blotting with the antibodies shown (representative of at least three biological replicates). Densitometry is shown in part (C). (D–I) A549, OE21, and HCT116 cell lines were exposed to hypoxia (Hyp, 0.1% O2) for the times indicated followed by western blotting for DDX5 as well as HIF‐1α (hypoxic marker) and β‐actin (loading control). Representative blots from at least three independent experiments are shown. Densitometry for the biological replicates showing hypoxia‐dependent repression of DDX5 is shown. (J, K) HCT116 cells were exposed to hypoxia (Hyp, < 0.1% O2) and MG‐132 (5 μm) as indicated and western blotting was carried out with the antibodies shown. Densitometry for three biological replicates is shown in part (K). (L, M) HCT116 cells were treated with 25 μg·mL−1 cycloheximide (CHX) in hypoxic (Hyp, < 0.1% O2) or normoxic (Norm, 21% O2) conditions for the times indicated and analyzed with western blotting. Densitometry for three biological replicates is shown in part (M). (N) A scheme showing hypothesis of hypoxia‐inducible degradation of DDX5 via proteasome. The scheme was drawn with BioRender.com. (O) Sequential sections from HCT116 and OE21 tumor xenografts using the cell lines indicated (HCT116 or OE21) were stained for hypoxia with antipimonidazole hyoxyprobe‐1 (PIMO) and DDX5 antibodies. Nuclei were counterstained with hematoxylin Scale bar = 50 μm. The outline of PIMO‐positive (brown) staining is shown by the dashed white line. (P) PFA‐fixed GL261 tumor xenografts were sectioned and subjected to immunofluorescent staining for hypoxia (PIMO) and DDX5. Nuclei were counterstained with DAPI. Scale bar = 100 μm. The outline of PIMO‐positive (FITC) staining is shown by the dashed white line. (Q) Mean fluorescence intensity ± standard deviation of DDX5 signal (labeled with Alexa Fluor‐647) in GL261 tumors from part (P) was measured in hypoxic (PIMO +ve) and normoxic (PIMO −ve) image areas using zen2 software (Zeiss). A total of 22 hypoxic areas and 31 normoxic areas were analyzed and two‐tailed nonparametric Mann–Whitney test shows statistical significance (P‐value 0.007, **).
Fig. 4
Fig. 4
Rescuing DDX5 expression in hypoxia leads to accumulation of R‐loops. (A) A549 cells were transfected with myc‐tagged DDX5 or control vector and exposed to hypoxia (8 h) with 5'EU (0.5 mm) added for the final hour. Staining for 5'EU was then carried out. Representative images are shown (scale bar = 10 μm). 5'EU staining in red, DAPI (blue) shows the nucleus. (B) Nuclear Intensity of 5'EU staining from A was determined. Data represents the mean expression and SEM from three independent experiments. Statistical significance was calculated with an unpaired Student's t‐test for each indicated condition (*P < 0.05). (C) A549 cells were co‐transfected with RNase H1D210N together with myc‐tagged DDX5, myc‐tagged DDX5NEAD, or with DHX9 and exposed to hypoxia for 18 h. CPT (10 μm, 20 min) or DRB (100 μm, 1 h) were used as a positive and negative controls for R‐loops, respectively. Representative images for R‐loop visualization with V5‐RNase H1D210N fluorescence are shown (scale bar = 10 μm). V5 fluorescence is shown in green, DAPI (blue) shows the nucleus. (D) Western blot analysis confirms expression of DDX5 and RNase H1D210N across conditions shown in part (C). (E) Quantification of fluorescent intensity from part (C). A minimum of 100 cells were included per condition. Data represent the mean expression and SEM from four independent experiments. Statistical significance was determined with an unpaired Student's t‐test for each indicated condition (*P < 0.05). (F) A549 cells were transfected as indicated and staining for RPA foci was then carried out. Representative images are shown (scale bar = 10 μm). RPA staining in red, DAPI (blue) shows the nucleus. (G) Quantification of the number of foci per cell in part (F) was determined. Data represents the mean expression and SEM from three independent experiments, each dot represents a cell and a minimum of 100 cells were imaged per treatment. Statistical significance was calculated with an unpaired Student's t‐test for each indicated condition (**P < 0.01).

References

    1. Raymond J, Segrè D. The effect of oxygen on biochemical networks and the evolution of complex life. Science. 2006;311:1764–7. 10.1126/science.1118439 - DOI - PubMed
    1. Liao C, Zhang Q. Understanding the oxygen‐sensing pathway and its therapeutic implications in diseases. Am J Pathol. 2020;190:1584–95. 10.1016/j.ajpath.2020.04.003 - DOI - PMC - PubMed
    1. Hammond EM, Asselin MC, Forster D, O'Connor JPB, Senra JM, Williams KJ. The meaning, measurement and modification of hypoxia in the laboratory and the clinic. Clin Oncol. 2014;26:277–88. 10.1016/j.clon.2014.02.002 - DOI - PubMed
    1. Chan N, Pires IM, Bencokova Z, Coackley C, Luoto KR, Bhogal N, et al. Contextual synthetic lethality of cancer cell kill based on the tumor microenvironment. Cancer Res. 2010;70:8045–54. 10.1158/0008-5472.CAN-10-2352 - DOI - PMC - PubMed
    1. Santos‐Pereira JM, Aguilera A. R loops: new modulators of genome dynamics and function. Nat Rev Genet. 2015;16:583–97. 10.1038/nrg3961 - DOI - PubMed

Publication types