. 2023 Jun;10(16):e2206768.
doi: 10.1002/advs.202206768. Epub 2023 Apr 4.

ERK Inhibition Promotes Engraftment of Allografts by Reprogramming T-Cell Metabolism

Affiliations

ERK Inhibition Promotes Engraftment of Allografts by Reprogramming T-Cell Metabolism

Xiaosheng Tan et al. Adv Sci (Weinh). 2023 Jun.

Abstract

Extracellular regulated protein kinases (ERK) signaling is a master regulator of cell behavior, life, and fate. Although ERK pathway is shown to be involved in T-cell activation, little is known about its role in the development of allograft rejection. Here, it is reported that ERK signaling pathway is activated in allograft-infiltrating T cells. On the basis of surface plasmon resonance technology, lycorine is identified as an ERK-specific inhibitor. ERK inhibition by lycorine significantly prolongs allograft survival in a stringent mouse cardiac allotransplant model. As compared to untreated mice, lycorine-treated mice show a decrease in the number and activation of allograft-infiltrated T cells. It is further confirmed that lycorine-treated mouse and human T cells are less responsive to stimulation in vitro, as indicated by their low proliferative rates and decreased cytokine production. Mechanistic studies reveal that T cells treated with lycorine exhibit mitochondrial dysfunction, resulting in metabolic reprogramming upon stimulation. Transcriptome analysis of lycorine-treated T cells reveals an enrichment in a series of downregulated terms related to immune response, the mitogen-activated protein kinase cascade, and metabolic processes. These findings offer new insights into the development of immunosuppressive agents by targeting the ERK pathway involved in T-cell activation and allograft rejection.

Keywords: allograft rejection; extracellular regulated protein kinases (ERK); lycorine; metabolism; mitochondria.


Conflict of interest statement

The authors declare no conflict of interest.

Figures
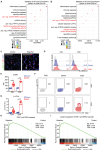
Figure 1
Figure 1
ERK signaling is activated in T cells during allograft rejection. A,B) Scatter plot showing the Gene Ontology (GO) enrichment results in the upregulated genes in graft‐infiltrating A) CD4+ T cells and B) CD8+ T cells. The dot size indicates the relative number of differentially expressed genes contained in the GO terms and the shade of the dots indicates the adjusted P value (padj) of the enrichment. C) Immunofluorescent staining of phosphorylated ERK1/2 (p‐ERK1/2, green) and CD3 (red) in graft sections from syngeneic (Control) or allogenic (Rejection) transplantation. D) Representative zebra plot and E) statistical graph for intranuclear phosphorylated ERK1/2 (p‐ERK1/2) levels in splenic and graft‐infiltrating T cell subsets. Fluorescent‐minus‐one (FMO) samples were used as isotype controls. F) Representative zebra plot and G) statistical graph for intranuclear phosphorylated c‐Fos (p‐c‐Fos) levels in splenic and graft‐infiltrating T cell subsets. H,I) Gene Set Enrichment Analysis (GSEA) shows an enrichment of ERK1/2‐related pathway up‐ and downregulated genes in the transcriptome of T cells from a rejected renal allograft. Data are shown as means ± SEM of at least three independent experiments. **P < 0.01, and ***P < 0.001, Student's t‐test.
Figure 2
Figure 2
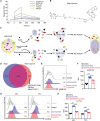
Identification lycorine as an ERK‐specific inhibitor. A) In SPR assays, recombinant human ERK1 protein was immobilized on a BIAcore CM5 sensor chip, followed by analysis its interaction with lycorine at the indicated concentrations. B) Structure of biotinylated lycorine. C) The schematic depicts the procedure for the affinity‐based approach to identify target(s) of lycorine from protein extracts derived from murine splenocytes. MS, mass spectrometry. D) The Venn diagram shows the percentages of overlapping and unique proteins pulled‐down by biotin and biotinylated lycorine. E,F) Flow cytometry staining for phosphorylated‐ERK1/2 (p‐ERK1/2) in splenocytes without stimulation, with anti‐CD3/anti‐CD28 bead stimulation, or with anti‐CD3/anti‐CD28 beads stimulation in the presence of lycorine (200 nm) for 15 min (n = 3 for each group). E) Representative histogram with mean fluorescence intensity and F) bar graph with mean ± SEM. G–H) Flow cytometry staining for phosphorylated‐c‐Fos (p‐c‐Fos) in CD4+ cells receiving the various treatments (n = 3 for each group), after 48 or 72 h later. G) A representative histogram with mean fluorescence intensity and H) bar graph are shown. Data are shown as means ± SEM and from one of three independent experiments. *P < 0.05, and ***P < 0.001, Student's t‐test.
Figure 3
Figure 3
Inhibition of ERK activation by lycorine prolongs graft survival in heart transplanted mice. Recipient mice (C57BL/6) were intraperitoneally injected with lycorine for 3 d before heart transplantation. Hearts from Balb/c mice were transplanted to C57BL/6 mice. Allografts were harvested for analysis at the time of rejection or at the indicated time points. As a control, recipient mice received only an injection of the same volume of PBS (Vehicle). A) The kinetics of cardiac allograft survival rates for all study groups are shown (n = 7 for each group). B–D) Allografts were harvested at day 7 post‐transplant. B) Gross observation of allografts in the PBS‐treated and lycorine‐treated (5 mg kg−1, b.i.d.) groups. C) Hematoxylin and eosin (H&E) staining was performed to assess pathological changes (upper and middle panel). For measurement of the T‐cell infiltration in allografts from each group, immunofluorescence for CD3 was performed (lower panel). Scale bars, 50 µm. D) Quantitative plots for CD3 staining cell counts per 103 cells in graft sections from each group (n = 6). E) Colocalization of phosphorylated ERK1/2 (p‐ERK1/2) and CD3 in graft sections from PBS‐ or lycorine‐treated recipients. Scale bars, 50 µm. Data are shown as means ± SEM and pooled from at least three independent experiments.*P < 0.05, and ***P < 0.001, A) Log‐rank (Mantel‐Cox) test and D) Student's t‐test.
Figure 4
Figure 4
Lycorine treatment inhibits T cell infiltration and function in cardiac allografts. On day 7 posttransplant, allograft‐infiltrated leukocytes were isolated from PBS‐treated mice (Vehicle) or lycorine‐treated mice (5 mg kg−1, b.i.d. Lycorine) were isolated and analyzed by flow cytometry. A) Counts of allograft‐infiltrated cells and CD45+ cells in each group (n = 6). B) Numbers of allograft‐infiltrated CD4+ T cells, CD8+ T cells, B cells and NK cells (n = 6). C) The expression of membrane CD69, CD25, OX40, and GITR on the surface of allograft‐infiltrated CD4+ T cells and CD8+ T cells was measured (n = 5). Values for mean fluorescence intensity (MFI) are shown. D) Bar graphs depict MFI values for PD1, CTLA4, LAG3, and TIM3 on T‐cell subsets (n = 5). E) Allograft‐infiltrated leukocytes were stimulated with a Cell Stimulation Cocktail (plus protein transport inhibitors) and intracellular staining was performed. Percentages of IFN‐γ + and TNF‐α + T‐cell subsets are shown (n = 5). F) Levels of CD107a expression on allograft‐infiltrating CD4+ T cells and CD8+ T cells from each group (n = 5). The graphs show the means ± SEM of three independent experiments. *P < 0.05, and **P < 0.01, Student's t‐test.
Figure 5
Figure 5
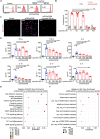
Lycorine inhibits mouse T‐cell proliferation, cytokine production, and immune reaction in vitro. Unsorted splenocytes or purified CD4+ T cells from C57BL/6 mice were stimulated with anti‐CD3/anti‐CD28 beads in the presence/absence of lycorine (200 nm or 400 nm). After 72 h, the cells were collected and analyzed. A,B) Purified CD4+ T cells were labeled with CellTrace Violet (CTV) dye before stimulation. Cell proliferation was measured by a CTV‐dilution assay. A) Representative histogram and B) bar graph showing percentages of divided cells in each group (n = 8). C) Splenocytes were stimulated for 48 h and then 5‐ethynyl‐2′‐deoxyuridine (EdU) was added. At 72 h, immunofluorescent staining for EdU was performed. Representative images of EdU staining in splenocytes without stimulation (Control), with anti‐CD3/anti‐CD28 stimulation (αCD3/αCD28), or with stimulation in the presence of lycorine (αCD3/αCD28+Lycorine 200 nm). Scale bars, 50 µm. D) Cytokine production in culture supernatant from purified CD4+ T cells receiving the various treatments was detected by CBA assay. Bar graphs show the concentrations of IFN‐γ, TNF‐α, IL‐6, IL‐10, IL‐17, and IL‐4 in the various treatment groups (n = 6 per group). E,F) RNA‐Seq analysis of for purified CD4+ T cells with anti‐CD3/anti‐CD28 stimulation or with anti‐CD3/anti‐CD28 stimulation in the presence of lycorine (200 nm). Scatter plots showing E) the Kyoto Encyclopedia of Genes and Genomes (KEGG) enrichment and F) GO enrichment results in the downregulated genes. The dot size indicates the relative number of differentially expressed genes and the shade of the dots indicates the adjusted P value (padj) of the enrichment. Data are shown as means ± SEM of at least three independent experiments. *P < 0.05, **P < 0.01, and ***P < 0.001, one‐way ANOVA.
Figure 6
Figure 6
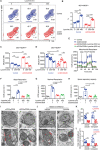
Lycorine treated T cells exhibit mitochondrial dysfunction. A–D) Purified CD4+ T cells were stimulated with anti‐CD3/anti‐CD28 beads in the presence/absence of lycorine (200 or 400 nm). After 24 h, cells were collected and stained with MitoTracker Green (MG), MitoTracker Deep Red (MDR), and MitoSOX. A) Representative zebra plot and B) bar graph for the percentage of MGhighMDRlow subsets (n = 6). C,D) Summary bar graphs depicting the MFI of MitoSOX in MGhighMDRhigh (left panel) and MGhighMDRlow (right panel) subsets in CD4+ T cells receiving the various treatments (n = 6). E–H) OCR of purified CD4+ cells with different treatment were measured under basal conditions and in response to oligomycin (oligo), FCCP, and rotenone plus antimycin A (Rot/AM). E) Real‐time OCR levels, F) baseline OCR levels, G) maximal OCR levels, and H) spare respiratory capacity (percent maximum OCR after FCCP injection of baseline OCR) in the indicated groups (n = 3–4 per group). I) Transmission electron microscope sections of mitochondria from CD4+ T cells in an in vitro experiment or J) graft‐infiltrating lymphocytes. K) Quantitative plots for crista number per mitochondrion and L) crista length per mitochondrion area in each group (n = 6). Scale bars, 500 nm. Bar graphs show the means ± SEM from one of three independent experiments. *P < 0.05, **P < 0.01, and ***P < 0.001, B,F,G,H) one‐way ANOVA, C,D) two‐way ANOVA, and K,L) Student's t‐test.
Figure 7
Figure 7
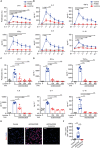
Lycorine treatment inhibits human T‐cells reactivity in response to stimulus. Peripheral blood mononuclear cells (PBMCs) from healthy donors were isolated by density gradient centrifugation. A,B) A mixed lymphocyte reaction was performed at various mixing ratios, and cell proliferation and cytokine levels were measured on day 6 and day 3, respectively. Lycorine (200 nm) or FK506 (200 nm) was added simultaneously with allogenic PBMCs. A) Percentages of proliferated PBMCs and B) levels of cytokines in the culture supernatant from the various groups are shown (n = 9). C,D) Dynabeads Human T‐Activator CD3/anti‐CD28 were used for stimulating PBMCs. After 72 h, C) PBMC proliferation and D) cytokine production were analyzed by flow cytometry (n = 4). E) Representative images of 5‐ethynyl‐2′‐deoxyuridine (EdU) staining and F) numbers of cells positively stained for EdU (per 1000 cell) in PBMCs without stimulation (Control), with anti‐CD3/anti‐CD28 stimulation (αCD3/αCD28), or with stimulation in the presence of lycorine (200 nm) (αCD3/αCD28+Lycorine). Scale bars, 50 µm. Data are shown as means ± SEM and pooled from at least three independent experiments. *P < 0.05, **P < 0.01, and ***P < 0.001, one‐way ANOVA.
Figure 8
Figure 8
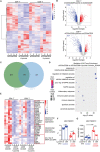
Lycorine‐mediated inhibition of ERK in human T cells downregulates the immune response and changes metabolic processes occurring in response to stimulation. CD4+ and CD8+ T cells were purified from four healthy individuals and stimulated with anti‐CD3/anti‐CD28 beads (αCD3/αCD28) or anti‐CD3/anti‐CD28 beads in the presence of lycorine (200 nm) (αCD3/αCD28+Lycorine). A) Clustered heatmap of significantly differentially expressed mRNAs in CD4+/CD8+ T cells receiving various treatments. B) Volcano plots indicate the significance of upregulated genes (red) and downregulated genes (blue) in αCD3/αCD28 and αCD3/αCD28+Lycorine‐treated CD4+ (upper)/CD8+ (bottom) T cells, with the number of differentially expressed genes. C) Venn diagram showing the overlapping of the downregulated mRNAs in CD4+ and CD8+ T cells after lycorine treatment. D) Scatter plot showing the GO enrichment results in the downregulated genes. The dot size indicates the relative number of differentially expressed genes contained in the GO terms, and the shade of the dots indicates the adjusted P‐value (padj) of the enrichment. E) Heat maps show standardized log expression (gene‐wise Z‐score) of selected DEGs between CD4+ and CD8+ T cells stimulated with anti‐CD3/anti‐CD28 + Lycorine versus CD4+ and CD8+ T cells stimulated with anti‐CD3/anti‐CD28. F,G) Human PBMCs were stimulated with anti‐CD3/anti‐CD28 beads in the presence/absence of lycorine (200 nm). After 24 h, cells were collected and stained with MG, MDR, and MitoSOX. F) Bar graph for the percentage of MGhighMDRlow subsets (n = 4). G) Summary bar graphs depicting the MFI of MitoSOX in MGhighMDRhigh subsets in CD3+ T cells receiving the various treatments (n = 4). Data are shown as means ± SEM and from one of three independent experiments. *P < 0.05, **P < 0.01, and ***P < 0.001, Student's t‐test.

References

    1. a) Bach J. F., Immunol. Today 1993, 14, 322; - PubMed
    2. b) Burt R. K., Traynor A. E., Pope R., Schroeder J., Cohen B., Karlin K. H., Lobeck L., Goolsby C., Rowlings P., Davis F. A., Stefoski D., Terry C., Keever‐Taylor C., Rosen S., Vesole D., Fishman M., Brush M., Mujias S., Villa M., Burns W. H., Blood 1998, 92, 3505; - PubMed
    3. c) Sayegh M. H., Carpenter C. B., N. Engl. J. Med. 2004, 351, 2761. - PubMed
    1. a) Ford M. L., Adams A. B., Pearson T. C., Nat. Rev. Nephrol. 2014, 10, 14; - PMC - PubMed
    2. b) Bantug G. R., Galluzzi L., Kroemer G., Hess C., Nat. Rev. Immunol. 2018, 18, 19. - PubMed
    1. Lim M. A., Kohli J., Bloom R. D., Transplant. Rev. (Orlando) 2017, 31, 10. - PubMed
    1. Nepom G. T., St Clair E. W., Turka L. A., Immunol. Rev. 2011, 241, 49. - PMC - PubMed
    1. Das S., Ariizumi K., P. D. Cruz, Jr. , Dermatitis 2012, 23, 195. - PMC - PubMed

Publication types