. 2023 Jul;601(13):2733-2749.
doi: 10.1113/JP284244. Epub 2023 Apr 25.

Graft-host coupling changes can lead to engraftment arrhythmia: a computational study

Affiliations

Graft-host coupling changes can lead to engraftment arrhythmia: a computational study

Chelsea E Gibbs et al. J Physiol. 2023 Jul.

Abstract

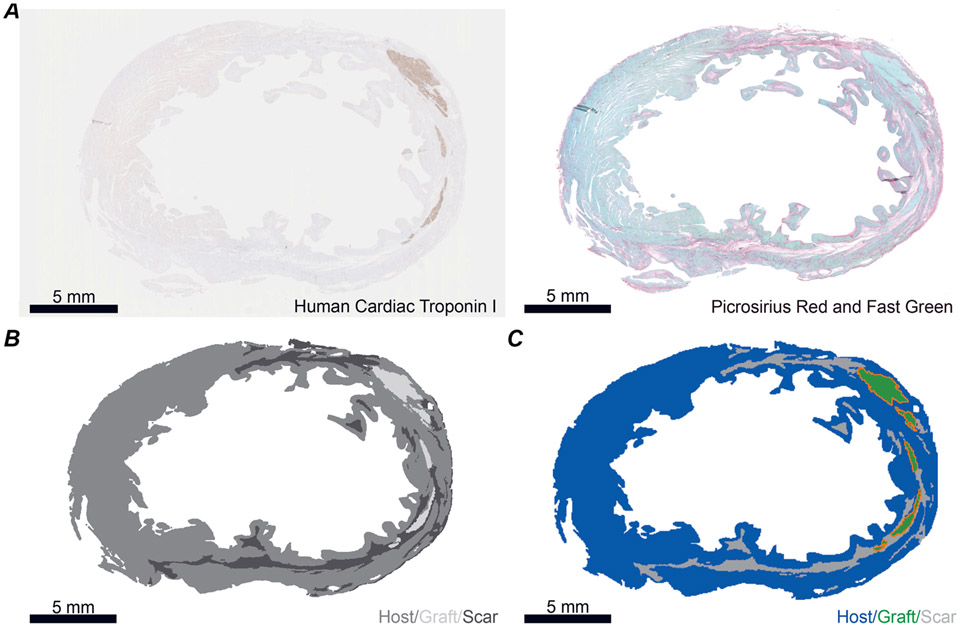
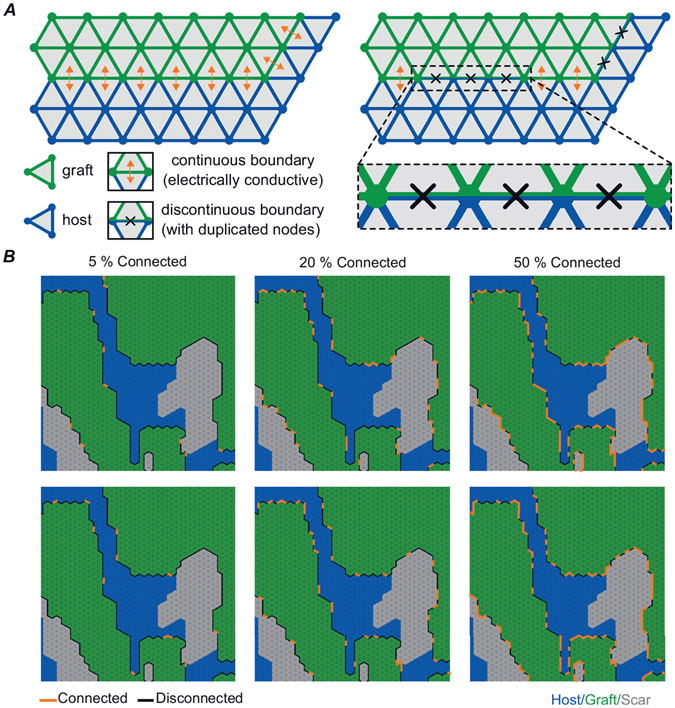
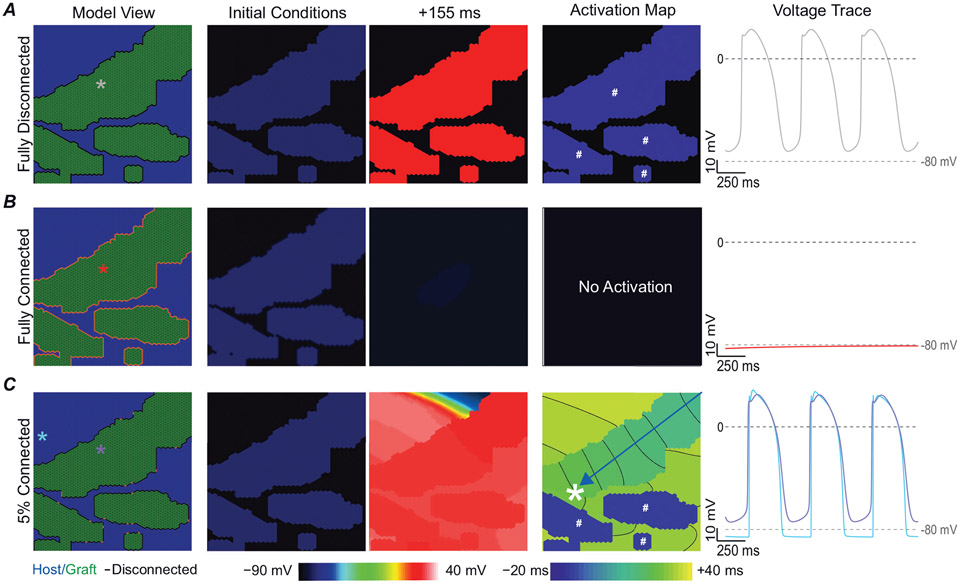
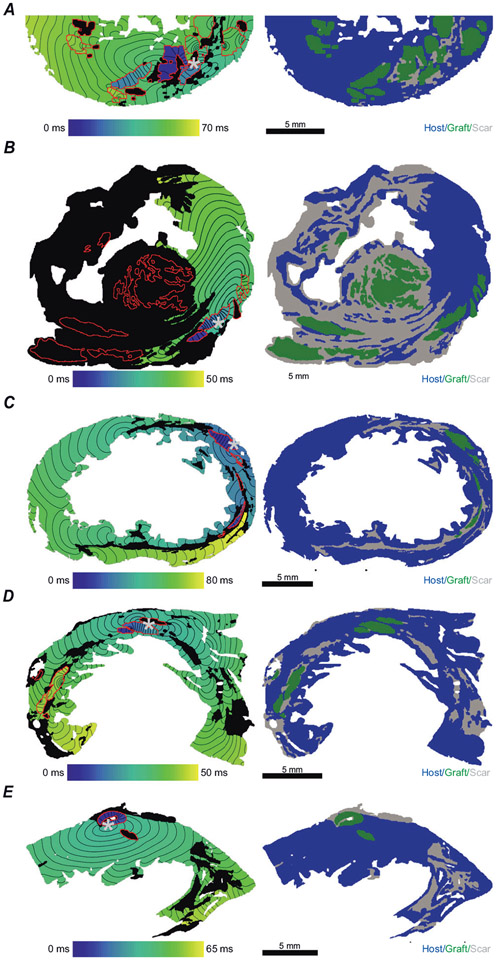
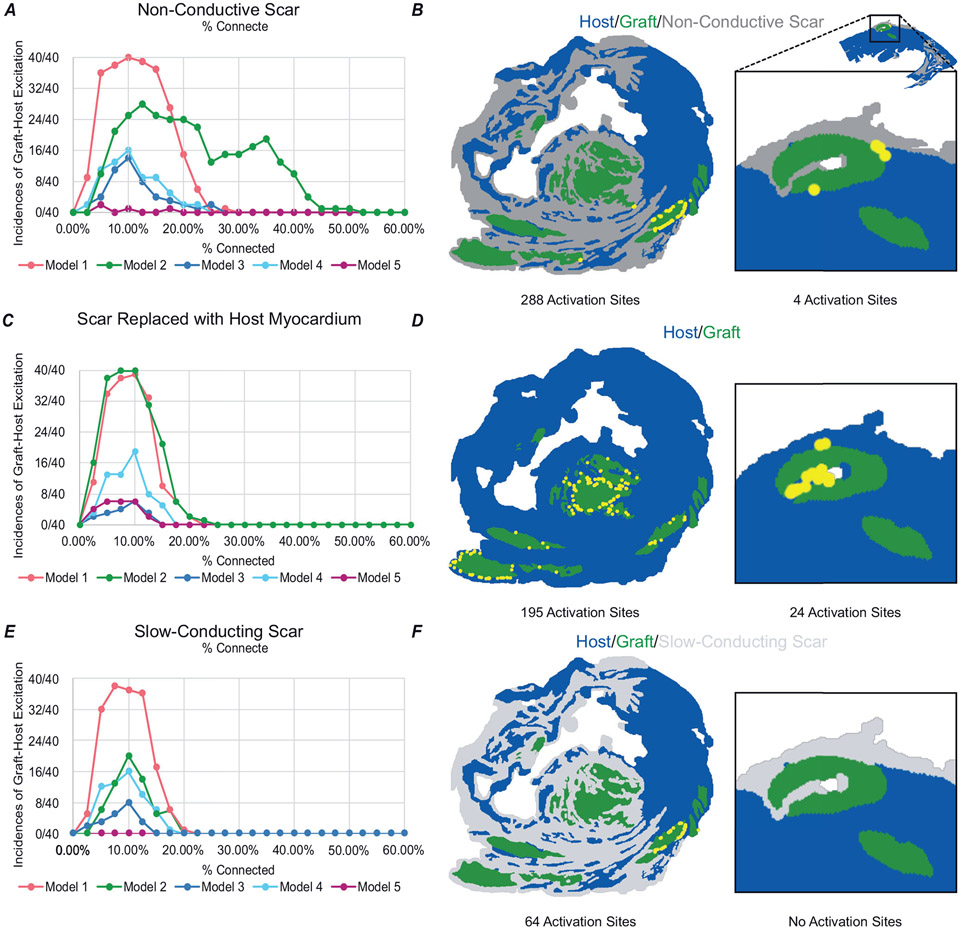
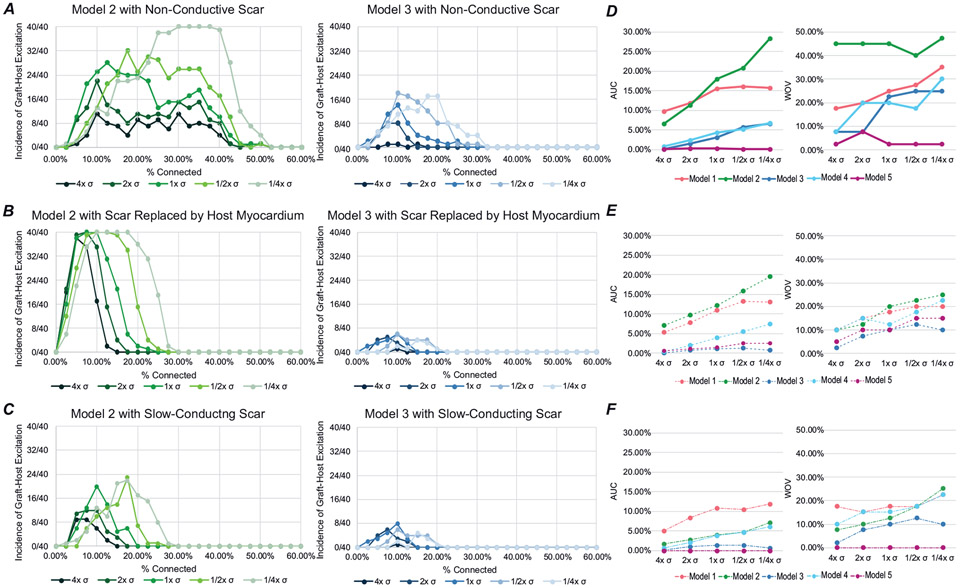
After myocardial infarction (MI), a significant portion of heart muscle is replaced with scar tissue, progressively leading to heart failure. Human pluripotent stem cell-derived cardiomyocytes (hPSC-CM) offer a promising option for improving cardiac function after MI. However, hPSC-CM transplantation can lead to engraftment arrhythmia (EA). EA is a transient phenomenon arising shortly after transplantation then spontaneously resolving after a few weeks. The underlying mechanism of EA is unknown. We hypothesize that EA may be explained partially by time-varying, spatially heterogeneous, graft-host electrical coupling. Here, we created computational slice models derived from histological images that reflect different configuration of grafts in the infarcted ventricle. We ran simulations with varying degrees of connection imposed upon the graft-host perimeter to assess how heterogeneous electrical coupling affected EA with non-conductive scar, slow-conducting scar and scar replaced by host myocardium. We also quantified the effect of variation in intrinsic graft conductivity. Susceptibility to EA initially increased and subsequently decreased with increasing graft-host coupling, suggesting the waxing and waning of EA is regulated by progressive increases in graft-host coupling. Different spatial distributions of graft, host and scar yielded markedly different susceptibility curves. Computationally replacing non-conductive scar with host myocardium or slow-conducting scar, and increasing intrinsic graft conductivity both demonstrated potential means to blunt EA vulnerability. These data show how graft location, especially relative to scar, along with its dynamic electrical coupling to host, can influence EA burden; moreover, they offer a rational base for further studies aimed to define the optimal delivery of hPSC-CM injection. KEY POINTS: Human pluripotent stem cell-derived cardiomyocytes (hPSC-CM) hold great cardiac regenerative potential but can also cause engraftment arrhythmias (EA). Spatiotemporal evolution in the pattern of electrical coupling between injected hPSC-CMs and surrounding host myocardium may explain the dynamics of EA observed in large animal models. We conducted simulations in histology-derived 2D slice computational models to assess the effects of heterogeneous graft-host electrical coupling on EA propensity, with or without scar tissue. Our findings suggest spatiotemporally heterogeneous graft-host coupling can create an electrophysiological milieu that favours graft-initiated host excitation, a surrogate metric of EA susceptibility. Removing scar from our models reduced but did not abolish the propensity for this phenomenon. Conversely, reduced intra-graft electrical connectedness increased the incidence of graft-initiated host excitation. The computational framework created for this study can be used to generate new hypotheses, targeted delivery of hPSC-CMs.

Keywords: Arrhythmia; computer modelling; hPSC-CM.


Figures

Figure 1.
Figure 1.. Deriving slice models from histological images of post-MI macaque ventricles
A, example histology images used to generate slice model. Left: human cardiac troponin I stained for graft. Right: Fast Green stained for myocardium and Picrosirius Red stained for collagen (i.e. scar). B, example thresholded image. Areas that are within the tissue boundary but are delineated as neither scar nor graft are deemed host myocardium. C, example slice model with grafts outlined in orange. All scale bars: 5 mm.
Figure 2.
Figure 2.. Illustration of the process used to map myocardial fibre orientations into each model
Vectors (black arrows) show fibre orientations calculated using the Laplacian-based approach (see text). Colour map shows the solution to the Laplacian problem with boundary conditions imposed on the endocardial (ϕ = 0) and epicardial (ϕ = 1) surfaces. A, Model 1; B, Model 3.
Figure 3.
Figure 3.. Schematic representation of how graft–host coupling was varied
A, schematic illustration of continuous vs. discontinuous finite element modelling. B, two example permutations each are shown for pc levels of 5%, 20% and 50% connected. Each image has regions of graft (green), host (blue) and scar (grey) labelled. Edges of graft connected to surrounding tissue are shown with orange lines and edges that are disconnected are shown with black lines.
Figure 4.
Figure 4.. Modifications made to published hPSC-CM model
A, schematic representation showing modifications made to ionic model. IK1 was blocked and If was doubled. B, RTqPCR analysis of wild-type hPSC-CMs at day 14 after differentiation. Data shown as means (SD) of 3 independent biological replicates. HK, housekeeping gene. Statistical differences are reported by one-way ANOVA with Šidák’s correction. Bolded P-values denote statistical significance. C, action potential traces of published model (black) compared to modified model (red). The spontaneous beating rate of modified model showed an increased beating rate of 1.9 Hz compared to 1.1 Hz in the published model.
Figure 5.
Figure 5.. Fully coupled graft–host myocardium does not facilitate any graft-initiated host excitation
A, fully isolated grafts beat spontaneously in isolation. B, grafts fully coupled to host myocardium, showed impaired propagation due to dissipation of spontaneous depolarization originating from graft into surrounding myocardium. C, when graft is 5% coupled to host myocardium graft-initiated host excitation occurs (white asterisk). Column 1 shows the labelled model with coloured asterisks denote the location of voltage traces shown in column 5. Column 2 shows voltage initial conditions. Column 3 shows the voltage at +155 ms. Column 4 shows the activation map. Grafts that spontaneously excite in isolation before the lead pacemaker graft are denoted by the white # symbol. Blue arrow highlights wavefront path. Voltage traces are shown starting at t = 500 ms to highlight the equilibrium conditions after the initial conditions have resolved.
Figure 6.
Figure 6.. In all models at 10% connected at least one permutation had graft-initiated host excitation
A-E, models 1–5. The left panel shows an example activation map at 10% connected. The grey asterisks denote site of graft-initiated host excitation. The right panel shows the geometry of the mesh labelled with graft (green), host (blue) and non-conductive scar (grey). All scale bars: 5 mm.
Figure 7.
Figure 7.. Engraftment arrhythmia is dynamically determined by graft–host connectedness
A-C, incidence of graft-initiated host excitation across all pc levels for all five models, (A) with non-conductive scar, (B) scar replaced by host myocardium, and (C) slow-conducting scar. D, Model 2 at 1 × σ with non-conductive scar had 288 activation sites localized to a few grafts and Model 5 had 4 activation sites. E, when scar was replaced with host myocardium at 1 × σ, Model 2 had only 195 activation sites in more widespread locations whereas Model 5 had an increase to 24 activation sites. F, when non-conductive scar was replaced by slow-conducting scar, Model 2 had only 64 activation sites and Model 5 had none.
Figure 8.
Figure 8.. Increase in conductivity within the graft and the absence of scar decreases the instances of graft-initiated host excitation in most models
A–C, incidence of graft-initiated host excitation with scar at pc = 0–60% for all conductivities tested for Model 2 (green) and Model 3 (blue) with non-conductive scar (A), with scar replaced by host myocardium (B), and slow-conducting scar (C). D–F, the AUC and WOV for all models with non-conductive scar (D), with scar replaced by host myocardium (E), and slow-conducting scar (F).

Similar articles

Cited by

References

    1. Arevalo HJ, Vadakkumpadan F, Guallar E, Jebb A, Malamas P, Wu KC, & Trayanova NA (2016). Arrhythmia risk stratification of patients after myocardial infarction using personalized heart models. Nature Communications, 7(1), 11437. - PMC - PubMed
    1. Bahit MC, Kochar A, & Granger CB (2018). Post-myocardial infarction heart failure. JACC Heart Failure, 6(3), 179–186. - PubMed
    1. Balaban G, Costa CM, Porter B, Halliday B, Rinaldi CA, Prasad S, Plank G, Ismail TF, & Bishop MJ (2020). 3D electrophysiological modeling of interstitial fibrosis networks and their role in ventricular arrhythmias in Non-ischemic cardiomyopathy IEEE Transactions on Bio-Medical Engineering, 67(11), 3125–3133. - PMC - PubMed
    1. Bergmann O, Bhardwaj RD, Bernard S, Zdunek S, Barnabé-Heider F, Walsh S, Zupicich J, Alkass K, Buchholz BA, Druid H, Jovinge S, & Frisén J (2009). Evidence for cardiomyocyte renewal in humans. Science, 324(5923), 98–102. - PMC - PubMed
    1. Bertero A, & Murry CE (2018). Hallmarks of cardiac regeneration. Nature Reviews Cardiology, 15(10), 579–580. - PMC - PubMed

Publication types