. 2023 Apr 4:12:e78349.
doi: 10.7554/eLife.78349.

Prefrontal PV interneurons facilitate attention and are linked to attentional dysfunction in a mouse model of absence epilepsy

Affiliations

Prefrontal PV interneurons facilitate attention and are linked to attentional dysfunction in a mouse model of absence epilepsy

Brielle Ferguson et al. Elife. .

Abstract

Absence seizures are characterized by brief periods of unconsciousness accompanied by lapses in motor function that can occur hundreds of times throughout the day. Outside of these frequent moments of unconsciousness, approximately a third of people living with the disorder experience treatment-resistant attention impairments. Convergent evidence suggests prefrontal cortex (PFC) dysfunction may underlie attention impairments in affected patients. To examine this, we use a combination of slice physiology, fiber photometry, electrocorticography (ECoG), optogenetics, and behavior in the Scn8a+/-mouse model of absence epilepsy. Attention function was measured using a novel visual attention task where a light cue that varied in duration predicted the location of a food reward. In Scn8a+/-mice, we find altered parvalbumin interneuron (PVIN) output in the medial PFC (mPFC) in vitro and PVIN hypoactivity along with reductions in gamma power during cue presentation in vivo. This was associated with poorer attention performance in Scn8a+/-mice that could be rescued by gamma-frequency optogenetic stimulation of PVINs. This highlights cue-related PVIN activity as an important mechanism for attention and suggests PVINs may represent a therapeutic target for cognitive comorbidities in absence epilepsy.

Keywords: PV; attention; epilepsy; gamma; interneurons; mouse; neuroscience; prefrontal cortex.

Plain language summary

People who experience absence seizures may go through brief lapses in consciousness hundreds of times a day. They also often have difficulties engaging and remaining focused on a task, which can severely limit their ability to study, work and go through their day-to-day life. These impairments in attention persist even when medication puts a stop to the seizures, suggesting that they are not directly linked to the epileptic episodes. In fact, recent work has indicated that these deficits may be caused instead by alterations in the activity of the prefrontal cortex, the brain area which helps to regulate attention and impulsivity. However, the exact nature of these changes remains unclear, making it difficult to design treatments that could improve patients’ quality of life. To explore this question, Ferguson et al. developed a new behavioral test that allowed them to measure the attention levels of mice genetically engineered to have absence seizures. The experiments confirmed that these animals had impaired attention even when brain activity recordings showed that they were not experiencing seizures. Further work revealed that poor performance on the behavioral test was linked to decreased activity in parvalbumin interneurons, a group of cells in the prefrontal cortex which can inhibit many other types of neurons. In mutant mice, this change was associated with alterations in network activity broadly in the cortex, including in electrical patterns which are linked to cognitive processes. Promisingly, increasing the activity of the interneurons during the attention task improved performance, suggesting that this type of cell could represent a therapeutic target for attention deficit in absence epilepsy.


Conflict of interest statement

BF, CG No competing interests declared, JH Reviewing editor, eLife

Figures

Figure 1.
Figure 1.. Scn8a+/-mice exhibit attention deficits on the Attentional Engagement Task (AET).
(A) Top, AET task design. Bottom, Training accuracy for mice learning the AET. Lines represent performance displayed as average ±SE until mice reached criterion (WT are in black and Scn8a+/- are in teal for this and all subsequent figures). Inset, comparison of total days to criterion, which was not different between groups (Student’s t test, p=0.27, n=7 for both groups). (B) Scn8a+/- mice have reduced accuracy at 2 s (p=0.0049) and 1 s (p=0.0497) compared to WT littermates (two-way ANOVA, F(1,70) = 16.17, p=0.0001, n=8 for both WT and Scn8a+/-). (C) Animals were evaluated on their performance at each cue length in separate trial blocks, and there was no effect of genotype on performance in each session (F (1, 40)=0.00077, p=0.9780, n=5 for both WT and Scn8a+/-). (D) Omissions were not different between groups (two-way ANOVA, F(1,70) = 0.8456, p=0.3609, n=8 for both WT and Scn8a+/-). (E) There was no effect of group on reaction time, but there was an effect of accuracy (three-way ANOVA, group, F(1,70) = 1.01, p=0.3161; accuracy, F(1,70) = 67.66, p=0.0001). (F) The repetitive score was increased in Scn8a+/- mice (Student’s t test, p=0.0381, n=10 and 13 for WT and Scn8a+/- respectively). (G) Top, design of the three-chamber sociability task. (H and K) Representative heatmap images. (I) Each group showed a significant preference for the novel mouse versus the object (p<0.0001), but there were no differences between groups (F (1, 11)=0.5648, n=6 and 7 for WT and Scn8a+/- respectively). (J) Novel object recognition paradigm. (L) There were no significant differences in the difference score (Student’s t test, p=0.111, n=6 and 7 for WT and Scn8a+/- respectively). Data are shown as averages from individual animals or groups, and errors bars or shading represent ±SE in this and all future figures unless stated otherwise.
Figure 2.
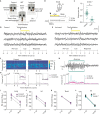
Figure 2.. AET performance deficits are unrelated to acute seizure activity in Scn8a+/-mice.
(A) AET design. (B) Illustration of ECoG recording and metrics for power analysis. (C) Seizures were reduced during the task (Student’s T test, p=0.0155, n=6 and 6 for home cage versus task animals respectively). (D-E) Example ECoG activity from the highly seizure-active somatosensory cortex (S1) recorded during correct and incorrect trials with a 2 s cue length. (F) Representative time-frequency wavelet decomposition for correct trials (left) and incorrect trials (right). (G) Trial-averaged power and variance over time in the Ø (7–10 Hz) or β (10–20 Hz) range with correct trials in purple and incorrect trials in grey. (H) An example of a detected absence seizure (top) and the corresponding power in the Ø (7–10 Hz) or β (10–20 Hz) range. (I-K) In Scn8a+/- mice, there were no differences in power across cue lengths in the Ø (7–10 Hz) or β (10–20 Hz) range between correct and incorrect trials (I, Long cue, two-way ANOVA, accuracy effect, F (1, 16)=3.998, p=0.0628; (J) Int cue, two-way RM ANOVA, accuracy effect, F (1, 10)=3.367, p=0.0964; (K) short cue, two-way RM ANOVA, accuracy effect, F (1, 10)=0.2082, p=0.6580; n=6 for all) (L) There was no difference in average power between WT and Scn8a+/- mice in the Ø (7–10 Hz) or β (10–20 Hz) range (two-way ANOVA, group effect, F (1, 18)=0.1185, p=0.5101, n=5 and 6 for WT and Scn8a+/- mice, respectively). See also .
Figure 3.
Figure 3.. Photoinhibition of mPFC during cue presentation reduces accuracy in the AET but not the VDST.
(A-B) Task design for the AET and VDST task. (C) Experimental approach for disrupting prelimbic mPFC activity during the variable cue period with continuous blue light in VGAT:ChR2 mice. (D) Photoinhibition with blue light reduces performance (left, two-way RM ANOVA, group effect F(1,18) = 6.990, p=0.0165, n=6), without affecting reaction time (right, two-way RM ANOVA, F(1,18) = 3.323, p=0.0850, n=6) in the AET. (E) Approach for photoinhibition during the fixed cue period in the VDST task. (F), Neither performance nor reaction time is affected by light stimulation during the cue in the VDST (left, performance, paired t test, p=0.7695; right, reaction time, paired t test, p=0.6508; n=6 for both). (G) Approach for delivering continuous light stimulation during the variable delay period. (H) Stimulation during the delay reduces performance in the VDST (left, paired t test, p=0.0140) without altering reaction time (right, paired t test, p=0.1268). See also Figure 3—figure supplements 1 and 2.
Figure 3—figure supplement 1.
Figure 3—figure supplement 1.. Continuous blue light can inhibit pyramidal neuronal spiking at pulse durations relevant to the AET.
(A) Experimental approach for using blue light to activate VGAT positive neurons and record from pyramidal neurons. (B) Left, example of current injection protocol and right, example of evoked pyramidal neuron spiking in 5 s light and no light conditions. (C-D) Same but for 2 s and .5 s pulses. (E) Spike number in the last bin (.5 s) was significantly reduced by light (RM two-way ANOVA, F (1,12)=59.52, p<0.001; n=5 per group). (F-H) TData from E plotted with individual cell spike counts at each continuous pulse length in the last .5 s bin with or without light (5 s, p=0.015; 2 s, p=0.008;.5 s, p<0.0001).
Figure 3—figure supplement 2.
Figure 3—figure supplement 2.. Continuous blue light can hyperpolarize pyramidal neurons at pulse durations relevant to the AET.
(A) Experimental approach for using blue light to activate VGAT-positive neurons and record from pyramidal neurons. (B-D) Example evoked inhibitory post-synaptic response (IPSP) to continuous blue light. A dashed box indicates that.5ms window utilized for measurements of membrane potential (mV) in comparison to baseline. (E) Membrane potential in the last bin (0.5 s) was significantly reduced by light (RM two-way ANOVA, F (1,15)=47.96, p<0.0001; n=6 per group). (F-H) Data from E plotted with individual cell membrane potentials at each continuous pulse length in the last 0.5 s bin with or without light (5 s, p=0.012; 2 s, p=0.0003; 0.5 s, p<0.0001).
Figure 4.
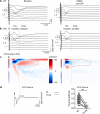
Figure 4.. Scn8a+/-mice exhibit a loss of post-synaptic signaling in mPFC slice recordings.
(A) Experimental design of LFP recordings. (B) Representative local field potential (LFP) recording in response to a 250 μA electrical pulse. (C) Representative current source density (CSD) derived from the LFP recording. Brackets highlight the traces used for quantification (orange = L2/3 sink, purple = L2/3 source, green = L2/3 sink, magenta = L5 sink). (D) Representative responses of the pre- and post-synaptic L2/3 sink, L2/3 source, and L5 Sink to 250 μA electrical stim. (E-H) Peak amplitude curves (V/mm2) of the response to electrical stim with increasing intensity. (H) Only the L2/3 source showed a significant reduction in peak amplitude (two-way ANOVA, group effect, F (1, 60)=8.125, p=0.0060, n=7 slices for both WT and Scn8a+/- mice). See also Figure 4—figure supplement 1.
Figure 4—figure supplement 1.
Figure 4—figure supplement 1.. DNQX and CPP reduce late activity in mPFC LFP recordings.
(A) Left, example baseline local field potential (LFP) recording in response to a 0.1ms 250 μA electrical pulse. (B) CSD and contour plot. (C) Sinks in blue and sources in red, with the L2/3 Source outlined with a dashed line. (A-C) Right, LFP, CSD, and contour plot in response to DNQX (25 μM) and CPP (1 μM) to determine pre- vs. post-synaptic activity. (D) Left, L2/3 source baseline (black) overlayed by drug trace (DNQX and CPP, black). Right, the peak amplitude of the L2/3 source is significantly reduced by drug (paired t test, p=0.0146; n=7 per condition). Data are shown as averages over 10 trials in each condition.
Figure 5.
Figure 5.. PVINs show deficient gamma-frequency synaptic output but can regulate pyramidal neuron spiking.
(A) Experimental approach for using blue light to activate PV-positive neurons and record from pyramidal neurons. (B) Representative evoked inhibitory post-synaptic potential train (IPSP) to a 40 Hz train of blue light pulses. (C) The percentage of synaptic failures (responses less than 0.25 mV) within the 40 Hz train was significantly increased in Scn8a+/- mice (Mann-Whitney test, p=0.0396; n=12 and 9 for WT and Scn8a+/-, respectively). (D) Representative evoked spikes from a noisy current injection in no light (top) and 40 Hz stimulation (light, bottom) conditions. (E) WT and Scn8a+/- mice showed no differences in the percent spike reduction in response to 40 Hz stimulation (unpaired t test, p=0.8123; n=12 and 10 for WT and Scn8a+/- respectively).
Figure 6.
Figure 6.. Cue-evoked PVIN activity is reduced in Scn8a+/- mice during the AET.
(A) PV-Cre; WT and PV-Cre;Scn8a+/- were injected with a FLEX-GCaMP6s virus in the mPFC (scale bar = 500 µm), and tested on the AET while recording Ca2+ signals from PVINs using fiber photometry. (B) Top, example of the raw data collected from 470 (Ca2+-dependent) and 405 (Ca2+-independent isosbestic) excitation. Bottom, the same data trace after calculating the dF/F, with trial initiation (triangle) and cue presentation (yellow bar) indicated. (C) Heat maps of all trials of dF/F activity and (D) average dF/F activity from representative animals in both groups and across cue lengths. (E) Average dF/F baseline and cue activity at each cue length with groups indicated by line color. There was an effect of accuracy, (two-way RM ANOVA F (1, 45)=10.372, n=5 per group) and cue (two-way RM ANOVA F (1, 45)=41.967, n=5 per group) on PVIN activity. PVIN activity increased during the int cue in correct trials (p=0.0138 and 0.0276 for PV-Cre;WT and PV-Cre;Scn8a+/- respectively). (F) Average PVIN activity was reduced during the intermediate cue (p=0.0466) for PV:Cre;Scn8a+/- mice (two-way ANOVA, F (1,24)=4.658, p=0.0411; n=5 per group). (G) Classifiers trained on features from the FiP cue data across cue lengths could predict trial outcome within groups (AUC test set performance vs shuffled data; p=0.00022 and 0.00020 for PV-Cre;WT and PV-Cre;Scn8a+/-, respectively). See also Figure 6—figure supplements 1 and 2.
Figure 6—figure supplement 1.
Figure 6—figure supplement 1.. Peak Amplitude is reduced at the long and intermediate cue lengths, while time to peak dF/F is not.
(A), Peak amplitude was reduced for PV-Cre;Scn8a+/-mice compared to PV-Cre;WT (two-way ANOVA, F (1, 24)=11.06, p=0.0028, n=5 for both PV-Cre;WT and PV-Cre;Scn8a+/- mice) at the long (p=0.0210) and int cue (p=0.0210). (B), However, time to peak is not different between groups (two-way ANOVA, F (1, 24)=0.9492, p=0.3396).
Figure 6—figure supplement 2.
Figure 6—figure supplement 2.. Trial outcome can be predicted by PVIN activity for individual cue lengths.
(A-C) A classifier trained on the features from the data at each cue length and its performance was evaluated on a test set to generate ROC curves. For each cue length, the ROC curve based on the shuffled data was also generated (dashed line) and curves were compared. (A), For long cues, there was no difference in classifier performance between the real and shuffled data set for WTs (PV-Cre;WT, p=0.8221), while classifier performance on Scn8a+/- PVIN activity was more predictive than on the shuffled data PV-Cre;Scn8a+/-, p=0.0215. (B) For the intermediate cue, the classifier performance was greater on the test set for both WT and Scn8a+/- (p=0.00001 and 0.0252 for PV-Cre;WT and PV-Cre;Scn8a+/-, respectively). (C) For short cues, there was no difference in classifier performance between the real and shuffled data set for WTs (PV-Cre;WT, p=0.0974), while classifier performance on Scn8a+/- PVIN activity was more predictive than on the shuffled data PV-Cre;Scn8a+/-, p=0.0020; n=5 for both PV-Cre;WT and PV-Cre;Scn8a+/- mice for all comparisons.
Figure 7.
Figure 7.. Optogenetic activation of PVINs improves performance in Scn8a+/-mice while common AED, VPA has no effect.
(A) Mice received a bilateral injection with the FLOX-ChR2 virus (scale bar = 500 µm), and then were implanted bilaterally with optical fibers for delivering blue light during the cue (40 Hz, 5ms pulse width). (B) With gamma stimulation, there is a significant effect of light (two-way ANOVA, F (1, 22)=6.973, p=0.0173, n=7 mice) during the intermediate cue (p=0.0044). (C) Timeline of saline and VPA injections (200 mg/kg) during AET testing. (D) While Scn8a+/- mice had reduced performance in comparison to WT, there was no effect of VPA on performance (three-way ANOVA, group effect, F (1, 35)=5.850, p=0.0191, VPA effect, F (1, 35)=0.010, p=0.943; n=3 and 6 for WT and Scn8a+/- mice, respectively). See also Figure 7—figure supplements 1 and 2.
Figure 7—figure supplement 1.
Figure 7—figure supplement 1.. 40 Hz stimulation increases mPFC ECoG power in the 30–50 Hz range.
(A) PV:Ai32-eYFP+/+; Scn8a+/- mice or PV:Ai32-eYFP-/-; Scn8a+/- were implanted unilaterally with a gold pin for recording ECoG and a reference screw in the cerebellum. 40 Hz stimulus trains were delivered by an optical fiber in the opposite cortex at lengths of 5 s (long), 2 s (Int), and .5 s (Short) while recording ECoG activity. (B) Example of ECoG activity in YFP null (-/-) and ChR2 expressing (YFP+/+) mice in response to 40 Hz stimulation and ranges in which power was measured. (C-E) Rel. power [log10] across each frequency band for each train length. 40 Hz stimulation increases power specifically in the 30–50 Hz range (RM two-way ANOVA, light effect, 5 s, F (1, 10)=126.3, p<0.0001; 2 s, F (1, 10)=10.17, p=0.0097;.5 s, F (1, 10)=8.628, p=0.0149; 30–50 Hz, 5 s, p<0.0001; 2 s, p<0.0001;.5 s, p=0.0001; n=3 mice).
Figure 7—figure supplement 2.
Figure 7—figure supplement 2.. 40 Hz stim has no effect on animals expressing the control virus and seizures are not significantly reduced by VPA.
(A) Mice received a bilateral injection with the FLOX-eYFP virus and were implanted bilaterally with optical fibers for delivering blue light. (B) There is no effect of light (two-way ANOVA, F (1, 15)=.2598, p=0.6177, n=5 mice). (C) Illustration of ECoG recording over S1 with reference screw in the cerebellum. (D) VPA reduces the number of seizures per minute (Wilcoxon matched-pairs signed rank test, p=0.0313, n=6).
Figure 8.
Figure 8.. Scn8a+/- mice exhibit reductions in mPFC gamma power along with performance deficits in the AET.
(A) Experimental design, ECoG activity was recorded using a gold electrode over mPFC and a reference screw over the cerebellum during the AET. Power was measured during the cue period across frequency bands. (B) Representative ECoG filtered across different frequency bands during the cue period. (C) Performance was decreased in Scn8a+/- mice (two-way ANOVA, F (1, 21)=4.497, p=0.0460, n=3 and 6 for WT and Scn8a+/- mice, respectively). (D-F) Scn8a+/- mice have reduced power during the long (high gamma, p=0.0597) and int cues (high gamma, p=0.0145), but not during the short cue (long, two-way ANOVA, F (1, 35)=5.623, p=0.0234; int, two-way ANOVA, F (1, 35)=4.586, p=0.0393; short, two-way ANOVA, F (1, 35)=0.2656, p=0.6095; n=3 and 6 for WT and Scn8a+/- mice, respectively).

Comment in

References

    1. Allen G, Courchesne E. Attention function and dysfunction in autism. Frontiers in Bioscience. 2001;6:D105–D119. doi: 10.2741/allen. - DOI - PubMed
    1. Archer JS, Abbott DF, Waites AB, Jackson GD. Fmri “ deactivation ” of the posterior cingulate during generalized spike and wave. NeuroImage. 2003;20:1915–1922. doi: 10.1016/s1053-8119(03)00294-5. - DOI - PubMed
    1. Barceló F, Suwazono S, Knight RT. Prefrontal modulation of visual processing in humans. Nature Neuroscience. 2000;3:399–403. doi: 10.1038/73975. - DOI - PubMed
    1. Barker GRI, Bird F, Alexander V, Warburton EC. Recognition memory for objects, place, and temporal order: a disconnection analysis of the role of the medial prefrontal cortex and perirhinal cortex. The Journal of Neuroscience. 2007;27:2948–2957. doi: 10.1523/JNEUROSCI.5289-06.2007. - DOI - PMC - PubMed
    1. Barone V, van Putten M, Visser GH. Absence epilepsy: characteristics, pathophysiology, attention impairments, and the related risk of accidents: A narrative review. Epilepsy & Behavior. 2020;112:107342. doi: 10.1016/j.yebeh.2020.107342. - DOI - PubMed

Publication types

Substances

LinkOut - more resources