. 2023 Sep;17(9):1821-1843.
doi: 10.1002/1878-0261.13427. Epub 2023 May 12.

Targeting mitochondrial energetics reverses panobinostat- and marizomib-induced resistance in pediatric and adult high-grade gliomas

Affiliations

Targeting mitochondrial energetics reverses panobinostat- and marizomib-induced resistance in pediatric and adult high-grade gliomas

Esther P Jane et al. Mol Oncol. 2023 Sep.

Abstract

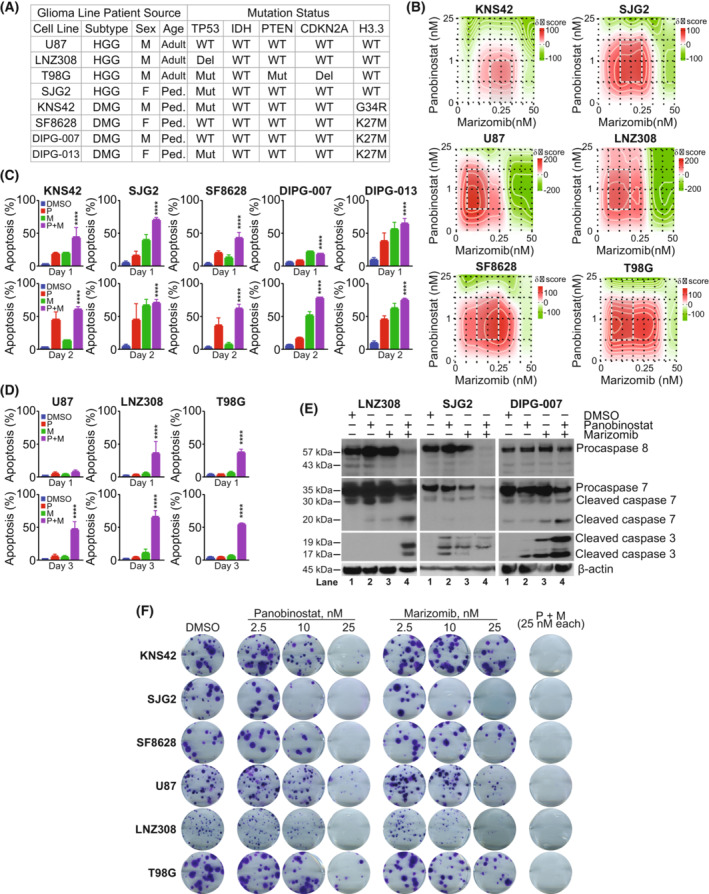
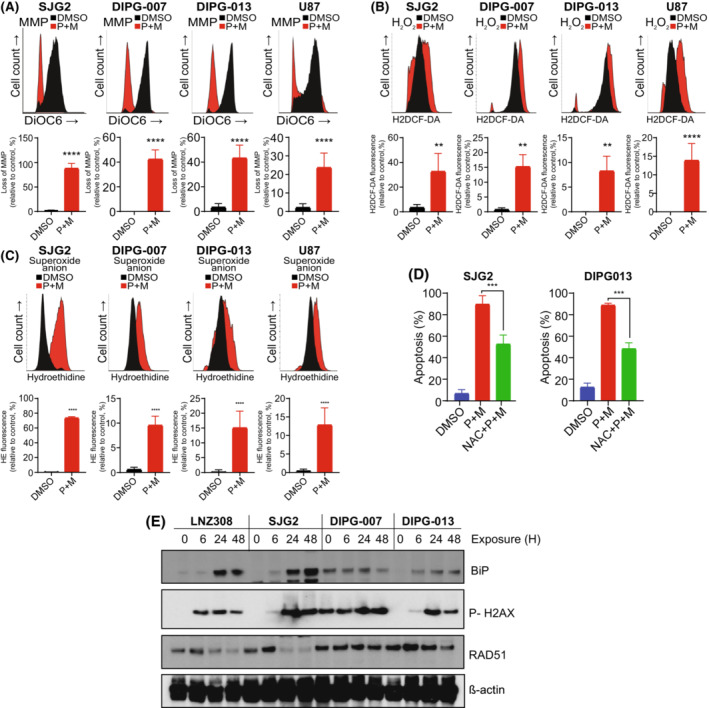
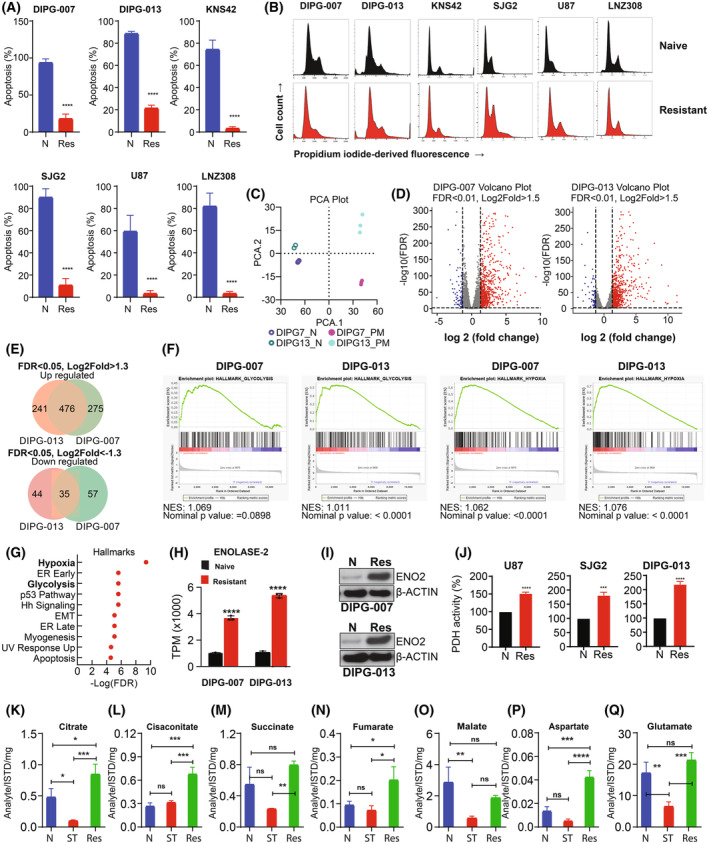
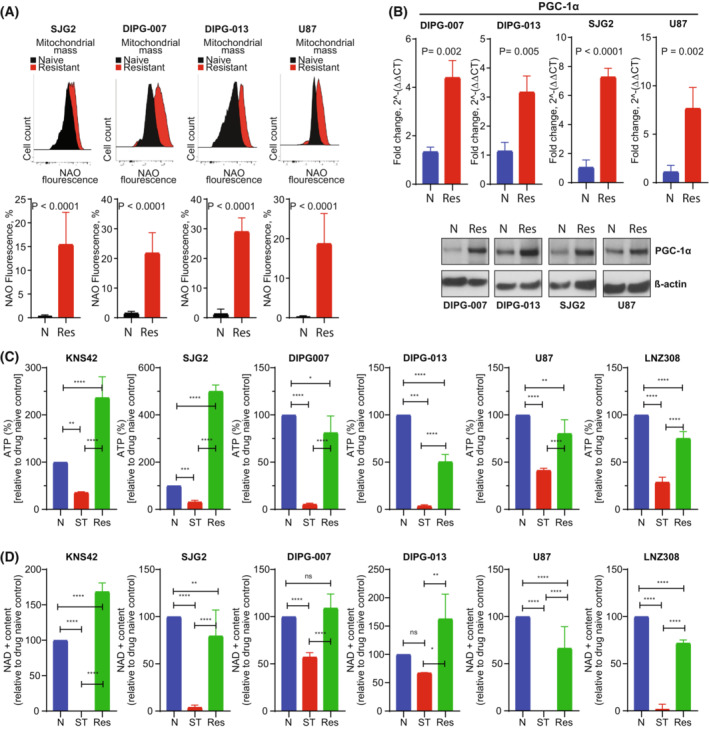
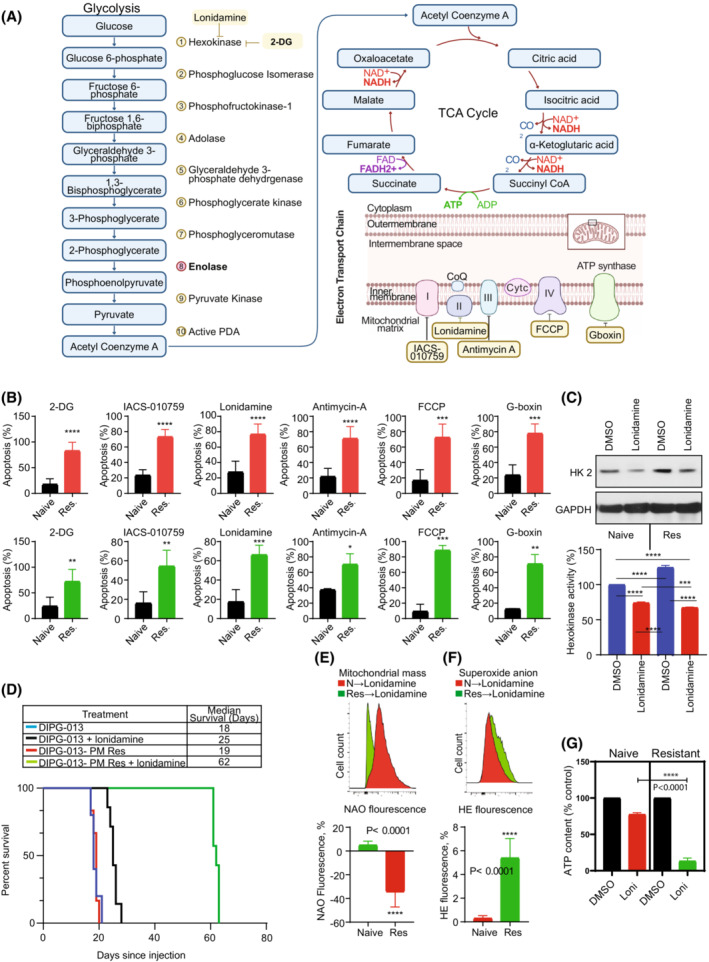
In previous studies, we demonstrated that panobinostat, a histone deacetylase inhibitor, and bortezomib, a proteasomal inhibitor, displayed synergistic therapeutic activity against pediatric and adult high-grade gliomas. Despite the remarkable initial response to this combination, resistance emerged. Here, in this study, we aimed to investigate the molecular mechanisms underlying the anticancer effects of panobinostat and marizomib, a brain-penetrant proteasomal inhibitor, and the potential for exploitable vulnerabilities associated with acquired resistance. RNA sequencing followed by gene set enrichment analysis (GSEA) was employed to compare the molecular signatures enriched in resistant compared with drug-naïve cells. The levels of adenosine 5'-triphosphate (ATP), nicotinamide adenine dinucleotide (NAD)+ content, hexokinase activity, and tricarboxylic acid (TCA) cycle metabolites required for oxidative phosphorylation to meet their bioenergetic needs were analyzed. Here, we report that panobinostat and marizomib significantly depleted ATP and NAD+ content, increased mitochondrial permeability and reactive oxygen species generation, and promoted apoptosis in pediatric and adult glioma cell lines at initial treatment. However, resistant cells exhibited increased levels of TCA cycle metabolites, which required for oxidative phosphorylation to meet their bioenergetic needs. Therefore, we targeted glycolysis and the electron transport chain (ETC) with small molecule inhibitors, which displayed substantial efficacy, suggesting that resistant cell survival is dependent on glycolytic and ETC complexes. To verify these observations in vivo, lonidamine, an inhibitor of glycolysis and mitochondrial function, was chosen. We produced two diffuse intrinsic pontine glioma (DIPG) models, and lonidamine treatment significantly increased median survival in both models, with particularly dramatic effects in panobinostat- and marizomib-resistant cells. These data provide new insights into mechanisms of treatment resistance in gliomas.

Keywords: OXPHOS; glioma; marizomib; mitochondria; panobinostat; resistance.


Conflict of interest statement

The authors declare no conflict of interest.

Figures

Fig. 1
Fig. 1
Cotreatment of panobinostat and marizomib promotes apoptosis in pediatric and adult glioma cell lines. (A) Genetic and biological characterization of the established glioma cell lines used in this study (HGG, high‐grade glioma; DMG, diffuse midline glioma; M, male; F, female; Ped, pediatric; WT, wild‐type; Del, deletion; Mut, mutation). The TP53 gene at chromosome 17p13.1, plays a critical role in the cell cycle, cellular responses to DNA damage, cell death, and differentiation. Isocitrate dehydrogenase 1 and 2 (IDH1 and IDH2) enzymes convert isocitrate to α‐ketoglutarate (α‐KG) through oxidative decarboxylation. IDH1/2 mutations introduce a gain‐of‐function activity to the enzyme that leads to accumulation of (+)‐2‐hydroxyglutarate (2‐HG). Phosphatase and TENsin homolog (PTEN), a gene located in the 10q23 region of chromosome 10 encoding for a 403‐aminoacid multifunctional protein, a crucial tumor suppressor, exhibits phosphatase‐dependent PI3K‐AKT–mTOR pathway activities to maintain cellular homeostasis. Cyclin Dependent Kinase Inhibitor 2A (CDKN2A), a tumor suppressor gene located at chromosome 9 blocks the progression of cell cycle from G1 to S phase. Recurrent mutations in H3 histone, family 3A (H3F3A), which encodes the replication‐independent histone 3 variant H3.3 led to amino acid substitutions at two critical positions within the histone tail (K27M, lysine at position 27‐to‐methionine; G34R, glycine at position 34‐to arginine; G34V, glycine at position 34‐to valine) involved in key regulatory post‐translational modifications. H3F3A mutations are highly prevalent in children and young adults. Histone 3 lysine 27‐to‐methionine (H3‐K27M) mutations most frequently occur in diffuse midline gliomas (DMGs). (B) Pediatric high‐grade glioma (KNS42, SJG2) or adult high‐grade glioma (U87, LNZ308, and T98G) and pediatric brain stem glioma (SF8628) were seeded in 96‐well plates in 75 μL of complete media. On the following day, cells were treated with an equal volume of panobinostat (0, 0.25, 1, 5, and 25 nm) or marizomib (0, 0.01, 0.05, 0.25, 1, 5, 25, and 50 nm) and their combination on cell proliferation in six glioma cell lines (KNS42, SJG2, U87, LNZ308, SF8628, and T98G). After 72 h of incubation at 37 °C, the number of viable cells was determined using a colorimetric cell proliferation assay kit as described in the Section 2. The degree of panobinostat and marizomib effect (synergistic or antagonistic or additive) was quantified using synergyfinder 2 (https://synergyfinder.fimm.fi), a stand‐alone web application for interactive analysis of drug combination. The data (n = 3) were analyzed using zero interaction potency (ZIP) model, which offers an increased power to differentiate between various classes of drug combinations for understanding their mechanisms of action toward clinical translation. The representative interaction landscape (heatmap) from three separate experiments for six different cell lines indicates that the combination of panobinostat and marizomib was able to achieve a higher effect (red‐shaded area) than the single agent. (C, D) KNS42, SJG2, SF8628, DIPG‐007, and DIPG‐013 (C); U87, LNZ308, and T98G cells (D) (1 × 105 per well) were plated in 6‐well microtiter plates. On the following day, cells were treated with panobinostat (25 nm, P), marizomib (25 nm, M), or both (P + M, 25 nm each) in combination. Control cells received an equivalent amount of DMSO (vehicle). After the indicated duration, the cells were stained with Annexin V and propidium iodide, and cell viability was assessed using flow cytometry as described in the Section 2. Values are represented as mean ± standard deviation of three separate experiments. Results were analyzed by Tukey's ANOVA (C, D, ****P < 0.0001, vehicle‐treated cells vs. combination of panobinostat and marizomib). (E) Logarithmically growing adult high‐grade glioma cells (LNZ308) were treated with panobinostat (25 nm) or marizomib (25 nm) or the combination of both (Pano + Mari, 25 nm each) for 72 h (left panel) and pediatric cells (SJG2 and DIPG‐007) for 48 h (middle and right panel). Twenty micrograms of protein were loaded on a sodium dodecyl sulfate‐polyacrylamide gel and probed with the indicated antibodies by western blotting. These experiments were performed at least three times, and a representative blot is presented. (F) Pediatric (KNS42, SJG2, and SF8628) and adult (U87, LNZ308, and T98G) cells were treated with indicated concentrations of panobinostat (2.5, 10, and 25 nm) or marizomib (2.5, 10 and 25 nm) or the combination of both (P + M, 25 nm each) for 24 h. Control cells received vehicle (DMSO). Clonogenic assay was performed as described in the Section 2. These experiments were performed at least three times, and a representative image is presented.
Fig. 2
Fig. 2
Cotreatment of panobinostat and marizomib induces mitochondrial dysfunction. (A–C) Pediatric and adult glioma cell lines were treated with the combination of panobinostat and marizomib (Pano + Mari, 25 nm each) or vehicle (DMSO) for 24 h. Then, the cells were labeled with DiOC6 to measure mitochondrial membrane potential (A). A representative FACS plot and the data obtained from three separate experiments demonstrated a loss of mitochondrial membrane potential (A, upper panel). The loss of mitochondrial membrane potential (left‐shifted population) was quantified. The values are represented as mean ± standard deviation of three separate experiments (****P < 0.0001; vehicle‐treated control vs. inhibitor‐treated cells; unpaired two‐tailed t‐test; A, lower panel). The cells were labeled with H2DCF‐DA and hydroethidine (HE) to analyze hydrogen peroxide (B) and superoxide anion (C), respectively, by flow cytometry. All experiments were performed at least three times. A representative FACS histogram is shown in the upper panel. Treatment with inhibitor was accompanied by an increase of H2DCF‐DA fluorescence (shift to the right; B, upper panel) and HE fluorescence (shift to the right; C, upper panel), which is proportional to the intracellular H2O2 and superoxide anion, respectively. Quantitative data from three separate experiments are presented in the lower panel (values are represented as mean ± standard deviation: B, H2O2 content; unpaired two‐tailed t‐test **P < 0.005, ****P < 0.0001 and C, superoxide anion; ****P < 0.0001; unpaired two‐tailed t‐test). (D) Cells were treated with panobinostat and marizomib in the presence or absence of NAC (0.25 mm), reactive oxygen species scavenger. After 24 h, cells were stained with annexin V and propidium iodide (PI), and quantitative measurements of apoptosis were performed by flow cytometry. Graph represents the percentages of apoptotic cells acquired from three independent experiments for each cell type (mean ± SD). Statistical significance was assessed with Tukey's ANOVA (***P < 0.0001). (E) After treatment with the combination of panobinostat and marizomib (25 nm each) for the indicated duration, whole cell extracts were subjected to western blot analysis. Equal amounts of protein were separated by SDS/PAGE and subjected to western blot analysis with the indicated antibodies. β‐actin served as a loading control. These experiments were performed at least three times, and a representative image is presented.
Fig. 3
Fig. 3
Resistance is associated with an enhanced glycolytic phenotype. (A) Drug‐naïve (N) or PM‐resistant (Res) cells were treated with the combination of panobinostat and marizomib (25 nm each) for 48 h. After harvesting, cells were labeled with annexin V and propidium iodide, and cell viability was assessed by flow cytometry. The results represent the mean of three independent experiments. Error bars indicate ± SD (****P < 0.0001; naive‐treated vs. resistant cells; unpaired two‐tailed t‐test). (B) Drug‐naïve (upper panel) or PM‐resistant cells (lower panel) were allowed to attach overnight in a 6‐well plate. Cells were harvested and stained with propidium iodide (PI). Cell cycle profile was assessed by flow cytometry. Representative images acquired from three independent experiments for each cell type are shown. (C) Principal component analysis (PCA) plot of RNA‐seq data comparing drug‐naïve control DIPG‐0007 and DIPG‐013 with PM‐resistant cell lines (n = 3). (D) Volcano plot of differential gene expression (FDR, false discovery rate) analysis of RNA‐seq data comparing drug‐naïve vs. PM‐resistant DIPG‐007 (left panel) and DIPG‐013 (right panel) cell lines (n = 3). The number of upregulated genes that are highlighted in red FDR < 0.01, Log2fold > 1.5, and downregulated genes that are highlighted in Blue FDR < 0.01, Log2fold < −1.5 (n = 3). (E) Venn‐diagram showing the number of upregulated genes (upper panel) and downregulated (lower panel) genes (n = 3). (F) Gene set enrichment analysis (GSEA) plots (NES, normalized enrichment score) showing glycolysis and hypoxia gene sets of DIPG‐007 and DIPG‐013 of drug‐naïve vs. PM‐resistant cell lines (n = 3). (G) Hallmark analysis of drug‐naïve vs. PM‐resistant DIPG‐013 cell lines reveals enrichment of hypoxia and glycolytic signatures (among top 10; n = 3). (H) Transcripts per million (TPM) of enolase‐2 in DIPG‐007‐ and DIPG‐013‐naïve vs. ‐resistant cell lines, the results were generated from three biological replicates (****P < 0.0001 naïve vs. resistant, analysis was performed as one‐way ANOVA). Data are displayed as mean with standard deviation. (I) Drug‐naïve (N) or PM‐resistant cells (Res) were allowed to attach overnight in a 6‐well plate. Whole cell lysates were prepared, and western blot analysis was performed with the indicated antibodies (ENO2, enolase‐2). Representative blots acquired from three independent experiments for each cell type are shown. (J) Drug‐naïve (N) and PM‐resistant (Res) U87, SJG2, and DIPG‐013 cells were seeded in 6‐well plates. On the following day, cellular pyruvate dehydrogenase (PDH) activity was assessed as described in the Section 2. The results represent the mean ± SD of three independent experiments (***P < 0.0005; ****P < 0.0001; unpaired two‐tailed t‐test). (K–Q) Quantification of TCA cycle‐related metabolites from U87‐resistant cells and drug‐naïve cells treated with the combination of panobinostat and marizomib for 72 h (ST, short‐term). Untreated control cells (N) received vehicle (DMSO). Citrate (K), cis‐aconitate (L), succinate (M), fumarate (N), malate (O), aspartate (P) and glutamine (Q). The values are represented as mean ± standard deviation of three separate experiments (K–Q). Statistical significance was assessed with Tukey's ANOVA (ns, nonsignificant, *P < 0.05, **P < 0.005, ***P < 0.0005, and ****P < 0.0001).
Fig. 4
Fig. 4
Mitochondrial mass, NAD, and ATP were increased in resistant cells. (A) Drug‐naïve (naïve) or PM‐resistant (resistant) cells were allowed to attach overnight in a 6‐well plate. Mitochondrial mass was measured by flow cytometric analysis after the cells were labeled with a fluorescent dye 10‐N‐nonyl‐acridine orange (NAO). A representative FACS histogram from three separate experiments is shown in the upper panel. Bar graph (lower panel; N, drug‐naïve; Res, PM‐resistant) represents the mean ± SD of three independent experiments (P < 0.0001, unpaired two‐tailed t‐test). (B) Quantitative real‐time PCR assay was performed from RNA extracted from drug‐naïve (N) and PM‐resistant cells (Res). The level of expression of the PGC‐1α mRNA was assessed and normalized by ẞ‐actin mRNA (upper panel). All the data were analyzed from four different biological replicates with mean ± SD (unpaired two‐tailed t‐test). In parallel, samples were prepared for western blot analysis and probed with PGC‐1α and ẞ‐actin antibodies (lower panel). A representative blot is shown here. (C, D) PM‐resistant (Res) and drug‐naïve (N) glioma cells exposed to panobinostat and marizomib (25 nm of each) for 48 h (ST, short‐term). After harvesting, cellular ATP (C) or NAD+ content (D) was measured as described in the Section 2. Graph represents the data acquired from three independent experiments for each cell type (mean ± SD). Statistical significance was assessed with Tukey's ANOVA (C, D, ns, nonsignificant, *P < 0.05, **P < 0.005, ***P < 0.0005, and ****P < 0.0001).
Fig. 5
Fig. 5
Targeting mitochondrial energetics overcomes panobinostat and marizomib‐induced drug resistance in glioma. (A) Graphical representation of therapeutic agents for targeting glycolysis and OXPHOS. Figure created using BioRender.com. (B) Drug‐naïve (Naïve) or PM‐resistant cells (Res) were seeded in 6‐well plates at the density of 1.5 × 105 per well in 3 mL of media (DIPG‐013 upper panel; U87, lower panel). On the following day, cells were treated with either 2‐DG (10 mm), IACS‐010759 (10 μm), lonidamine (200 μm), antimycin A (10 μm), FCCP (25 μm) or Gboxin (10 μm), inhibitors of glycolysis or different component of the electron transport chain (ETC). After 3 days of incubation, apoptosis was analyzed by Annexin assay using flow cytometry. The results represent the mean of three independent experiments. Error bars indicate ± SD (unpaired two‐tailed t‐test; *P < 0.01, **P < 0.005; ***P < 0.0005; ****P < 0.0001). (C) Drug‐naïve (Naïve) or PM‐resistant (Res) DIPG‐013 cells were treated with lonidamine (100 μm) for 72 h. Control cells received vehicle (DMSO). Cell extracts were prepared using hexokinase assay buffer (provided in the hexokinase enzyme activity assay kit as described in the Section 2). Twenty micrograms of protein were loaded on a sodium dodecyl sulfate‐polyacrylamide gel and probed with the indicated antibodies by western blotting. Fifty micrograms of protein were used to measure hexokinase enzyme activity. These experiments were performed three times, and a representative blot (upper panel) and the change in hexokinase enzyme activity relative to drug‐naïve control are presented in the lower panel. Data represent the mean ± SD from three independent experiments. Statistical significance was assessed with Tukey's ANOVA (***P < 0.0005, ****P < 0.0001). (D) Kaplan–Meier analysis of in vivo models of drug‐naïve or PM‐resistant DIPG‐013 tumors treated with either vehicle control or lonidamine. DIPG‐013‐naïve models treated with vehicle control (n = 5) had a median survival of 18 days, while DIPG‐013‐naïve cells treated with lonidamine (n = 7) showed a significantly increased median survival of 25 days (P = 0.0003). PM‐resistant DIPG‐013 models (n = 6) showed a median survival of 19 days, while the lonidamine‐treated group (n = 7) showed a significant increase in median survival of 62 days (P = 0.0003). No difference in survival was noted between DIPG‐013‐naïve vs. ‐resistant cells. (E–G) Drug‐naïve (N) or PM‐resistant (Res) DIPG‐013 cells were allowed to attach overnight in a 6‐well plate. On the following day, cells were treated with lonidamine (100 μm). Mitochondrial mass (E) and superoxide anion (F) content was measured by flow cytometric analysis. The representative FACS histogram is shown in the upper panel. Bar graph (bottom panel) represents the mean of three independent experiments ± standard deviation (E, F, unpaired two‐tailed t‐test; ****P < 0.0001). (G) Cellular ATP content was assessed as described in the Section 2. Data represent the mean ± SD from three independent experiments. Statistical significance was assessed with Tukey's ANOVA (****P < 0.0001). mean ± SD.

References

    1. Louis DN, Perry A, Wesseling P, Brat DJ, Cree IA, Figarella‐Branger D, et al. The 2021 WHO classification of tumors of the central nervous system: a summary. Neuro Oncol. 2021;23:1231–51. - PMC - PubMed
    1. Ostrom QT, Cioffi G, Waite K, Kruchko C, Barnholtz‐Sloan JS. CBTRUS statistical report: primary brain and other central nervous system tumors diagnosed in the United States in 2014–2018. Neuro Oncol. 2021;23:iii1–iii105. - PMC - PubMed
    1. Wick W, Kessler T. New glioblastoma heterogeneity atlas – a shared resource. Nat Rev Neurol. 2018;14:453–4. - PubMed
    1. Chen J, McKay RM, Parada LF. Malignant glioma: lessons from genomics, mouse models, and stem cells. Cell. 2012;149:36–47. - PMC - PubMed
    1. Pollack IF, Agnihotri S, Broniscer A. Childhood brain tumors: current management, biological insights, and future directions. J Neurosurg Pediatr. 2019;23:261–73. - PMC - PubMed

Publication types

LinkOut - more resources