. 2023 Sep;19(9):2520-2537.
doi: 10.1080/15548627.2023.2196889. Epub 2023 Apr 10.

CircEPS15, as a sponge of MIR24-3p ameliorates neuronal damage in Parkinson disease through boosting PINK1-PRKN-mediated mitophagy

Affiliations

CircEPS15, as a sponge of MIR24-3p ameliorates neuronal damage in Parkinson disease through boosting PINK1-PRKN-mediated mitophagy

Yuanzhang Zhou et al. Autophagy. 2023 Sep.

Abstract

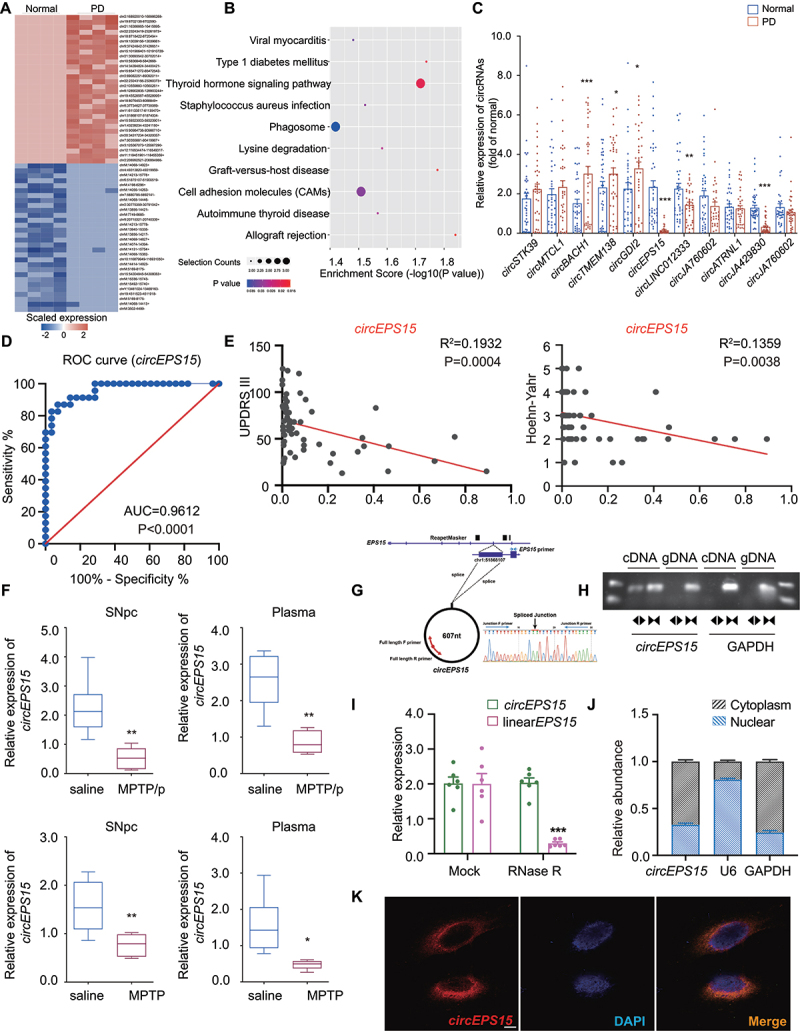
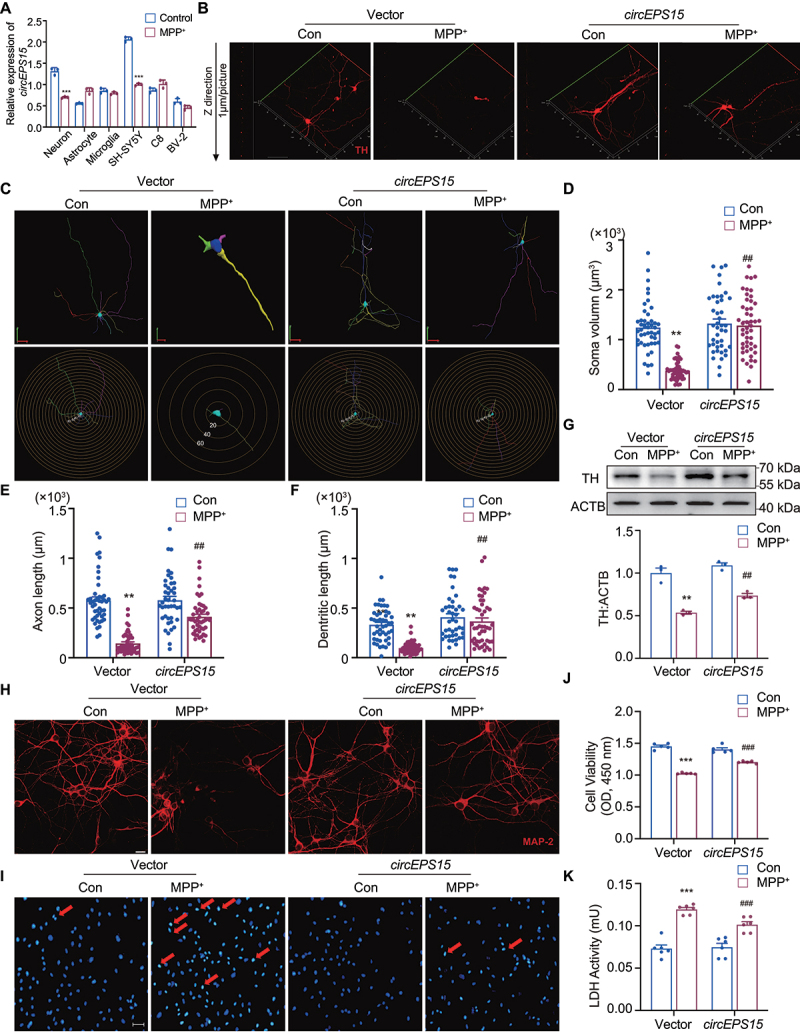
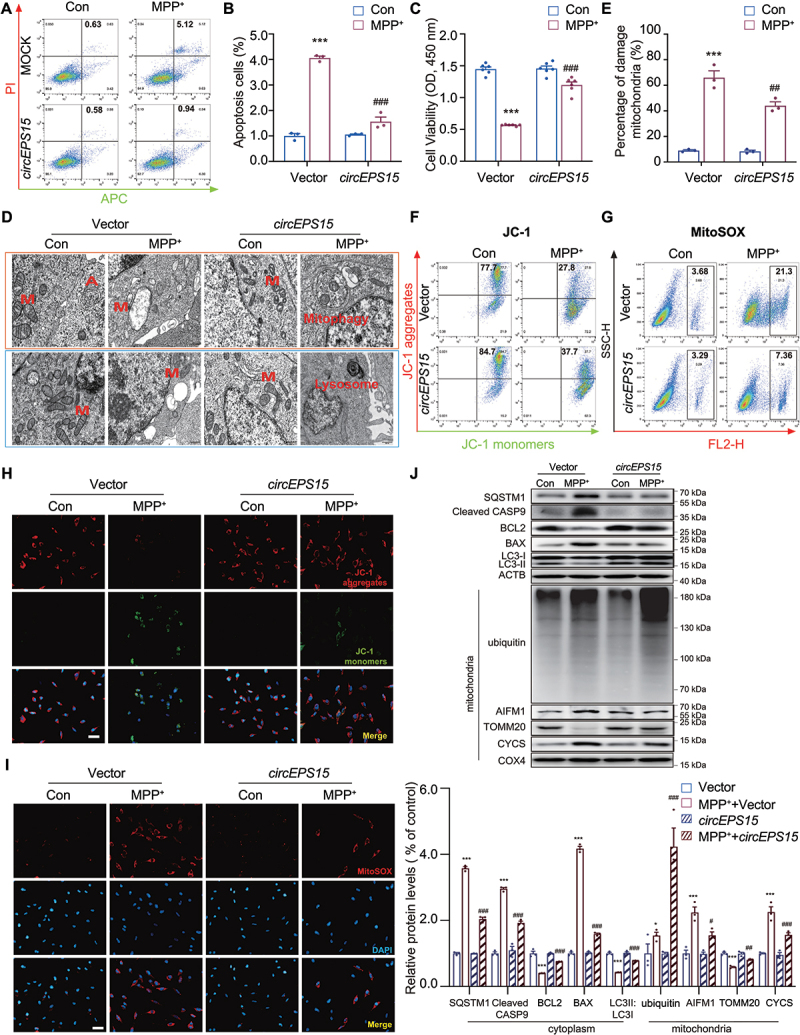
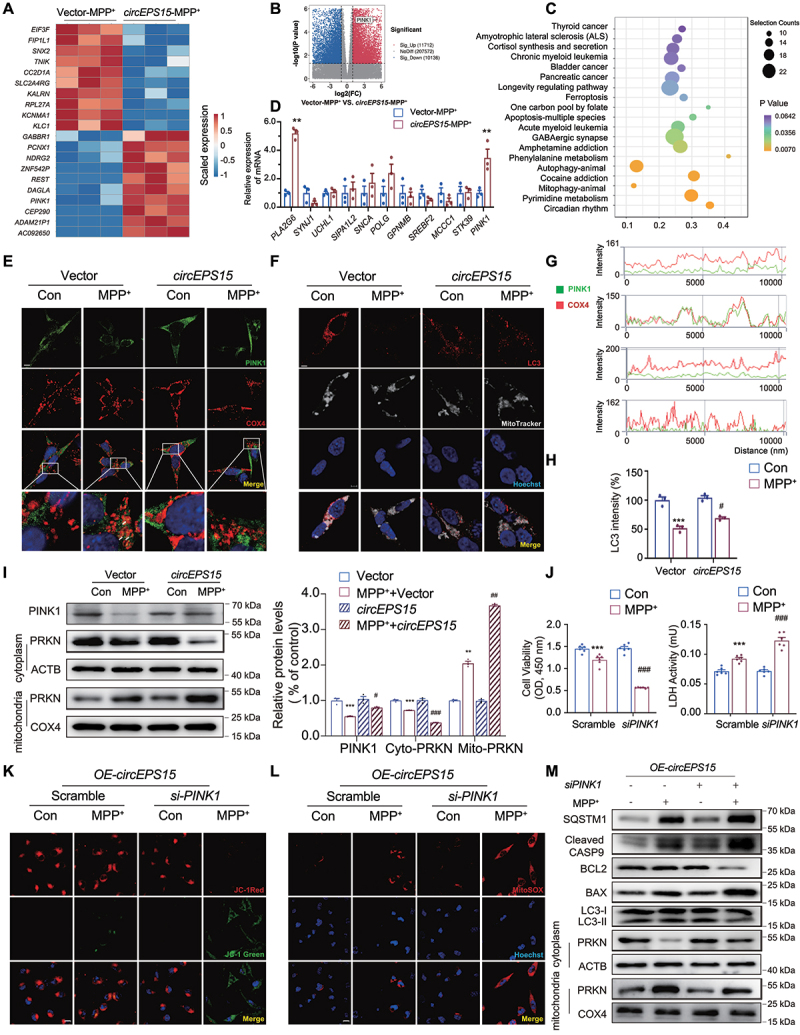
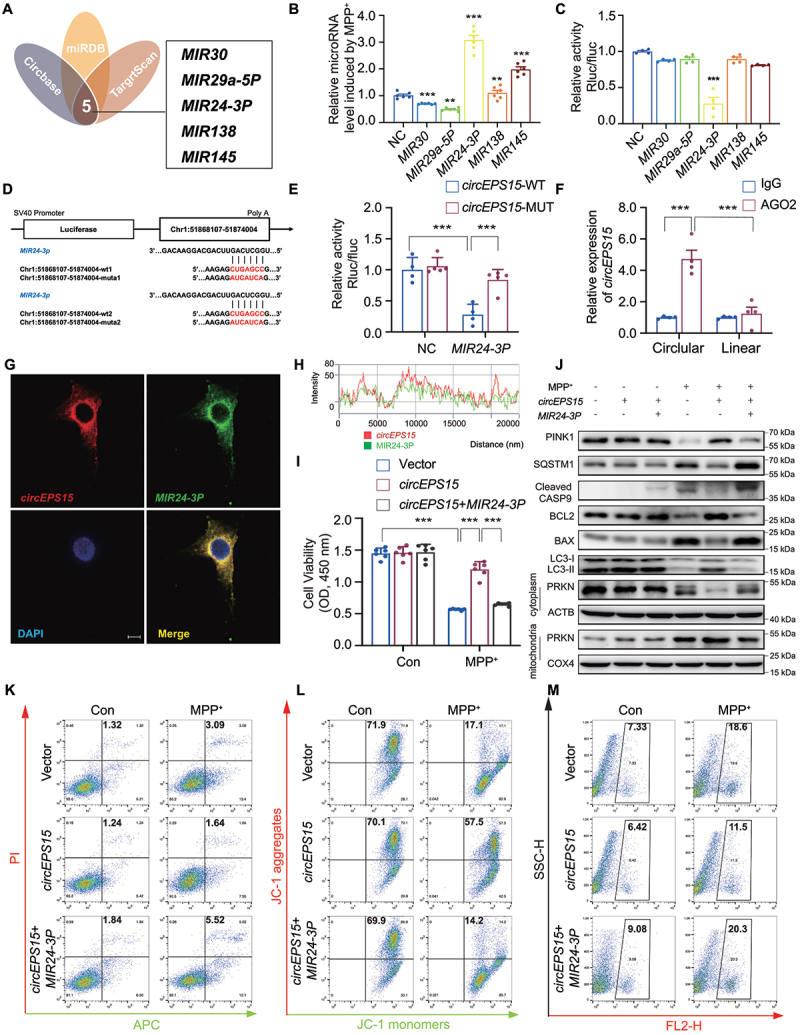
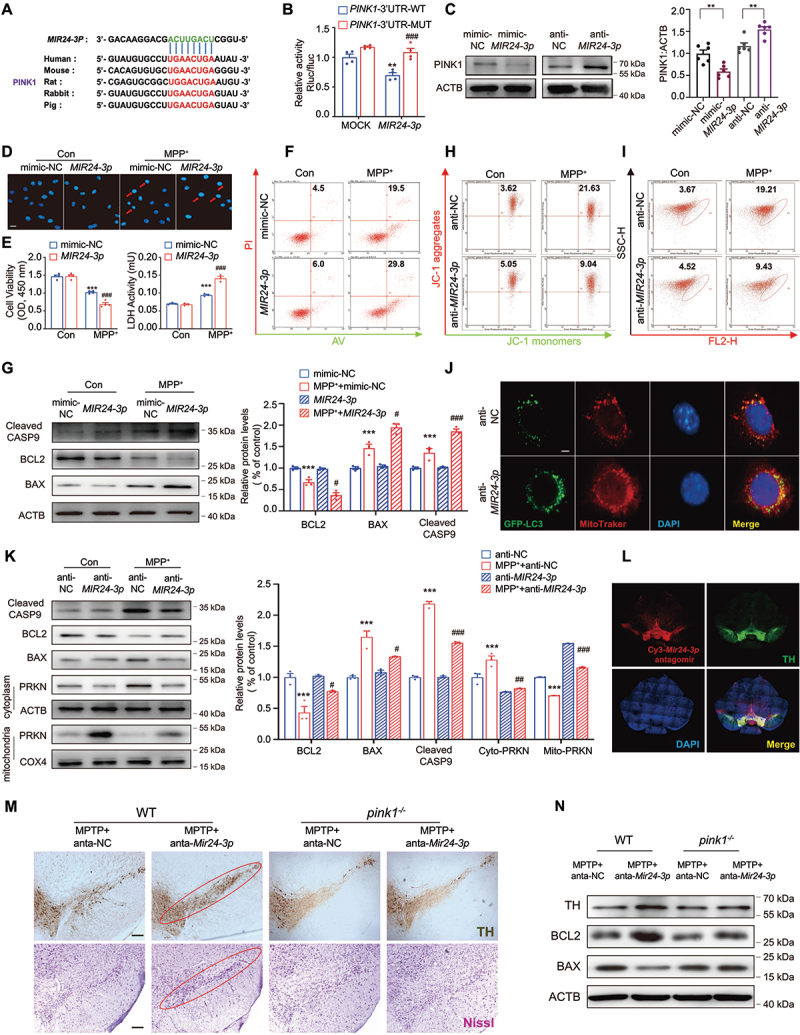
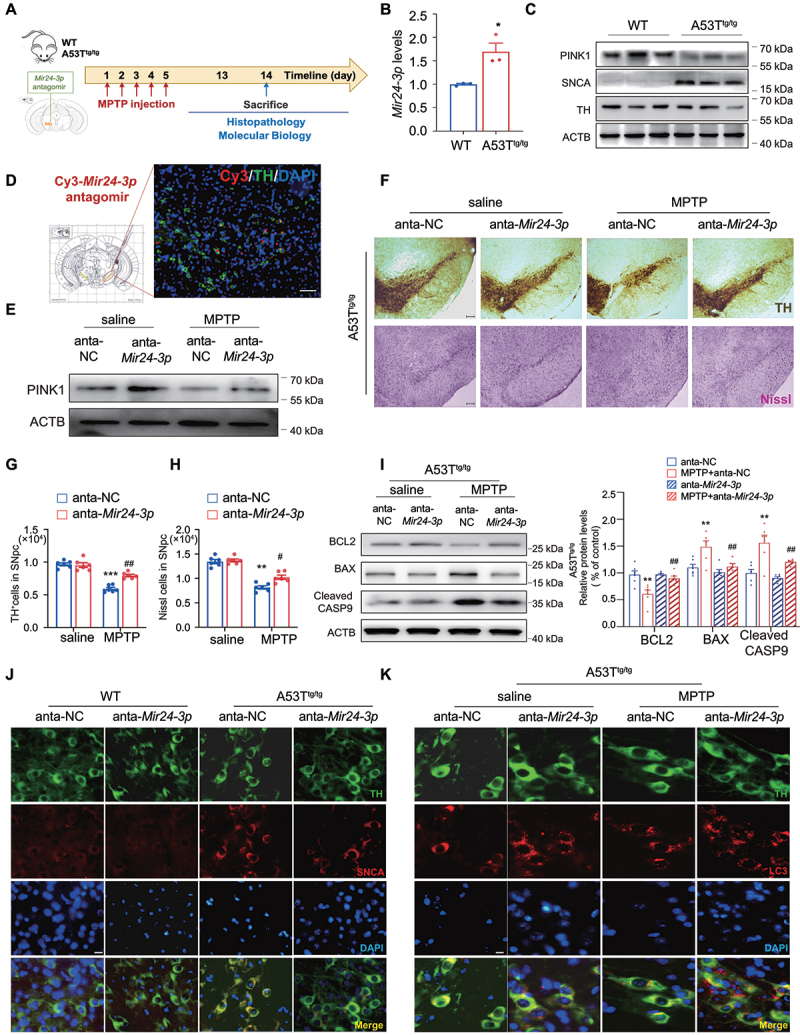
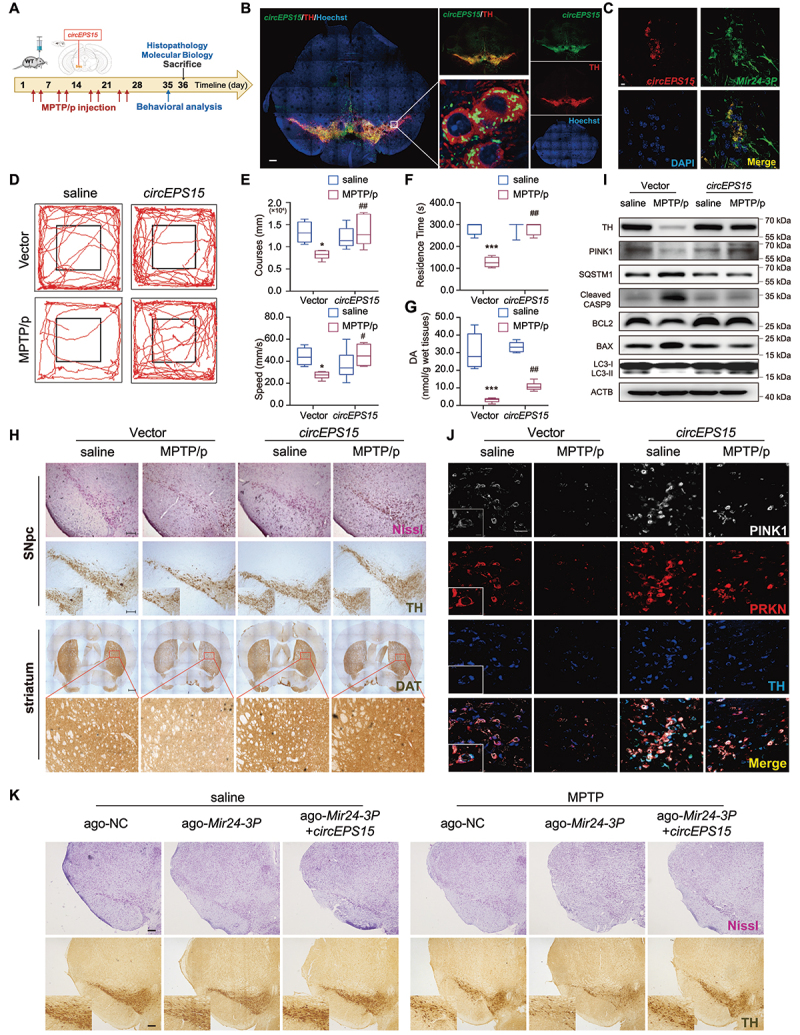
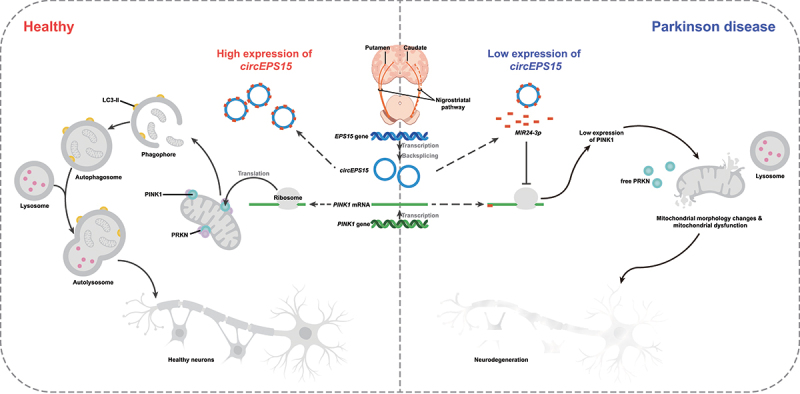
Despite growing evidence that has declared the importance of circRNAs in neurodegenerative diseases, the clinical significance of circRNAs in dopaminergic (DA) neuronal degeneration in the pathogenesis of Parkinson disease (PD) remains unclear. Here, we performed rRNA-depleted RNA sequencing and detected more than 10,000 circRNAs in the plasma samples of PD patients. In consideration of ROC and the correlation between Hohen-Yahr stage (H-Y stage) and Unified Parkinson Disease Rating Scale-motor score (UPDRS) of 40 PD patients, circEPS15 was selected for further research. Low expression of circEPS15 was found in PD patients and there was a negative positive correlation between the circEPS15 level and severity of PD motor symptoms, while overexpression of circEPS15 protected DA neurons against neurotoxin-induced PD-like neurodegeneration in vitro and in vivo. Mechanistically, circEPS15 acted as a MIR24-3p sponge to promote the stable expression of target gene PINK1, thus enhancing PINK1-PRKN-dependent mitophagy to eliminate damaged mitochondria and maintain mitochondrial homeostasis. Thus, circEPS15 rescued DA neuronal degeneration through the MIR24-3p-PINK1 axis-mediated improvement of mitochondrial function. This study reveals that circEPS15 exerts a critical role in participating in PD pathogenesis, and may give us an insight into the novel avenue to develop potential biomarkers and therapeutic targets for PD.Abbreviations: AAV: adeno-associated virus; DA: dopaminergic; FISH: fluorescence in situ hybridizations; HPLC: high-performance liquid chromatography; H-Y stage: Hohen-Yahr stage; LDH: lactate dehydrogenase; MMP: mitochondrial membrane potential; MPTP/p: 1-methyl-4-phenyl-1,2,3,6-tetrahydropyridine/probenecid; NC: negative control; PD: Parkinson disease; PINK1: PTEN induced kinase 1; PBS: phosphate-buffered saline; ROS: reactive oxygen species; SNpc: substantia nigra pars compacta; TEM: transmission electron microscopy; UPDRS: Unified Parkinson's Disease Rating Scale-motor score.

Keywords: CircEPS15; MIR24-3p; PINK1; Parkinson disease; mitophagy.


Conflict of interest statement

No potential conflict of interest was reported by the author(s).

Figures

Figure 1.
Figure 1.
CircEPS15 was downregulated in plasma of PD patients and low circEPS15 was associated with H-Y staging and UPDRS score of PD patients. (A) Heat map representing distinct circRNA expression values in PD patients compared with normal controls. Red scale: higher expression. Blue scale: lower expression. n = 4 samples/group. Statistical significance was evaluated by using ANOVA. (B) Pathway enrichment of circRNA expression. (C) Eleven circRnas expression levels in the plasma of PD patients (40 individuals/group) compared with those in normal controls (40 individuals/group). (D) ROC curve and (E) correlation analysis (UPDRS and Hoehn-Yahr) for individual circEPS15 to separate PD patients from normal controls. (F) Relative circEPS15 levels in midbrain and plasma in chronic and subacute MPTP model, n = 6 male mice/group. (G) the schematic illustration showed the circularization of EPS15 exons 15–18 to form circEPS15. The back-splicing junction of circEPS15 was verified by RT-PCR and Sanger sequencing. (H) CircEPS15 expression in SH-SY5Y cells was detected by RT-PCR. Agarose gel electrophoresis showed that divergent primers amplified circEPS15 in cDNA but not genomic DNA (gDNA). (I) Relative expression levels of circEPS15 and linear EPS15 after treatment with RNase R. n = 6/group. (J) CircEPS15 abundance in nuclear and cytoplasmic fractions of SH-SY5Y cells was evaluated by qPCR. GAPDH acted as a positive control of RNA distributed in the cytoplasm, and U6 RNA acted as a positive control of RNA distributed in the nucleus. n = 6/group. (K) Localization of circEPS15 in SH-SY5Y cells was detected by FISH. Nuclei were stained with DAPI and circEPS15 probes were labeled with Cy3 (red). Scale bar: 10 μm. Statistically significant by Student t-test; *P < 0.05; **P < 0.01; ***P < 0.001.
Figure 2.
Figure 2.
Overexpression of CircEPS15 promoted dopaminergic neuron recovery in vitro. (A) Relative mRNA expression of circEPS15 in various types of cells (primary neuron, astrocytes microglia, SH-SY5Y, C8 and BV2) after treatment with MPP+. Primary neuron: MPP+ 30 μM. Other cells: MPP+ 500 μM. n = 3/group. Cells were transduced with Vector/circEPS15-GFP lentivirus. Vector: empty control lentivirus corresponding to overexpression lentivirus. Representative images of neuron immunostaining for TH (B) and MAP2 (H) in the midbrain, followed by 3D reconstruction and Sholl analysis (C). Scale bar: 20 μm. Average soma size (D), axon length (E), and total dentritic length (F). All data were presented as mean ± SEM. n = 50 cells/group. (Average soma size, circEPS15: F (1,76) = 13.6, P < 0.001; MPP+: F (1, 76) = 9.139, P < 0.001; interaction: F (1, 76) = 8.426, P < 0.001. Axon length, circEPS15: F (1,71) = 31.15, P < 0.01; MPP+: F (1, 71) = 5.270, P = 0.0247; interaction: F (1, 71) = 4.892, P = 0.0302. Dentritic length, circEPS15: F (1, 73) = 15.44, P < 0.01; MPP+: F (1, 73) = 22.40, P < 0.01; interaction: F (1, 73) = 0.3187, P = 0.5741. (G) Expression of TH in Vector vs circEPS15 after treated with MPP+ in neurons. n = 3/group. (I) Representative image of DNA damage of Vector vs circEPS15 after treatment with MPP+. Arrow: apoptosis cells. Scale bar: 100 μm. Relative cell viability (J) and LDH release (K) of Vector vs circEPS15 after treatment with MPP+. n = 5–6/group. (A) ***P < 0.001 vs Control using Student’s t-test. (D-G, J-K) Data were presented as mean ± S.E.M. Two-way ANOVA with Dunnett’s multiple comparisons test. ***P < 0.001 vs Vector-con group; ##P < 0.01, ###P < 0.001 vs Vector-MPP+ group.
Figure 3.
Figure 3.
Overexpression of CircEPS15 promoted mitophagy in SH-SY5Y cells. (A) SH-SY5Y cells were stably transfected with circEPS15-GFP lentivirus. Cells were stained with Annexin V-APC and PI, and the percentage of apoptotic cells was detected by flow cytometry. (B) Data are presented as the mean ± S.E.M of three independent experiments. (C) Relative cell viability of Vector vs circEPS15 was detected after treatment with MPP+ in SH-SY5Y cells. n = 6/group. (D) Representative TEM images of mitochondrial mitophagosomes and lysosomes (M: mitochondrial, A: autophagosome). Scale bar: upper panel: 500 nm; lower panel: 1 μm. (E) Percentage analysis of damage mitochondrial. Cells were stained with JC-1(F, H) and MitoSOX (G, I), the percentage of cells which changed mitochondrial membrane potential and mitochondrial ROS were detected by flow cytometry. Scale bar: 50 μm. (J) Expression and quantitation of BCL2, BAX, cleaved CASP 9, SQSTM1, AIFM1, CYCS, TOMM20, COX4 and ubiquitin in Vector vs circEPS15 after being treated with MPP+ were detected. n = 3/group. (B and C) Data were presented as mean ± S.E.M. Two-way ANOVA with Dunnett’s multiple comparisons test. ***P < 0.001 vs Vector-con group; ##P < 0.01, ###P < 0.001 vs Vector-MPP+ group.
Figure 4.
Figure 4.
CircEPS15 contributed to the mitophagy of SH-SY5Y cells by regulating the expression of PINK1. Heatmap (A) and volcano map (B) of relative expression (compared with circEPS15 OE-MPP+ group and Vector-MPP+ group) for each transcript was generated. (C) Pathway enrichment analysis (KEGG) for genes expressed preferentially is shown. (D) Differentially expressed genes closely related to PD and mitophagy were selected and validated with RT-PCR. n = 3/group. **P < 0.01 vs Control using ANOVA. (E) Representative images of immunofluorescence double-labeling PINK1 (green), COX4 (red). Scale bar: 10 μm. (F) Representative images of immunofluorescence double-labeling MitoTracker (white) and LC3 (red). Scale bar: 10 μm. (G) the intensity of PINK1 and COX4 after treatment with MPP+. (H) the intensity of LC3 after treatment with MPP+. (I) Expression and quantitation of PINK1 and PRKN in Vector vs circEPS15 after being treated with MPP+ were detected. n = 3/group. Relative cell viability and LDH release (J) of scramble vs siPINK1 after treatment with MPP+. n = 6/group. Scramble: which was almost identical in chemical structure but do not target the target gene (PINK1) in sequence design. Relative images of immunofluorescence staining with JC-1(K) and MitoSOX (L) after PINK1 was knocked down. Scale bar: 50 μm. (M) in circEPS15 overexpressing cells, immunoblot analysis of BCL2, BAX, cleaved CASP9, LC3, SQSTM1, PRKN and COX4 after treatment with MPP+ while PINK1 was knocked down. n = 3/group. Data were presented as mean ± S.E.M. Two-way ANOVA with Dunnett’s multiple comparisons test. ***P < 0.001 vs Vector-con group; ##P < 0.01, ###P < 0.001 vs Vector-MPP+ group.
Figure 5.
Figure 5.
CircEPS15 acted as a sponge for miR-24-3p in SH-SY5Y cells. (A) Combined analysis of bioinformatics prediction to screen 5 for circEPS15-binding miRnas. NC: Negative Control as the control of miRNA. (B) Relative mRNA expression induced by MPP+ was detected after being transfected with these five miRnas (MIR30, Mir29a-5p, MIR24-3p, MIR138 and MIR145). n = 6/group. (C) Relative luciferase activity of wild-type and 3’-UTR mutant constructs of co-transfected with these 5 miRnas and miRNA negative control. (D) the two sites of circEPS15 binding with MIR24-3p wild-type and mutant. (E) HEK293T cells were transfected with wild-type or mutant circEPS15 luciferase reporter vector, and luciferase reporter activity was detected. n = 4–6/group. (F) RIP assays were performed using AGO2 antibody in SH-SY5Y cells, then the enrichment of circEPS15 was detected by qPCR. n = 4–6/group. (G) Colocalization of circEPS15 and MIR24-3p in the cytoplasm of SH-SY5Y cell by FISH analysis. Green, MIR24-3p; Red, circEPS15; Blue, DAPI. Scale bar: 10 μm. (H) the intensity of circEPS15 and MIR24-3p. (I) Cell viability was detected after being transfected with circEPS15 or co-transfected with circEPS15 and MIR24-3p. n = 6/group. (J) Immunoblot analysis of BCL2, BAX, cleaved CASP9, LC3, SQSTM1, PINK1 and PRKN. Cells were stained with Annexin V-APC and PI (K), JC-1(L) and MitoSOX (M), the percentage of apoptotic cells and cells which changed mitochondrial membrane potential and mitochondrial ROS were detected by flow cytometry. n = 3/group. (B, C, I) the data were presented as mean ± S.E.M. ***P < 0.001 using the Student’s t-test. (E, F) the data were presented as mean ± S.E.M. ***P < 0.001 using two-way ANOVA with Dunnett’s multiple comparisons tests.
Figure 6.
Figure 6.
PINK1 was a direct target gene of MIR24-3p, and anti-MIR24-3p had a neuroprotective effect in vitro. (A) Putative MIR24-3p binding sites in PINK1 (PINK1 gene) in different species. (B) Relative luciferase activity of wild-type and 3’-UTR mutant constructs of PINK1 co-transfected with MIR24-3p mimics and miRNA negative control. n = 4/group. (C) Western blot was used to detect the expression level of PINK1 when transfected with MIR24-3p mimics or inhibitors. n = 6/group. Minic-NC: minic negative control, anti-NC: inhibitor negative control. Cell viability, LDH release and representative images of DNA damage using Hoechst staining (D-E) were detected after being treated with 500 μM MPP+ while transfected with MIR24-3p mimics. n = 4–6/group. Scale bar: 50 μm. Arrow: apoptosis cells. (F) Cells were stained with Annexin V-APC and PI, and the percentage of apoptotic cells was detected by flow cytometry while transfected with MIR24-3p mimics. n = 3/group. (G) Immunoblot analysis and quantitation of BCL2, BAX and cleaved CASP9 while transfected with MIR24-3p mimics. n = 3/group. Cells were stained with JC-1 (H) and MitoTracker (I), and the percentage of cells that changed MMP and MitoTracker red/green was detected by flow cytometry while transfected with MIR24-3p mimics. n = 3/group. (J) Colocalization of GFP-LC3 and MitoTracker transfected with anti-MIR24-3p in the SH-SY5Y cell. Green, GFP-LC3; Red, MitoTracker; Blue, DAPI. Scale bar: 10 μm. (K) Expressions of BAX, BCL2, cleaved CASP9, PRKN and COX4 were detected. Cytoplasm and mitochondria were separated to detect the expression of PRKN after being transfected with anti-MIR24-3p. n = 3/group. (L) Colocalization of Cy3-Mir24-3p and TH injected with Mir24-3p antagomir. (M) Immunohistochemical staining of TH+ neuron and Nissl staining of neuron injected with Mir24-3p antagomir in the WT and pink1-/- mice after MPTP treatment. n = 3 male mice/group. Anta-NC: antagomir negative control which was used as control of antagomir-Mir24-3p, (N) Immunoblot analysis of BCL2, BAX and TH in the WT and pink1-/- mice after MPTP treatment. Data were presented as mean ± S.E.M. **P < 0.01, ***P < 0.001 vs control group. ###P < 0.001 vs MPP+ group. Two-way ANOVA with Dunnett’s multiple comparisons test (B, E-F). **P < 0.01, ***P < 0.001 vs control using Student’s t-test (C).
Figure 7.
Figure 7.
Anti-Mir24-3p played a neuroprotective effect in vivo. (A) Schematic diagram of the model injected Cy3-Mir24-3p-antagomir to the midbrain of A53Ttg/tg mice. n = 6 male mice/group. (B) QT-PCR showed the expression of Mir24-3p was upregulated in A53Ttg/tg mice. n = 3/group. (C) Immunoblot for PINK1, SNCA and TH in the midbrain of WT and A53Ttg/tg mice. (D) Colocalization of Cy3 and TH after the Mir24-3p antagomir microinjection into the midbrain. Green, TH; Red, Cy3; Blue, DAPI. Scale bar: 100 μm. (E) the expression of PINK1 was detected by WB in the subacute MPTP model. (F) Immunohistochemical staining of TH+ neuron and Nissl staining of neuron in the SNpc after subacute MPTP treatment. (G) Counting TH+ neuron and (H) Nissl+ cells in the SNpc. n = 6 male mice/group. (I) Immunoblot analysis and quantitation of BCL2, BAX and cleaved CASP9 in A53Ttg/tg mice after subacute MPTP treatment. n = 6/group. (J) Colocalization of TH and SNCA in WT and A53Ttg/tg mice. Green, TH; Red, SNCA; Blue, DAPI. (K) Colocalization of TH and LC3 in A53Ttg/tg mice after subacute MPTP treatment. Green, TH; Red, LC3; Blue, DAPI. *P < 0.05 using Student’s t-test (B). Data were presented as mean ± S.E.M. ***P < 0.001 vs anta-NC-saline group. #P < 0.05, ##P < 0.01 vs anta-NC-MPTP group. Two-way ANOVA with Dunnett’s multiple comparisons test (G and H).
Figure 8.
Figure 8.
CircEPS15 promoted the recovery of dopaminergic neurons in vivo. (A) Schematic diagram of the mouse MPTP/p model. (B) Expression efficiency of circEPS15 overexpression. Red, TH; Green, circEPS15; Blue, Hoechst. Scale bar: 100 μm. (C) Colocalization of circEPS15 and Mir24-3p using FISH. Red, circEPS15; Green, Mir24-3p; Blue, DAPI. Scale bar: 10 μm. (D) Representative motor performance in the open field test. Mice were in an open field within 5 min and recorded movement distance. n = 6 male mice/group. (E) Speed and course in the open field test. (F) Time is taken for mice residence in the bar. (G) the level of dopamine in mouse striatum homogenate was detected by HPLC. (H) Immunohistochemical staining of TH+ neuron and Nissl staining of neuron in the SNpc (upper panel). Immunohistochemical staining of TH+ neuron in the striatum (lower panel). (I) TH, PINK1, BCL2, BAX, cleaved CASP9, LC3 and SQSTM1 from mouse mesencephalon homogenate were analyzed by immunoblotting. (J) Colocalization of PINK1, PRKN and TH transfected with circEPS15 in the SNpc of control and MPTP/p group. (K) Immunohistochemical staining of TH+ neuron and Nissl staining of neuron in the SNpc. Ago-NC: agomir negative control which was used as control of agomir-Mir24-3p. White, PINK1; Red, PRKN; Blue, TH. Scale bar: 100 μm. Data were presented as mean ± S.E.M. *P < 0.05, ***P < 0.001 vs Vector-saline group. #P < 0.05, ##P < 0.01 vs Vector-MPTP/p group. Two-way ANOVA with Dunnett’s multiple comparisons test (G and H).
Figure 9.
Figure 9.
Schematic diagram: the mechanism by which circEPS15 acts as a MIR24-3p sponge to maintain the expression of PINK1 thus enhancing PINK1-PRKN-dependent mitophagy to promote DA neuron recovery and improve mitochondrial function in vitro and in vivo.

References

    1. Cheng HC, Ulane CM, Burke RE.. Clinical progression in Parkinson disease and the neurobiology of axons. Ann Neurol. 2010;67(6):715–725. - PMC - PubMed
    1. Verduci L, Strano S, Yarden Y, et al. The circRNA-microRNA code: emerging implications for cancer diagnosis and treatment. Mol Oncol. 2019;13(4):669–680. DOI:10.1002/1878-0261.12468 - DOI - PMC - PubMed
    1. Mahmoudi E, Cairns MJ. Circular RNAs are temporospatially regulated throughout development and ageing in the rat. Sci Rep. 2019;9(1):2564. - PMC - PubMed
    1. You X, Vlatkovic I, Babic A, et al. Neural circular RNAs are derived from synaptic genes and regulated by development and plasticity. Nat Neurosci. 2015;18(4):603–610. DOI:10.1038/nn.3975 - DOI - PMC - PubMed
    1. Zhao Y, Alexandrov PN, Jaber V, et al. Deficiency in the Ubiquitin Conjugating Enzyme UBE2A in Alzheimer’s Disease (AD) is linked to deficits in a natural circular miRNA-7 sponge (circRNA; ciRS-7). Genes (Basel). 2016;7(12):116. DOI:10.3390/genes7120116 - DOI - PMC - PubMed

Publication types