. 2023 Jun 1;133(11):e157782.
doi: 10.1172/JCI157782.

Accumulation of α-synuclein mediates podocyte injury in Fabry nephropathy

Affiliations

Accumulation of α-synuclein mediates podocyte injury in Fabry nephropathy

Fabian Braun et al. J Clin Invest. .

Abstract

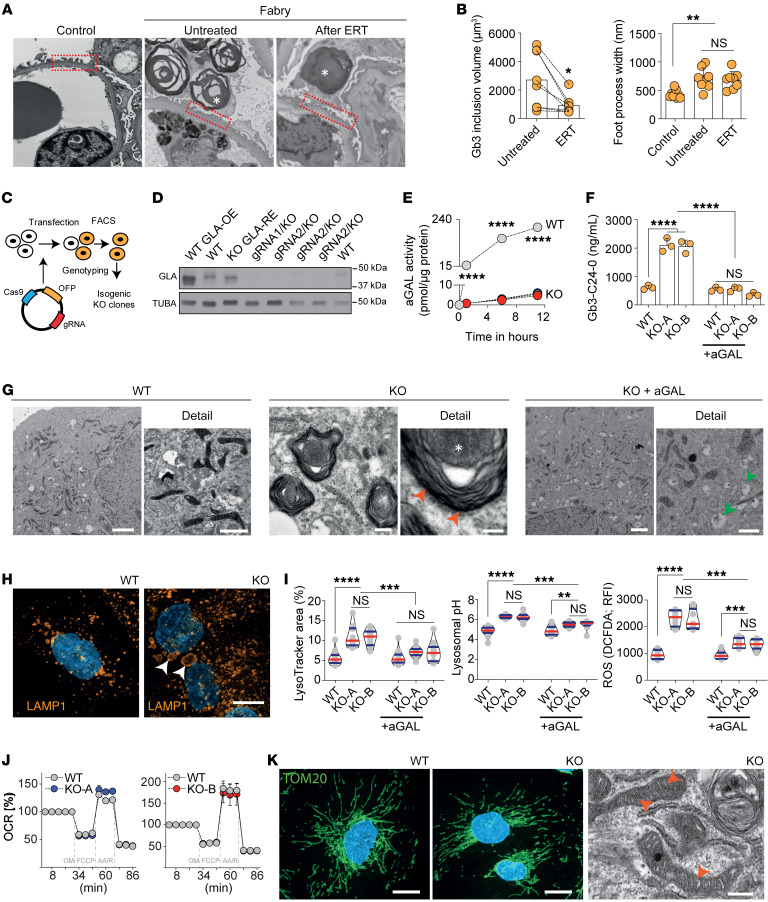
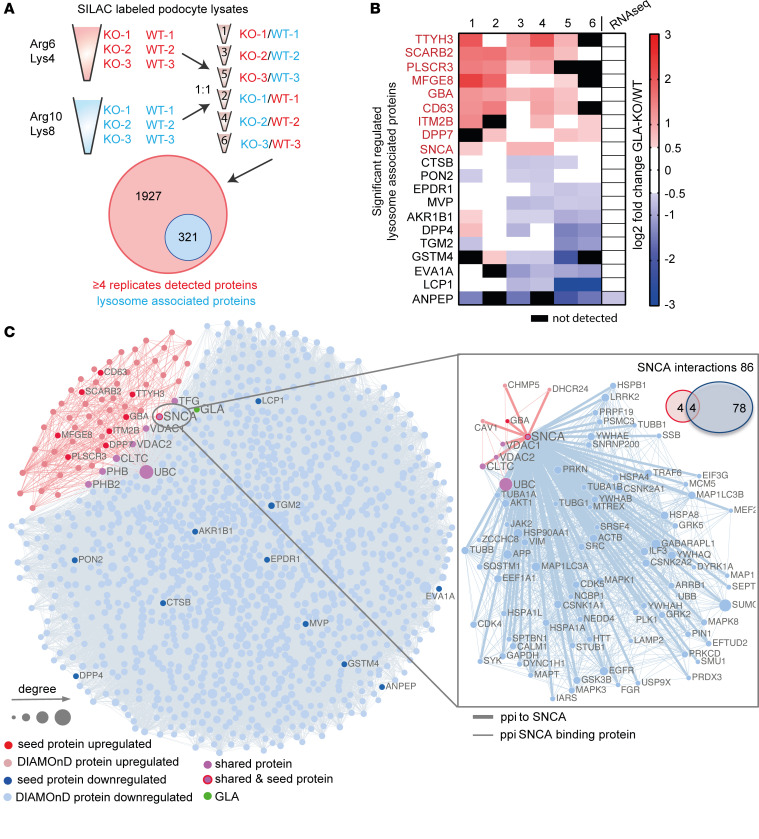
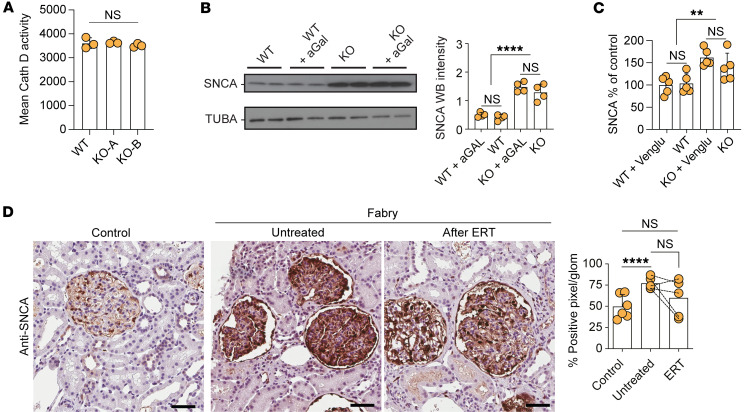
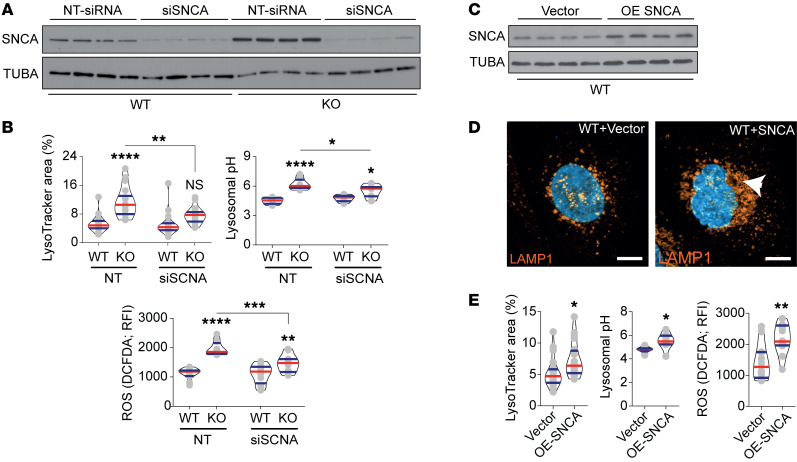
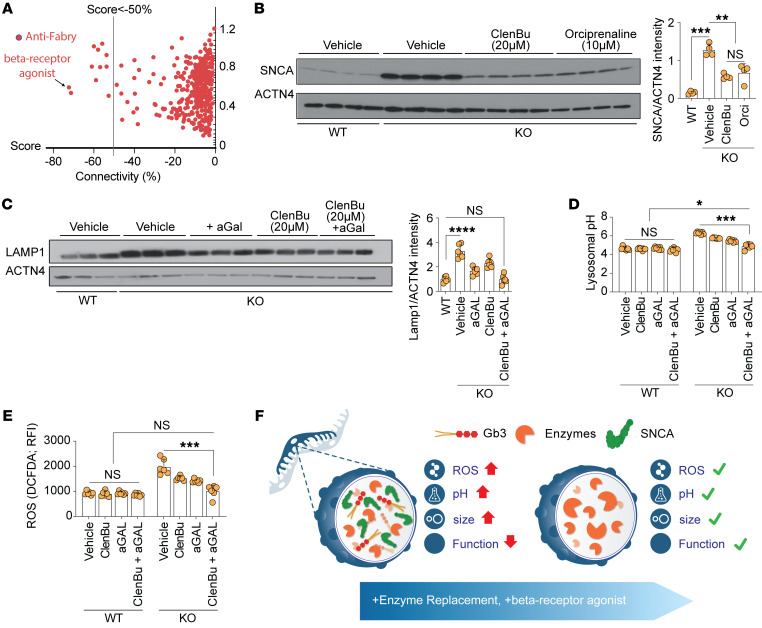
Current therapies for Fabry disease are based on reversing intracellular accumulation of globotriaosylceramide (Gb3) by enzyme replacement therapy (ERT) or chaperone-mediated stabilization of the defective enzyme, thereby alleviating lysosomal dysfunction. However, their effect in the reversal of end-organ damage, like kidney injury and chronic kidney disease, remains unclear. In this study, ultrastructural analysis of serial human kidney biopsies showed that long-term use of ERT reduced Gb3 accumulation in podocytes but did not reverse podocyte injury. Then, a CRISPR/Cas9-mediated α-galactosidase knockout podocyte cell line confirmed ERT-mediated reversal of Gb3 accumulation without resolution of lysosomal dysfunction. Transcriptome-based connectivity mapping and SILAC-based quantitative proteomics identified α-synuclein (SNCA) accumulation as a key event mediating podocyte injury. Genetic and pharmacological inhibition of SNCA improved lysosomal structure and function in Fabry podocytes, exceeding the benefits of ERT. Together, this work reconceptualizes Fabry-associated cell injury beyond Gb3 accumulation, and introduces SNCA modulation as a potential intervention, especially for patients with Fabry nephropathy.

Keywords: Chronic kidney disease; Drug therapy; Genetic diseases; Genetics; Nephrology.


Figures

Figure 1
Figure 1. Podocytes in Fabry disease show persistent lysosomal dysfunction and damage despite enzyme replacement therapy.
(A) Transmission electron microscopy (TEM) comparison of foot processes between control and Fabry kidney biopsy before and after ERT with many foot processes widened in Fabry biopsies both untreated and after ERT. Asterisks show Gb3 inclusions in podocytes. Original magnification, ×52,800. (B) Significant decrease of podocyte Gb3 inclusions after ERT but persistence of increased foot process width. (C) Schematic overview of GLA-knockout (KO) podocyte generation by CRISPR/Cas9 genome editing. (D) Western blots show a complete absence of GLA expression in several GLA-KO clones. (E) Abolished GLA activity in 2 KO clones compared with WT cells. (F) Mass spectrometry analysis confirms the accumulation of Gb3-C24-0 isoform in KO cells, normalized upon 96 hours of α-galactosidase therapy (n = 3). (G) TEM shows zebra bodies exclusively in GLA-KO clones (red arrowheads). While WT cells depict a normal ultrastructure, aGAL-treated KO cells have remnant vacuoles (green arrowheads) without zebra bodies. Scale bars: 1 μm. (H) Lysosomal visualization using LAMP1 staining in differentiated WT and KO cells reveals an increased number and size (arrowheads) of lysosomes in the GLA-KO cells. Scale bar: 10 μm. (I) Quantification of lysosomal area (n = 14), pH (n = 12), and ROS production (n = 8). (J) Seahorse XFp experiments confirm normal mitochondrial function in KO cells (n = 8). OCR, oxygen consumption rate. (K) Mitochondrial import receptor subunit (TOM20) staining in WT and KO cells is equally abundant and normally distributed. TEM images confirm a normal mitochondrial ultrastructure in KO cells. Scale bars: 10 μm in immunofluorescence, 500 nm in electron microscopy. Violin plots indicate median (red) and upper and lower quartile (blue). *P < 0.05, **P < 0.01, ***P < 0.001, ****P < 0.0001. One-way ANOVA with Tukey’s multiple-comparison test.
Figure 2
Figure 2. SILAC-based proteomics and network analyses identify SNCA accumulation as a potential pathogenic pathway.
(A) Schematic overview of mass spectrometry analysis using SILAC-labeled WT and KO clones. Mass spectrometry yielded 2,248 proteins, among which 321 are lysosome-enriched. (B) The top 10 up- and downregulated lysosome-enriched proteins. (C) Network-based analysis of up- and downregulated lysosomal proteins associated with GLA knockout. Nodes represent genes and are connected if there is a known protein interaction between them. The node size is proportional to the number of its connections. Red and blue nodes represent up- and downregulated seed proteins, respectively. Light red and light blue nodes represent the respective DIAMOnD proteins. GLA is depicted as a green node. Pink nodes indicate shared proteins between the 2 modules. The separate network and Venn diagram on the right show the number and interaction partners of SNCA.
Figure 3
Figure 3. SNCA accumulation is resistant to enzyme replacement and substrate reduction therapy.
(A) Mean cathepsin D activity in WT cells and 2 KO clones showing no differences in enzyme activity (n = 3). (B) Western blots of SNCA and TUBA in vehicle- and aGAL-treated WT and KO cells with quantification confirming the overexpression of SNCA protein and its resistance to aGAL treatment (n = 4). (C) Human SNCA ELISA depicting SNCA accumulation in KO clones and resistance to substrate reduction therapy using Venglustat (n = 5). (D) SNCA staining in representative images and quantification of human renal biopsies showing increase in untreated Fabry samples with resistant accumulation in patients who underwent 5 years of ERT (n = 5). Scale bars: 50 μm. **P < 0.01, ****P < 0.0001. One-way ANOVA with Tukey’s multiple-comparison test.
Figure 4
Figure 4. SNCA mediates observed lysosomal dysfunction.
(A) Representative Western blot confirming the efficacy of siRNA targeting SNCA in WT and KO clones (n = 4). (B) Quantification of lysosomal area, pH, and ROS production upon SNCA siRNA treatment (n = 18). (C) Representative Western blot confirming the overexpression of SNCA in WT cells (n = 4). (D) LAMP1 immunofluorescence staining shows an increase in lysosomal aggregation upon SNCA overexpression (arrowhead). Scale bars: 10 μm. (E) Quantification of lysosomal area (n = 20), pH (n = 8), and ROS production (n = 12) upon SNCA overexpression. Violin plots indicate median (red) and upper and lower quartile (blue). *P < 0.05, **P < 0.01, ***P < 0.001, ****P <0.0001. One-way ANOVA with Tukey’s multiple-comparison test (B); unpaired, 2-tailed Student’s t test (E).
Figure 5
Figure 5. β2-Adrenergic receptor agonists decrease SNCA protein levels and ameliorate lysosomal dysfunction.
(A) Connectivity mapping showing anti-Fabry compounds, with the β2-adrenergic receptor agonist orciprenaline exhibiting the highest score. (B) Western blots show the expression of SNCA in WT and untreated GLA-KO cells and KO cells treated with 20 μM clenbuterol and 10 μM orciprenaline (n = 6). (C) Western blots depict the expression of LAMP1 and ACTN4 in WT and untreated GLA-KO cells and KO cells treated with aGAL, 20 μM clenbuterol, and combined therapy (n = 6). (D) Lysosomal pH analysis in all conditions demonstrates independent and additive effects of β2-adrenergic receptor agonist in GLA-KO cells (n = 6). (E) Lysosomal ROS analysis demonstrates independent and additive effects of β2-adrenergic receptor agonist in GLA-KO cells (n = 6). (F) Schematic summary depicting the overall findings of the study: Fabry podocyte lysosomes are characterized by increased size, pH, and ROS production with subsequently decreased function due to Gb3 and SNCA accumulation. This phenotype can be ameliorated through ERT combined with compounds decreasing SNCA accumulation, like β-receptor agonists. Bar graphs depict standard deviation. *P < 0.05, **P < 0.01, ***P < 0.001, ****P < 0.0001. One-way ANOVA with Tukey’s multiple-comparison test.

Comment in

References

    1. Anderson W. A case of “angeio-keratoma. ” Br J Dermatol. 1898;10(4):113–117. doi: 10.1111/j.1365-2133.1898.tb16317.x. - DOI
    1. Kuech EM, et al. Alterations in membrane trafficking and pathophysiological implications in lysosomal storage disorders. Biochimie. 2016;130:152–162. doi: 10.1016/j.biochi.2016.09.011. - DOI - PubMed
    1. Guce AI, et al. Catalytic mechanism of human alpha-galactosidase. J Biol Chem. 2009;285(6):3625–3632. - PMC - PubMed
    1. Schiffmann R. Fabry disease. Handb Clin Neurol. 2015;132:231–248. doi: 10.1016/B978-0-444-62702-5.00017-2. - DOI - PubMed
    1. Mehta A, et al. Natural course of Fabry disease: changing pattern of causes of death in FOS — Fabry Outcome Survey. J Med Genet. 2009;46(8):548–552. doi: 10.1136/jmg.2008.065904. - DOI - PubMed

Publication types

MeSH terms