Dissection of a Down syndrome-associated trisomy to separate the gene dosage-dependent and -independent effects of an extra chromosome
- PMID: 37014740
- PMCID: PMC10281752
- DOI: 10.1093/hmg/ddad056
Dissection of a Down syndrome-associated trisomy to separate the gene dosage-dependent and -independent effects of an extra chromosome
Erratum in
-
Correction to: Dissection of a Down syndrome-associated trisomy to separate the gene dosage-dependent and -independent effects of an extra chromosome.Hum Mol Genet. 2023 Jun 19;32(13):2264. doi: 10.1093/hmg/ddad082. Hum Mol Genet. 2023. PMID: 37203267 Free PMC article. No abstract available.
Abstract
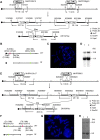
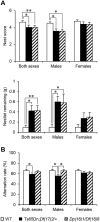
As an aneuploidy, trisomy is associated with mammalian embryonic and postnatal abnormalities. Understanding the underlying mechanisms involved in mutant phenotypes is broadly important and may lead to new strategies to treat clinical manifestations in individuals with trisomies, such as trisomy 21 [Down syndrome (DS)]. Although increased gene dosage effects because of a trisomy may account for the mutant phenotypes, there is also the possibility that phenotypic consequences of a trisomy can arise because of the presence of a freely segregating extra chromosome with its own centromere, i.e. a 'free trisomy' independent of gene dosage effects. Presently, there are no reports of attempts to functionally separate these two types of effects in mammals. To fill this gap, here we describe a strategy that employed two new mouse models of DS, Ts65Dn;Df(17)2Yey/+ and Dp(16)1Yey/Df(16)8Yey. Both models carry triplications of the same 103 human chromosome 21 gene orthologs; however, only Ts65Dn;Df(17)2Yey/+ mice carry a free trisomy. Comparison of these models revealed the gene dosage-independent impacts of an extra chromosome at the phenotypic and molecular levels for the first time. They are reflected by impairments of Ts65Dn;Df(17)2Yey/+ males in T-maze tests when compared with Dp(16)1Yey/Df(16)8Yey males. Results from the transcriptomic analysis suggest the extra chromosome plays a major role in trisomy-associated expression alterations of disomic genes beyond gene dosage effects. This model system can now be used to deepen our mechanistic understanding of this common human aneuploidy and obtain new insights into the effects of free trisomies in other human diseases such as cancers.
© The Author(s) 2023. Published by Oxford University Press. All rights reserved. For Permissions, please email: journals.permissions@oup.com.
Conflict of interest statement
None of the authors has any conflict of interests.
Figures


Similar articles
-
Overlapping trisomies for human chromosome 21 orthologs produce similar effects on skull and brain morphology of Dp(16)1Yey and Ts65Dn mice.Am J Med Genet A. 2014 Aug;164A(8):1981-1990. doi: 10.1002/ajmg.a.36594. Epub 2014 May 1. Am J Med Genet A. 2014. PMID: 24788405 Free PMC article.
-
Segmental trisomy of chromosome 17: a mouse model of human aneuploidy syndromes.Proc Natl Acad Sci U S A. 2005 Mar 22;102(12):4500-5. doi: 10.1073/pnas.0500802102. Epub 2005 Mar 8. Proc Natl Acad Sci U S A. 2005. PMID: 15755806 Free PMC article.
-
Highly penetrant myeloproliferative disease in the Ts65Dn mouse model of Down syndrome.Blood. 2008 Jan 15;111(2):767-75. doi: 10.1182/blood-2007-04-085670. Epub 2007 Sep 27. Blood. 2008. PMID: 17901249 Free PMC article.
-
Consequences of chromosome gain: A new view on trisomy syndromes.Am J Hum Genet. 2022 Dec 1;109(12):2126-2140. doi: 10.1016/j.ajhg.2022.10.014. Am J Hum Genet. 2022. PMID: 36459979 Free PMC article. Review.
-
Mouse models of aneuploidy to understand chromosome disorders.Mamm Genome. 2022 Mar;33(1):157-168. doi: 10.1007/s00335-021-09930-z. Epub 2021 Nov 1. Mamm Genome. 2022. PMID: 34719726 Free PMC article. Review.
Cited by
-
Illuminating the druggable genome: Pathways to progress.Drug Discov Today. 2024 Mar;29(3):103805. doi: 10.1016/j.drudis.2023.103805. Epub 2023 Oct 27. Drug Discov Today. 2024. PMID: 37890715 Free PMC article. Review.
-
Copy number normalization distinguishes differential signals driven by copy number differences in ATAC-seq and ChIP-seq.BMC Genomics. 2025 Mar 28;26(1):306. doi: 10.1186/s12864-025-11442-y. BMC Genomics. 2025. PMID: 40155863 Free PMC article.
-
Compromised femoral and lumbovertebral bone in the Dp(16)1Yey Down syndrome mouse model.Bone. 2024 Apr;181:117046. doi: 10.1016/j.bone.2024.117046. Epub 2024 Feb 7. Bone. 2024. PMID: 38336158 Free PMC article.
-
Sex-specific developmental alterations in DYRK1A expression in the brain of a Down syndrome mouse model.Neurobiol Dis. 2024 Jan;190:106359. doi: 10.1016/j.nbd.2023.106359. Epub 2023 Nov 20. Neurobiol Dis. 2024. PMID: 37992782 Free PMC article.
References
-
- Antonarakis, S.E. (2017) Down syndrome and the complexity of genome dosage imbalance. Nat. Rev. Genet., 18, 147–163. - PubMed
-
- Cataldo, A.M., Petanceska, S., Peterhoff, C.M., Terio, N.B., Epstein, C.J., Villar, A., Carlson, E.J., Staufenbiel, M. and Nixon, R.A. (2003) App gene dosage modulates endosomal abnormalities of Alzheimer's disease in a segmental trisomy 16 mouse model of Down syndrome. J. Neurosci., 23, 6788–6792. - PMC - PubMed
-
- Prasher, V.P., Farrer, M.J., Kessling, A.M., Fisher, E.M., West, R.J., Barber, P.C. and Butler, A.C. (1998) Molecular mapping of Alzheimer-type dementia in Down's syndrome. Ann. Neurol., 43, 380–383. - PubMed
Publication types
MeSH terms
Grants and funding
LinkOut - more resources
Full Text Sources
Medical
Molecular Biology Databases
Research Materials
Miscellaneous

