. 2023 Apr 25;42(4):112339.
doi: 10.1016/j.celrep.2023.112339. Epub 2023 Apr 3.

SENP3 and USP7 regulate Polycomb-rixosome interactions and silencing functions

Affiliations

SENP3 and USP7 regulate Polycomb-rixosome interactions and silencing functions

Haining Zhou et al. Cell Rep. .

Abstract

The rixosome and PRC1 silencing complexes are associated with deSUMOylating and deubiquitinating enzymes, SENP3 and USP7, respectively. How deSUMOylation and deubiquitylation contribute to rixosome- and Polycomb-mediated silencing is not fully understood. Here, we show that the enzymatic activities of SENP3 and USP7 are required for silencing of Polycomb target genes. SENP3 deSUMOylates several rixosome subunits, and this activity is required for association of the rixosome with PRC1. USP7 associates with canonical PRC1 (cPRC1) and deubiquitinates the chromodomain subunits CBX2 and CBX4, and inhibition of USP activity results in disassembly of cPRC1. Finally, both SENP3 and USP7 are required for Polycomb- and rixosome-dependent silencing at an ectopic reporter locus. These findings demonstrate that SUMOylation and ubiquitination regulate the assembly and activities of the rixosome and Polycomb complexes and raise the possibility that these modifications provide regulatory mechanisms that may be utilized during development or in response to environmental challenges.

Keywords: CP: Molecular biology; SENP3; SUMO; USP7; deSUMOylation; deubiquitination; epigenetics; gene silencing; heterochromatin; polycomb; rixosome; ubiquitin.


Conflict of interest statement

Declaration of interests The authors declare no competing interests.

Figures
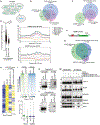
Figure 1.
Figure 1.. SENP3 is required for Polycomb target gene repression
(A) Diagram showing the composition of rixosome. Arrow highlights the interaction of the TEX10 subunit of the rixosome with PRC1. (B and C) Venn diagrams showing overlap among upregulated (B) and downregulated (C) genes in SENP3 KD with upregulated genes in EED KO and RING1A/B DKO cells in RNA-seq experiments. Hypergeometric probability p values: siSENP3 upreg vs. RING1A/B DKO upreg, 4 x 10−374; siSENP3 upreg vs. EED KO upreg, 2 x 10−354, siSENP3 downreg vs. RING1A/B DKO upreg, 1.5 x 10⁻⁷; siSENP3 downreg vs. EED KO, 1.8 x 10⁻⁸ upreg. (D) Dot plots showing RNA-seq changes of siSENP3 compared with siControl (siCtrl) in the EED KO-upregulated and -downregulated sets of genes in RNA-seq experiments with two biological replicates in HEK293FT cells. Data are presented as mean values +/− SEM. p value is from the two-tailed Wilcoxon test. (E) Average distribution of the indicated ChIP-seq reads (log2) for genes upregulated (up) and downregulated genes (down) in siSENP3 RNA-seq experiments from HEK293FT cells. Enrichment levels were normalized with reads per genome coverage. Read counts per gene were summed in 50-nt bins. (F) Diagram of the SENP3 protein and the catalytic point mutation C532A. CC, coiled-coil domains; protease, deSUMOylation catalytic domain. (G) Venn diagrams showing overlap among upregulated genes in SENP3 KD with upregulated genes in SENP3 KD with SENP3 wild-type (WT) or C532A mutant rescue in RNA-seq experiments. (H) Heatmap representations of RNA-seq (two biological replicates) relative gene expression in siControl (siCtrl), siSENP3, siSENP3+SENP3 WT, or siSENP3+SENP3 C532A mutant rescue cells. (I) Heatmap representations of ChIP-seq (two biological replicates) of TEX10 and RING1B in siControl (siCtrl) or siSENP3 cells. Rank order is from most to least TEX10 (siCtrl) signal. Enrichment levels (log2) were normalized with reads per genome coverage. Read counts per gene were averaged in 50-nt bins. (J) Boxplots of normalized enrichment profile of ChIP-seq (two biological replicates) from (I) in TEX10 occupied regions (n = 7,647, where n represents the number of occupied regions). Enrichment levels (log2) were normalized with reads per genome coverage. p = 1.0 x 10−100 for TEX10; p = 0.9 for RING1B. p values are from two-tailed Mann-Whitney test. (M) Immunoprecipitations (IPs) showing the association of rixosome subunits TEX10, NOL9, WDR18, and SENP3 and PRC1 subunits RING1B and BMI1 in HEK293FT cells treated with siCtrl, siSENP3, siSENP3+wild-type SENP3 rescue, or siSENP3+SENP3 C532A mutant rescue. Note that in the rescue experiments, SENP3 is RGS-tagged and migrates slower.
Figure 2.
Figure 2.. USP7 associates with cPRC1 and is required for Polycomb target gene repression
(A) Table showing spectral counts of IP (from two biological replicates) samples from untagged and CBX2 endogenously Flag-tagged HEK293FT cells. Normalized spectral counts on the right side were obtained by dividing total spectral counts by the number of amino acids (length) of each protein. The normalized spectral counts for the bait protein (CBX2, CBX4, or PCH2) were set to 1, and the counts for co-purifying proteins are presented relative to the bait. (B) Table showing spectral counts of IP (from two biological replicates) samples from untagged and PHC2 or CBX4 endogenously Flag-tagged HEK293FT cells. (C) Schematic diagram showing the composition of canonical PRC1 complex (cPRC1). In HEK293FT cells, cPRC1 contains SCML2 and USP7 in addition to its core components RING1A/B, PCGF2/4, PHC1/2/3, and CBX2/4/6/7/8 (only CBX2, 4, and 8 are expressed in HEK293FT). (D) Immunoprecipitation (IP) experiments showing the association of USP7 with cPRC1 subunits CBX2, CBX4, and RING1B in HEK293FT cells. (E and F) Venn diagrams showing overlap among upregulated (E) and downregulated (F) genes in siUSP7 with upregulated genes in EED KO and RING1A/B DKO cells in RNA-seq experiments. Hypergeometric probability p values: siUSP7 upreg vs. RING1A/B DKO upreg, 2.8 x 10−517; siUSP7 upreg vs. EED KO, 9.6 x 10−393 upreg, siUSP7 downreg vs. RING1A/B DKO upreg, 0.2; siSENP3 downreg vs. EED KO upreg, 0.4. (G) Dot plots showing RNA-seq changes (from two biological replicates) of siUSP7 compared with siControl (siCtrl) in the EED KO-upregulated and -downregulated sets of genes in RNA-seq experiments in HEK293FT cells. Data are presented as mean values +/− SEM. p value is from the two-tailed Wilcoxon test. (H and I) Average distribution of the indicated ChIP-seq reads (log2) (from two biological replicates) for genes upregulated (H) and downregulated genes (I) in siUSP7 RNA-seq experiments from HEK293FT cells. Enrichment levels were normalized with reads per genome coverage. Read counts per gene were summed in 50-nt bins. (J) Genome browser snapshots of RNA-seq experiments showing expression levels of the indicated genes in siCtrl and siUSP7 cells and ChIP-seq showing enrichment of RING1B, H2AK119ub1, and H3K27me3. Enrichment levels were normalized with reads per genome coverage.
Figure 3.
Figure 3.. USP7 deubiquitylates cPRC1 subunits and promotes cPRC1 binding to chromatin
(A) Immunoblotting showing anti-ubiquitin immunoprecipitations (IPs) in Flag-CBX2 HEK293FT cells treated with siCtrl or siUSP7 (3 days) and 5 μM MG132 for 1 day. GAPDH served as input control. (B) Immunoblotting showing anti-ubiquitin immunoprecipitations (IPs) in Flag-CBX2 HEK293FT cells not treated or treated with 5 μM MG132, 1 μM FT671, or 1 μM FT671 + 5 μM MG132 for 1 day. GAPDH served as input control. (C) Immunoblotting showing anti-ubiquitin immunoprecipitations (IPs) in Flag-CBX4 HEK293FT cells not treated or treated with 5 μM MG132, 1 μM FT671, or 1 μM FT671 + 5 μM MG132 for 1 day. GAPDH served as input control. (D) Immunoblotting showing Flag-CBX2 HEK293FT from cells treated with the indicated siRNA (3 days) and 5 μM MG132 or not treated for 1 day. All cells were treated with 1 μM FT671. GAPDH served as input control. (E) Immunoprecipitation (IP) experiments showing the interactions between PRC1 complex subunits BMI1, CBX2, RING1B, and PHC2 in HEK293FT cells with and without treatment with 1 μM FT671 for 1 day (left) in cells treated with 5 μM MG132. Immunoblotting detection of ubiquitylated form of BMI1 proteins in anti-BMI1 immunoprecipitation samples (right). (F) Heatmap representations of ChIP-seq of H2AK119ub1 in siControl (siCtrl) or siUSP7 cells (from two biological replicates). Rank order is from most to least H2AK119ub1 (siCtrl) signal. (G–I) Heatmap representations of ChIP-seq of CBX2 (G), BMI1 (H), and PCGF1 (I) from siControl (siCtrl) or siUSP7 cells (from two biological replicates). Rank order is from most to least CBX2 (siCtrl) signal. Enrichment levels (log2) were normalized with reads per genome coverage. Read counts per gene were averaged in 50-nt bins for (F)–(I). (J) Boxplots of normalized enrichment profile of ChIP-seq (from two biological replicates) from (F) to (I) in H2AK119ub1 occupied regions (n = 6,820, where n represents occupied regions). Enrichment levels (log2) were normalized with reads per genome coverage. p = 1.0 x 10−100 for H2AK119ub1; p = 1.0 x 10−100 for CBX2; p = 1.4 x 10−97 for BMI1; p = 1.0 x 10⁻⁸ for PCGF1. p values are from two-tailed Mann-Whitney test. (K) Immunoblotting showing expression levels of indicated proteins in HEK293FT cells treated with siCtrl or siUSP7 (3 days). GAPDH served as loading control.
Figure 4.
Figure 4.. SENP3 and USP7 are required for ectopic Polycomb target gene silencing
(A) Diagram for the construction of cell lines with 5xtetO-H2B-CITRINE (H2B-CTRN) reporter gene expressing rTetR-RING1B fusion proteins. (B) ChIP-qPCR analysis of RING1B localization with or without 21-day doxycycline treatment in both siCtrl- and siUSP7-treated H2B-CTRN reporter cells. Upon release from doxycycline (−Dox) for 3 days cells were treated with siCtrl or siUSP7. ChIP signals were normalized to GAPDH. Dots represent two biological replicates. Data are presented as mean values +/− SEM. (C) Immunoblots showing USP7 protein expression levels in HEK293FT cells treated with siCtrl or siUSP7 (3 days). GAPDH served as loading control. (D) Diagram for the experimental design with H2B-CTRN reporter cells. Silencing was established by growth in doxycycline-containing medium (+Dox) for 21 days. Cells were then grown in −Dox medium for 3 days. (E) ChIP-qPCR analysis of the indicated proteins and H2AK119ub1 in H2B-CTRN reporter cell lines 3 days after growth in −Dox medium. Upon release from doxycycline, cells were treated with siCtrl or siUSP7. ChIP signals were normalized to GAPDH. Dots represent two biological replicates. Data are presented as mean values +/− SEM. (F) qRT-PCR analysis of RNA levels of H2B-CTRN in the indicated siRNA-treated and SENP3-rescued HEK293FT cells 3 days after growth in −Dox medium. RNA expression levels were normalized to ACTB, and every knockdown was normalized to siCtrl. Data are presented as mean values +/− SEM from three biological replicates. (G) ChIP-qPCR analysis of TEX10 localization 3 days after growth in −Dox medium in indicated siRNA-treated and SENP3-rescued H2B-CTRN reporter HEK293FT. ChIP signals were normalized to GAPDH. Dots represent two biological replicates. Data are presented as mean values +/− SEM. (H) qRT-PCR analysis of RNA levels of H2B-CTRN in the indicated siRNA-treated and USP7-rescued HEK293FT cells 3 days after growth in −Dox medium. siRING1B is presented as a positive control. The effect of knocking down casein-specific kinases is presented on the right. RNA expression levels were normalized to ACTB, and every knockdown was normalized to siCtrl. Data are presented as mean values +/− SEM from three biological replicates. (I) qRT-PCR analysis of RNA levels of H2B-CTRN in the indicated small molecules treatment with indicated concentration 3 days after growth in −Dox medium. RNA expression levels were normalized to ACTB, and every knockdown was normalized to siCtrl. Data are presented as mean values +/− SEM from three biological replicates. (J) Model for the protective roles of SENP3 and USP7 in rixosome- and PRC1-mediated gene silencing.

References

    1. Schuettengruber B, Bourbon HM, Di Croce L, and Cavalli G (2017). Genome regulation by polycomb and trithorax: 70 Years and counting. Cell 171, 34–57. 10.1016/j.cell.2017.08.002. - DOI - PubMed
    1. Kim JJ, and Kingston RE (2022). Context-specific Polycomb mechanisms in development. Nat. Rev. Genet 23, 680–695. 10.1038/s41576-022-00499-0. - DOI - PMC - PubMed
    1. Piunti A, and Shilatifard A (2021). The roles of Polycomb repressive complexes in mammalian development and cancer. Nat. Rev. Mol. Cell Biol 22, 326–345. 10.1038/s41580-021-00341-1. - DOI - PubMed
    1. Holoch D, and Margueron R (2017). Mechanisms regulating PRC2 recruitment and enzymatic activity. Trends Biochem. Sci 42, 531–542. 10.1016/j.tibs.2017.04.003. - DOI - PubMed
    1. Müller J, Hart CM, Francis NJ, Vargas ML, Sengupta A, Wild B, Miller EL, O’Connor MB, Kingston RE, and Simon JA (2002). Histone methyltransferase activity of a Drosophila Polycomb group repressor complex. Cell 111, 197–208. - PubMed

Publication types

MeSH terms

Substances

LinkOut - more resources