. 2023 Apr 4;20(4):e1004208.
doi: 10.1371/journal.pmed.1004208. eCollection 2023 Apr.

The impact of varying the number and selection of conditions on estimated multimorbidity prevalence: A cross-sectional study using a large, primary care population dataset

Affiliations

The impact of varying the number and selection of conditions on estimated multimorbidity prevalence: A cross-sectional study using a large, primary care population dataset

Clare MacRae et al. PLoS Med. .

Abstract

Background: Multimorbidity prevalence rates vary considerably depending on the conditions considered in the morbidity count, but there is no standardised approach to the number or selection of conditions to include.

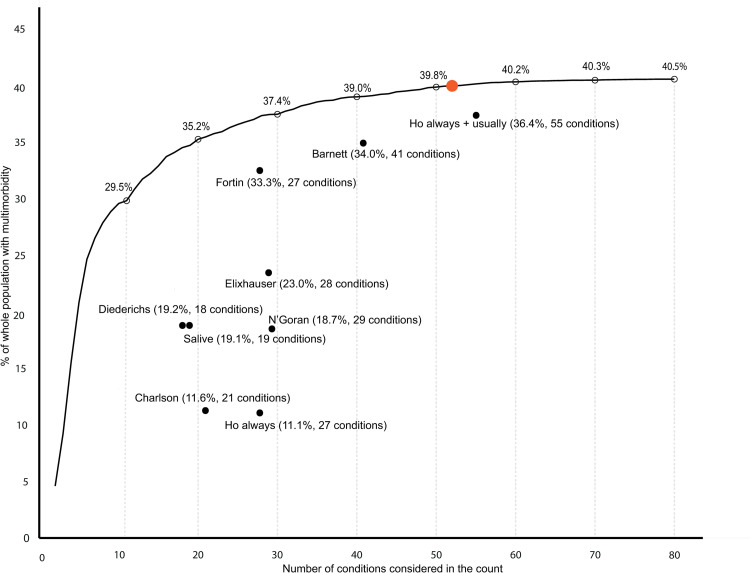
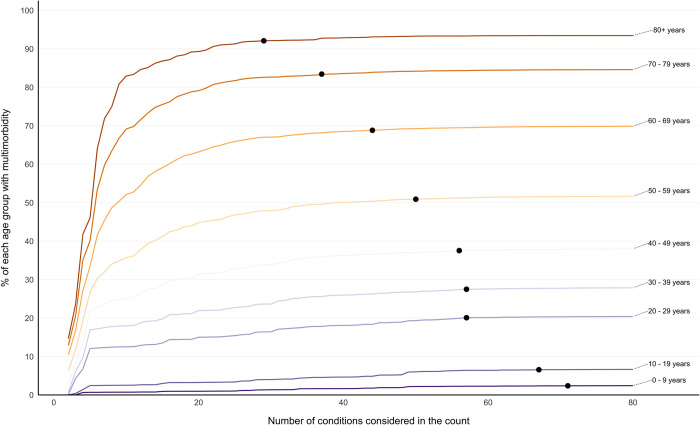
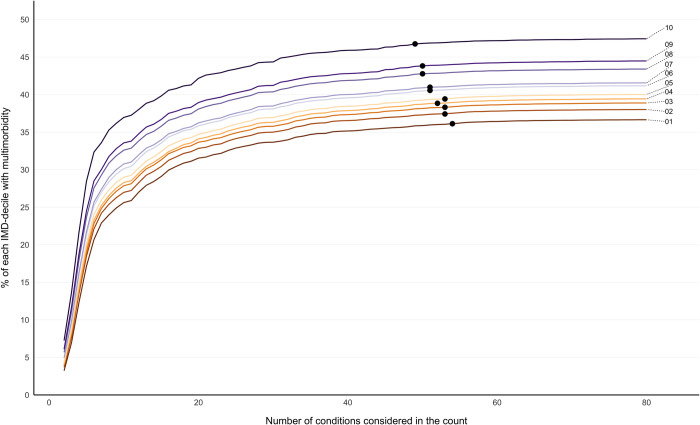
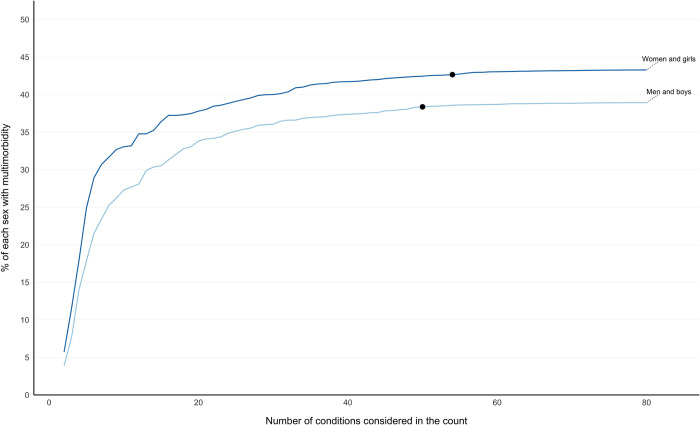
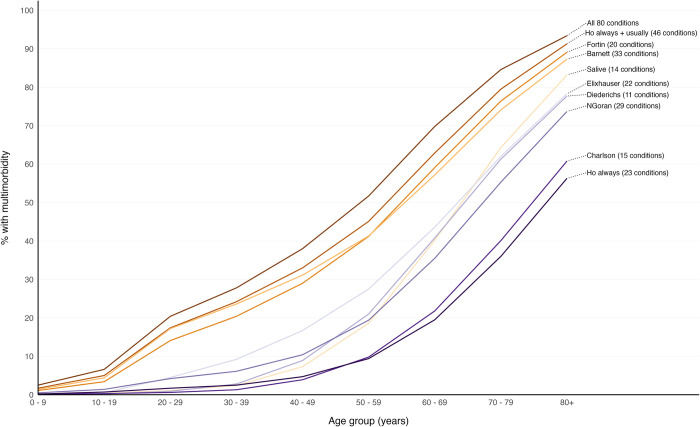
Methods and findings: We conducted a cross-sectional study using English primary care data for 1,168,260 participants who were all people alive and permanently registered with 149 included general practices. Outcome measures of the study were prevalence estimates of multimorbidity (defined as ≥2 conditions) when varying the number and selection of conditions considered for 80 conditions. Included conditions featured in ≥1 of the 9 published lists of conditions examined in the study and/or phenotyping algorithms in the Health Data Research UK (HDR-UK) Phenotype Library. First, multimorbidity prevalence was calculated when considering the individually most common 2 conditions, 3 conditions, etc., up to 80 conditions. Second, prevalence was calculated using 9 condition-lists from published studies. Analyses were stratified by dependent variables age, socioeconomic position, and sex. Prevalence when only the 2 commonest conditions were considered was 4.6% (95% CI [4.6, 4.6] p < 0.001), rising to 29.5% (95% CI [29.5, 29.6] p < 0.001) considering the 10 commonest, 35.2% (95% CI [35.1, 35.3] p < 0.001) considering the 20 commonest, and 40.5% (95% CI [40.4, 40.6] p < 0.001) when considering all 80 conditions. The threshold number of conditions at which multimorbidity prevalence was >99% of that measured when considering all 80 conditions was 52 for the whole population but was lower in older people (29 in >80 years) and higher in younger people (71 in 0- to 9-year-olds). Nine published condition-lists were examined; these were either recommended for measuring multimorbidity, used in previous highly cited studies of multimorbidity prevalence, or widely applied measures of "comorbidity." Multimorbidity prevalence using these lists varied from 11.1% to 36.4%. A limitation of the study is that conditions were not always replicated using the same ascertainment rules as previous studies to improve comparability across condition-lists, but this highlights further variability in prevalence estimates across studies.

Conclusions: In this study, we observed that varying the number and selection of conditions results in very large differences in multimorbidity prevalence, and different numbers of conditions are needed to reach ceiling rates of multimorbidity prevalence in certain groups of people. These findings imply that there is a need for a standardised approach to defining multimorbidity, and to facilitate this, researchers can use existing condition-lists associated with highest multimorbidity prevalence.


Conflict of interest statement

The authors have declared that no competing interests exist.

Figures

Fig 1
Fig 1. Multimorbidity prevalence according to number of conditions, the ceiling effect where adding additional conditions had little impact on prevalence, and selection of conditions using existing condition-lists.
The black line represents multimorbidity prevalence calculated when considering different numbers of conditions in the count ranging from 2 to all 80 conditions, where conditions were added in order of most to least prevalent (e.g., at 2 conditions this is multimorbidity prevalence considering the most common 2 conditions). Percentage prevalence of multimorbidity when 10, 20, 30, 40, 50, 60, 70, and 80 conditions were considered is marked at empty black circles above the black line. The number of conditions at which RR was >0.99 of multimorbidity prevalence of having the same multimorbidity prevalence when all 80 conditions were considered (ceiling effect) was reached is marked with an orange dot (at 52 conditions). Black dots represent multimorbidity prevalence when considering conditions included in existing condition-lists and are annotated with the condition-list name, prevalence, and number of conditions considered. RR, relative risk.
Fig 2
Fig 2. Age-stratified multimorbidity prevalence according to number of conditions considered, reporting the ceiling effect where adding additional conditions had little impact on prevalence.
Labelled coloured lines represent multimorbidity prevalence calculated when considering different numbers of conditions in the count ranging from 2 to all 80 conditions stratified into age groups. Black dots represent the number of conditions at which RR >0.99 of multimorbidity prevalence of having the same multimorbidity prevalence when all 80 conditions were considered (ceiling effect): 0–9 years at 71 conditions, 10–19 years at 67 conditions, 20–29 conditions at 57 conditions, 30–39 years at 57 conditions, 40–49 years at 56 conditions, 50–59 years at 50 conditions, 60–69 years at 44 conditions, 70–79 years at 37 conditions, 80+ years at 29 conditions. RR, relative risk.
Fig 3
Fig 3. SEP-stratified multimorbidity prevalence according to number of conditions considered following direct age standardisation, reporting the ceiling effect where adding additional conditions had little impact on prevalence.
Labelled coloured lines represent multimorbidity prevalence calculated when considering different numbers of conditions in the count ranging from 2 to all 80 conditions stratified into IMD deciles where IMD 1 is least and IMD 10 is most deprived. Black dots represent the number of conditions at which RR >0.99 of multimorbidity prevalence of having the same multimorbidity prevalence when all 80 conditions were considered (ceiling effect): IMD 10 at 49 conditions, IMD 9 at 50 conditions, IMD 8 at 50 conditions, IMD 7 at 51 conditions, IMD 6 at 51 conditions, IMD 5 at 53 conditions, IMD 4 at 52 conditions, IMD 3 at 53 conditions, IMD 2 at 53 conditions, and IMD 1 at 54 conditions. Direct age standardisation where the whole study cohort was the standard population was applied (see S1 Fig for unstandardised rates). IMD, Index of Multiple Deprivation; RR, relative risk; SEP, socioeconomic position.
Fig 4
Fig 4. Sex-stratified multimorbidity prevalence according to number of conditions considered following direct age standardisation, reporting the ceiling effect where adding additional conditions had little impact on prevalence.
Labelled coloured lines represent multimorbidity prevalence calculated when considering different numbers of conditions in the count ranging from 2 to all 80 conditions stratified by sex. Black dots represent the number of conditions at which RR >0.99 of multimorbidity prevalence of having the same multimorbidity prevalence when all 80 conditions were considered (ceiling effect): women and girls at 54 conditions and men and boys at 50 conditions. Direct age standardisation where the whole study cohort was the standard population was applied (see S2 Fig for unstandardised rates). RR, relative risk.
Fig 5
Fig 5. Multimorbidity prevalence by age considering all 80 conditions and according to existing condition-lists.
Labelled coloured lines represent multimorbidity prevalence calculated for each age group when considering conditions in each condition-list.

References

    1. Pefoyo AJK, Bronskill SE, Gruneir A, Calzavara A, Thavorn K, Petrosyan Y, et al.. The increasing burden and complexity of multimorbidity. BMC Public Health. 2015;15(1):415. doi: 10.1186/s12889-015-1733-2 - DOI - PMC - PubMed
    1. Violan C, Foguet-Boreu Q, Flores-Mateo G, Salisbury C, Blom J, Freitag M, et al.. Prevalence, determinants and patterns of multimorbidity in primary care: a systematic review of observational studies. PLoS ONE. 2014;9(7):e102149–e. doi: 10.1371/journal.pone.0102149 - DOI - PMC - PubMed
    1. Multimorbidity: a priority for global health research. The Academy of Medical Sciences. Available from: https://acmedsci.ac.uk/policy/policy-projects/multimorbidity [accessed 2022 Apr 18].
    1. Ho IS-S, Azcoaga-Lorenzo A, Akbari A, Black C, Davies J, Hodgins P, et al.. Examining variation in the measurement of multimorbidity in research: a systematic review of 566 studies. Lancet Public Health. 2021;6(8):e587–e97. doi: 10.1016/S2468-2667(21)00107-9 - DOI - PubMed
    1. Johnston MC, Crilly M, Black C, Prescott GJ, Mercer SW. Defining and measuring multimorbidity: a systematic review of systematic reviews. Eur J Public Health. 2019;29(1):182–189. doi: 10.1093/eurpub/cky098 - DOI - PubMed

Publication types