. 2023 Apr 4;19(4):e1011293.
doi: 10.1371/journal.ppat.1011293. eCollection 2023 Apr.

Syrian hamster convalescence from prototype SARS-CoV-2 confers measurable protection against the attenuated disease caused by the Omicron variant

Affiliations

Syrian hamster convalescence from prototype SARS-CoV-2 confers measurable protection against the attenuated disease caused by the Omicron variant

Kathryn A Ryan et al. PLoS Pathog. .

Abstract

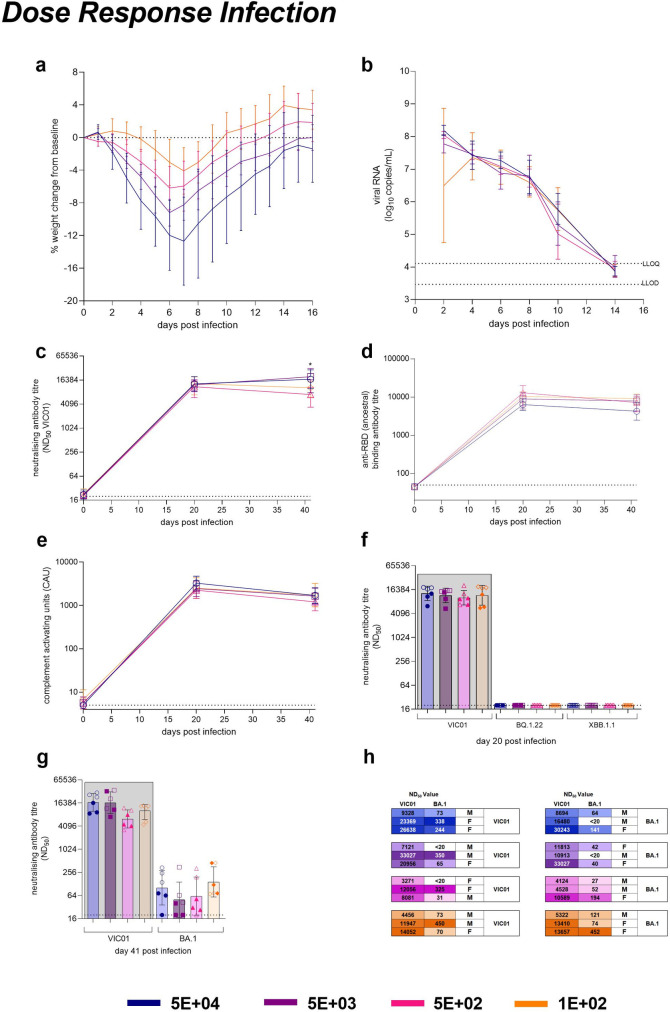
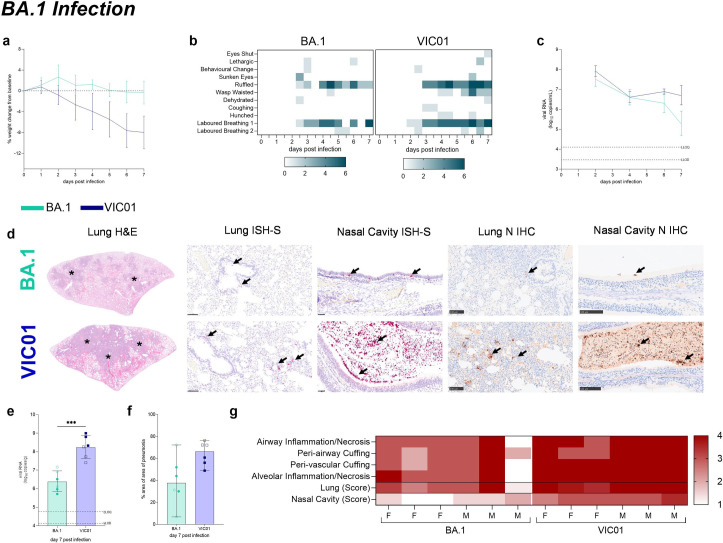
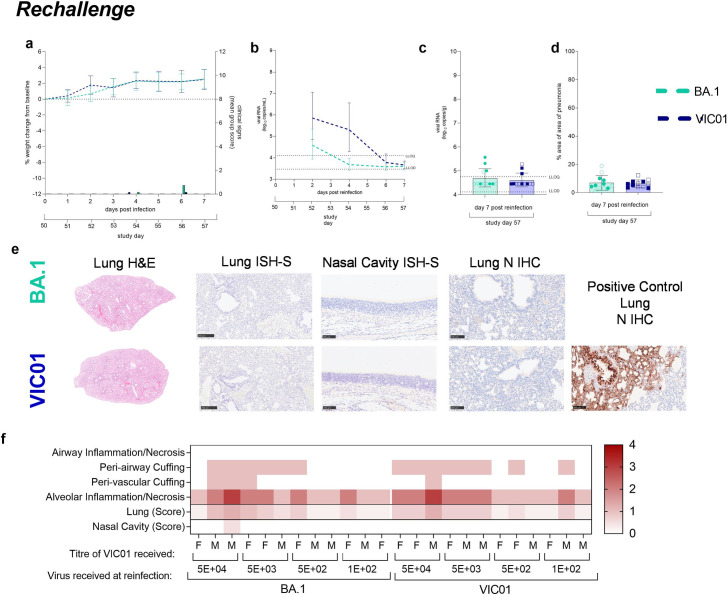
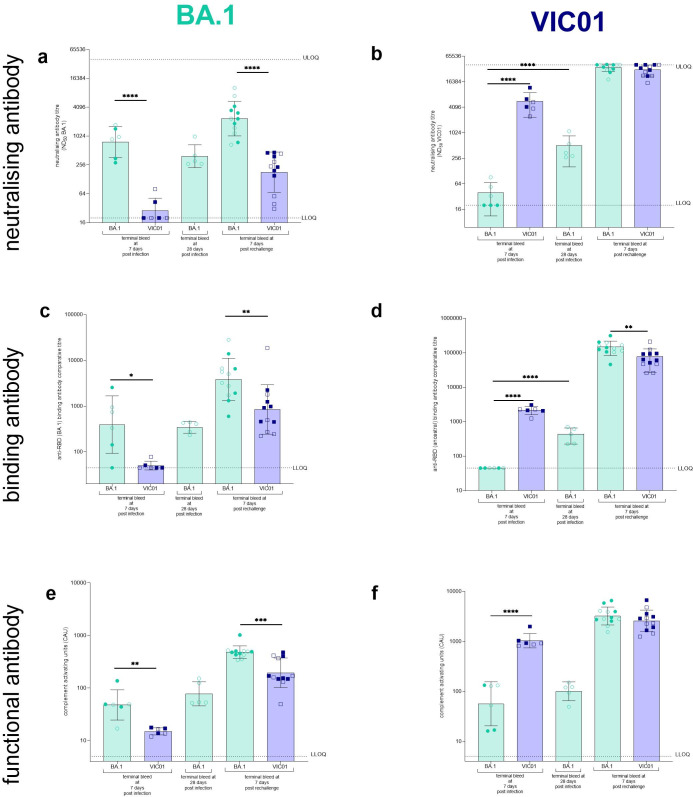
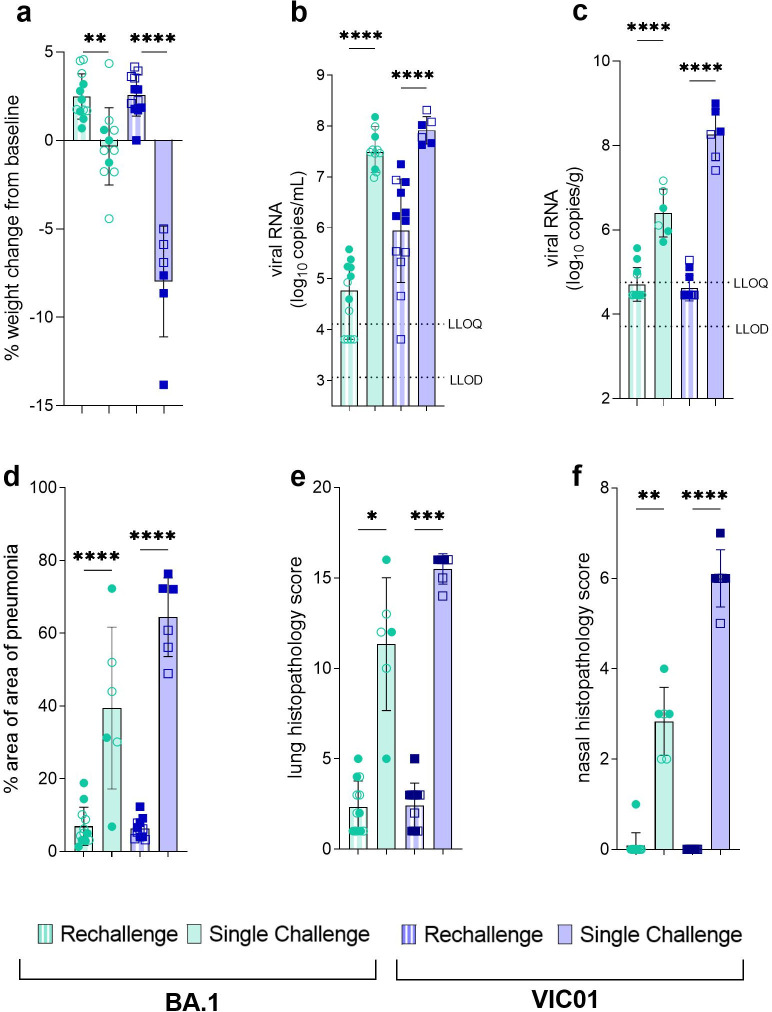
The mutation profile of the SARS-CoV-2 Omicron (lineage BA.1) variant posed a concern for naturally acquired and vaccine-induced immunity. We investigated the ability of prior infection with an early SARS-CoV-2 ancestral isolate (Australia/VIC01/2020, VIC01) to protect against disease caused by BA.1. We established that BA.1 infection in naïve Syrian hamsters resulted in a less severe disease than a comparable dose of the ancestral virus, with fewer clinical signs including less weight loss. We present data to show that these clinical observations were almost absent in convalescent hamsters challenged with the same dose of BA.1 50 days after an initial infection with ancestral virus. These data provide evidence that convalescent immunity against ancestral SARS-CoV-2 is protective against BA.1 in the Syrian hamster model of infection. Comparison with published pre-clinical and clinical data supports consistency of the model and its predictive value for the outcome in humans. Further, the ability to detect protection against the less severe disease caused by BA.1 demonstrates continued value of the Syrian hamster model for evaluation of BA.1-specific countermeasures.


Conflict of interest statement

The authors have declared that no competing interests exist.

Figures

Fig 1
Fig 1. Study Design.
The study was split into three individual sections. Initial Dose Response: Hamsters (n = 6 per group with an equal male/female split) were infected intranasally with VIC01 at four different target doses: 5E+04, 5E+03, 5E+02 and 1E+02 PFU. Blood was collected from infected hamsters at baseline (day 0), 20- and 41-days post infection to assess humoral responses. Rechallenge: At 50 days following the initial VIC01 challenge, a rechallenge with either VIC01 or BA.1 was performed on 3 animals from each VIC01 convalescent group. This equalled a n = 12 in each rechallenge group with an equal male/female split. BA.1 Infection: Two naïve control groups were included in this study with the purpose of being run alongside the rechallenge; n = 6 hamsters were infected with VIC01 (equal male/female split) and n = 11 (3 male/8 female) hamsters were infected with BA.1. All animals were culled 7 days later, except for n = 5 (all female) in the BA.1 control group which were culled at 28 days post infection. The throats of all hamsters were swabbed to monitor viral shedding post-infection and rechallenge. At necropsy animals underwent terminal exanguination bled. Nasal cavity and lungs were collected for pathological examination. In addition, lung was collected to assess viral burden and spleen was collected to assess cellular immune responses.
Fig 2
Fig 2. Initial Dose Response with ancestral VIC01.
Hamsters were monitored for (a) percentage weight change (lines show group means, error bars show standard deviation) relative to baseline (day 0) post-infection. Hamsters challenged with 5E+04 lost significantly more weight by day 2 than hamsters challenged with 5E+02 (P = 0.0146) and 1E+02 (P = 0.0058). Throat swabs were collected at days 2, 4, 6, 8 10 and 14. Statistical analysis were carried out by RM-ANOVA (b) Total viral RNA was quantified in swabs by RT-qPCR at all timepoints. Lines show group mean; error bars show standard deviation. The dashed horizontal lines show the lower limit of quantification (LLOQ) and the lower limit of detection (LLOD). No differences in shedding were observed between doses. Blood samples were collected from the gingiva for sera at baseline, 20- and 41-days post infection for assessment of the humoral response. (c) Neutralising antibody titres against VIC01, (d) SARS-CoV-2 RBD-specific binding antibodies, (e) SARS-CoV-2 spike-specific antibody-dependent complement deposition were assessed. Lines show group geometric means and error bars show geometric standard deviation. Hamsters that received 5E+04 and 5E+03 had significantly higher neutralising antibodies at day 41 compared to hamsters that received and 5E+02 (P = 0.0289, P = 0.0329 respectively). All statistical analysis between groups was carried out on logbase-transformed data using one-way ANOVA with Tukey’s HSD correction. The dashed horizontal lines show the lower limit of quantification (LLOQ) of the assays. (f) Blood samples from Day 20 were assessed for neutralising antibodies against the Omicron subvariants BQ.1.22 and XBB.1.1. Day 20 values in the grey box are presented for comparison, originally from Fig 2C. Bars show geometric group means and error bars show geometric standard deviation. Neutralising antibodies were not detected against either virus with day 20 VIC01 convalescent sera. Solid symbols show males, open symbols show females. (g) Day 41 bleeds were assessed for neutralising antibodies against the BA.1 variant. Day 41 values in the grey box are presented for comparison, originally from Fig 2C. Bars show geometric group means and error bars show geometric standard deviation. Neutralising antibodies were detected against BA.1 with day 41 VIC01 convalescent sera were found to be 166-fold lower that those detected against VIC01. Solid symbols show males, open symbols show females. (h) At 50 days post infection, each dose group was split into two and rechallenged with either VIC01 (n = 12) or BA.1 (n = 12). Numbers neutralising antibodies (ND50) titres at day 41 post challenge against VIC01 and the BA.1 variant. Males and females were split equally between the VIC01 and BA.1 rechallenge groups. Groups are identified according to their ‘target’ dose of virus.
Fig 3
Fig 3
BA.1 Infection Study Hamsters were monitored for (a) weight change. Hamsters infected with VIC01 experienced significantly (P = 0.0327 at day 2) more weight loss from day 2 onwards than hamsters infected with BA.1. Lines show group means, error bars show standard deviation. (b) Heatmaps illustrate the frequency of each clinical sign. The darker the square the more hamsters that were recorded with that clinical sign. Clinical signs observed in BA.1 infected hamsters had a lower frequency than those observed in VIC01 infected hamsters. Throat swabs were collected at days 2, 4, 6 and 7 to assess shedding from the URT. (c) Total viral RNA was quantified by RT-qPCR at all sample timepoints. Lines show group means, error bars show standard deviation. There was a significant difference in the total amount of viral RNA shed at both day 6 (P = 0.0301) and day 7 (P <0.0001) post infection between BA1 and VIC01 infected hamsters. Statistical analysis between groups was carried on logbase-transformed data using RM-ANOVA. The dashed horizontal lines show the lower limit of quantification (LLOQ) and the lower limit of detection (LLOD). Following necropsy Pathological examination (d) showed differences between hamsters challenged with VIC01 compared to those challenged with the BA.1 variant in the lung by H&E staining and in-situ hybridisation in the lung (bar = 250 μm) and nasal cavity (bar = 100 μm). Immunohistochemistry (IHC) staining for N protein was also carried out in both lung (bar = 100 μm) and nasal cavity (bar = 100 μm). (e) viral load was quantified in the lungs of hamsters. Hamsters challenged with VIC01 had significantly higher viral load in their lungs than hamster challenged with BA.1(P = 0.0068). Bars show group means and error bars show standard deviation. The dashed horizontal lines show the lower limit of quantification (LLOQ) of the assays. Statistical analysis between groups was carried out using an unpaired T test. Assessment of the lung revealed significantly (P = 0.0329) more (f) pneumonia in VIC01 infected hamsters than in BA.1 infected hamsters. Statistical analysis between groups was carried out using an unpaired T test. (g) Pathology scores assigned to each hamster are illustrated in a heatmap. Higher pathology scores were observed in hamsters infected with VIC01 in both the lung and nasal cavity.
Fig 4
Fig 4
Rechallenge of hamsters with SARS-CoV-2 Hamsters were monitored for (a) weight change (lines show group means, error bars show standard deviation). and clinical signs (bars). Bars show average assigned clinical score. No differences in weight change were found between hamsters rechallenged with VIC01 or the BA.1 variant. (b) Total viral RNA was quantified by RT-qPCR. Lines show group means and error bars show standard deviation. BA.1 rechallenged hamsters shed significantly less (P = 0.0005) viral RNA from their URT by day 4 compared to VIC01 rechallenge hamsters. Statistical analysis between groups was carried on logbase-transformed data using RM-ANOVA. The dashed horizontal lines show the lower limit of quantification (LLOQ) and the lower limit of detection (LLOD). Following necropsy (c) viral load was quantified in the lungs of hamsters. There was no detectable difference in total viral RNA found in the lungs of hamsters rechallenged with either BA.1 or VIC01. Bars show group means and error bars show standard deviation. The dashed horizontal lines show the lower limit of quantification (LLOQ) and the lower limit of detection (LLOD). Closed symbols show males and open symbols show females. Pathological examination revealed no differences between the (d) percentage area of pneumonia in BA.1 or VIC01 infected hamsters. Bars show group means and error bars show standard deviation. Closed symbols show males and open symbols show females. (e) Examples of lung H&E staining, lung in-situ hybridisation (bar = 250 μm), nasal cavity ISH detection of viral RNA (bar = 100 μm) and IHC staining viral N protein of lung (bar = 100 μm) and nasal cavity (bar = 100 μm) in hamsters rechallenged with either BA.1 or VIC01. (f) Pathological examination showed no differences between the lung histopathology score and nasal histopathology score in hamsters rechallenged with either BA.1 or VIC01.
Fig 5
Fig 5. Assessment of humoral responses to VIC01 and BA.1.
At scheduled cull points hamsters were exsanguinated and assessed for humoral immune responses against both BA.1 and VIC01. Neutralising antibodies were assessed against (a) BA.1 and (b) VIC01. Significantly more (P<0.0001) BA.1 neutralising antibodies were detected in BA.1 rechallenge animals compared to VIC01 rechallenged hamsters. A significantly high ND50 titre was seen in the homologous groups for VIC01 (P<0.0001) and BA.1 (P<0.0001) when compared against the heterologous singularly infected group. A significant increase (P<0.0001) was seen between VIC01 neutralising antibodies at day 7 and day 28 post BA.1 infection. No difference was detected for BA.1 neutralising antibodies. Binding antibodies were assessed for (c) BA.1 and (d) ancestral RBD-specific binding antibodies. A significantly higher binding antibody titre was seen in the homologous groups for BA.1 (P = 0.0114) and VIC01 (P<0.0001) at day 7. The BA.1 rechallenge hamsters had significantly higher RBD-specific binding antibodies against both BA.1 (P = 0.0096) and VIC01 (P = 0.0043). A significant increase (P<0.0001) was seen between VIC01 RBD-specific binding antibodies at day 7 and day 28 post BA.1 infection. Antibody dependent complement deposition against the (e) the BA.1 and (f) ancestral spike. Significantly higher complement activating units (CAU) were seen in homologous groups for BA.1 (P = 0.0023) and VIC01 (P<0.0001) and BA.1 rechallenged animals also showed significantly higher (P = 0.0007) CAU against BA.1 Spike. Bars show group geometric means and error bars show standard deviation. The dashed horizontal lines show the upper limit of quantification (ULOQ) and the lower limit of quantification(QLOD). All statistical analysis between groups was carried out on logbase-transformed data using one-way ANOVA with Tukey’s correction.
Fig 6
Fig 6
BA.1 offers sufficient discriminatory power for evaluation of BA.1-specific countermeasures (a) At 7 days post infection there was a significant difference in percent weight change between BA.1 single infection and rechallenge hamsters (P = 0.0021) and VIC01 single infection and rechallenge hamsters (P<0.0001). Statistical analysis between groups was carried out using one-way ANOVA. (b) Total viral RNA in throat swabs at 2 days post infection was quantified by RT-qPCR. Bars show group mean and error bars show standard deviation. The dashed horizontal lines show the lower limit of quantification (LLOQ) and the lower limit of detection (LLOD). A significant difference was seen between BA.1 single infection and rechallenge (P<0.0001) and between VIC01 single infection and rechallenge (P = <0.0001) groups. Statistical analysis between groups was carried out using one-way ANOVA. (c) Total viral RNA in the lung at 7 days post infection was quantified by RT-qPCR. Bars show group mean and error bars show standard deviation. The dashed horizontal lines show the lower limit of quantification (LLOQ) and the lower limit of detection (LLOD). Significantly less virus was found in the lungs of BA.1 and VIC01 rechallenge animals (both<0.0001) compared to single infection. Statistical analysis between groups was carried out using one-way ANOVA. (d) Percentage area of pneumonia was significantly less in both rechallenge groups compared to single infection groups (both P<0.0001). Statistical analysis between groups was carried out using one-way ANOVA. (e) Lung and (f) nasal cavity scores were significantly reduced in BA.1 (P = 0.0144, P = 0.0081) and VIC01 (P = 0.0007, P<0.001) rechallenge hamsters compared to those that received single infection. Statistical analysis between groups was carried out using Kruskal-Wallis.

References

    1. Cele S, Jackson L, Khan K, Khoury D, Moyo-Gwete T, Tegally H, et al. SARS-CoV-2 Omicron has extensive but incomplete escape of Pfizer BNT162b2 elicited neutralization and requires ACE2 for infection. medRxiv. 2021:2021.12.08.21267417. doi: 10.1101/2021.12.08.21267417 - DOI - PMC - PubMed
    1. Ryan KA, Bewley KR, Fotheringham SA, Slack GS, Brown P, Hall Y, et al. Dose-dependent response to infection with SARS-CoV-2 in the ferret model and evidence of protective immunity. Nat Commun. 2021;12(1):81. Epub 2021/01/06. doi: 10.1038/s41467-020-20439-y ; PubMed Central PMCID: PMC7782478. - DOI - PMC - PubMed
    1. Everett HE, Lean FZX, Byrne AMP, van Diemen PM, Rhodes S, James J, et al. Intranasal Infection of Ferrets with SARS-CoV-2 as a Model for Asymptomatic Human Infection. Viruses. 2021;13(1). Epub 2021/01/21. doi: 10.3390/v13010113 ; PubMed Central PMCID: PMC7830262. - DOI - PMC - PubMed
    1. Kim Y-I, Kim S-G, Kim S-M, Kim E-H, Park S-J, Yu K-M, et al. Infection and Rapid Transmission of SARS-CoV-2 in Ferrets. Cell Host & Microbe. 2020. doi: 10.1016/j.chom.2020.03.023 - DOI - PMC - PubMed
    1. Bewley KR, Gooch K, Thomas KM, Longet S, Wiblin N, Hunter L, et al. Immunological and pathological outcomes of SARS-CoV-2 challenge after formalin-inactivated vaccine immunisation of ferrets and rhesus macaques. 2020:2020.12.21.423746. doi: 10.1101/2020.12.21.423746%J bioRxiv. - DOI - PMC - PubMed

Publication types

Supplementary concepts