

Beta Oscillations in Monkey Striatum Encode Reward Prediction Error Signals
- PMID: 37015808
- PMCID: PMC10162459
- DOI: 10.1523/JNEUROSCI.0952-22.2023
Beta Oscillations in Monkey Striatum Encode Reward Prediction Error Signals
Abstract
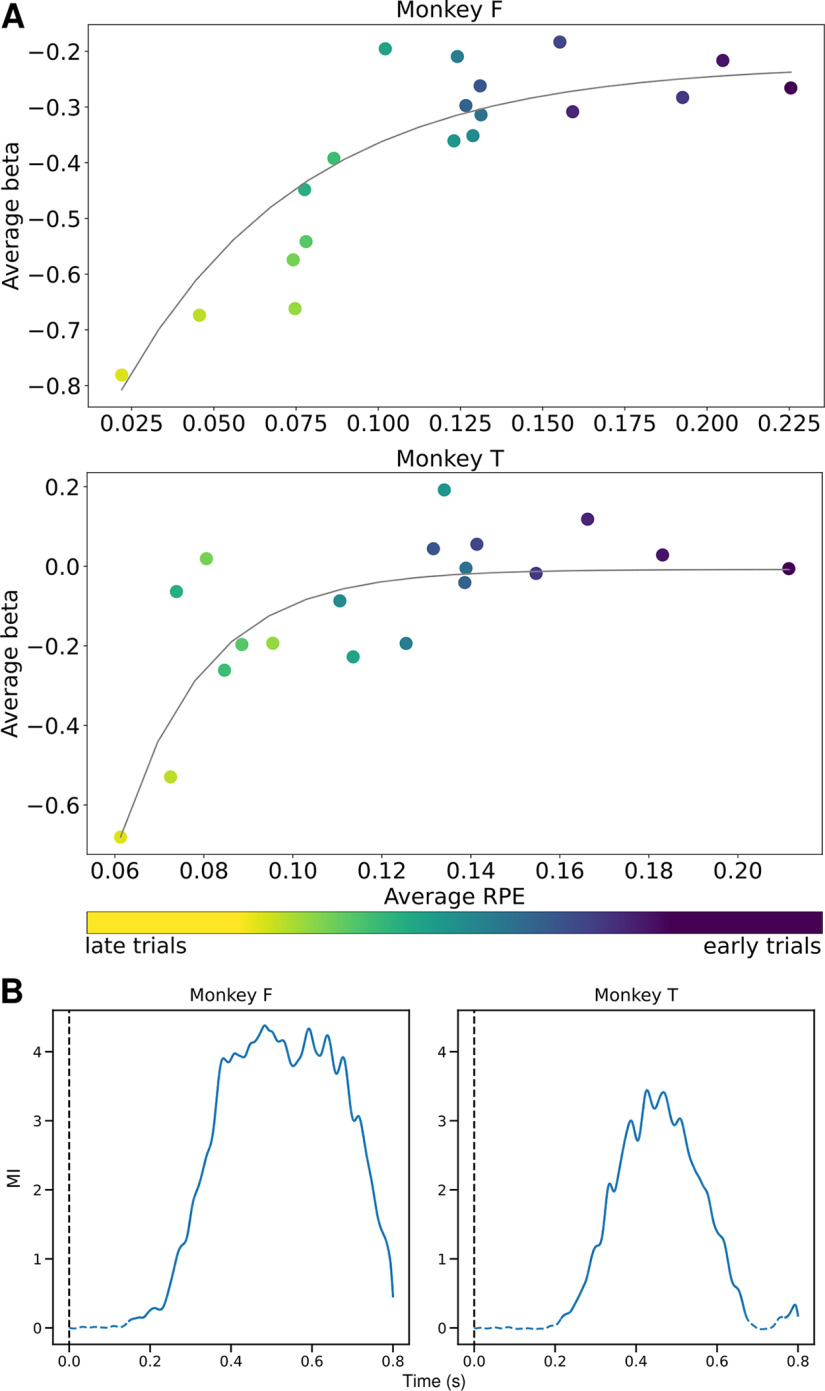
Reward prediction error (RPE) signals are crucial for reinforcement learning and decision-making as they quantify the mismatch between predicted and obtained rewards. RPE signals are encoded in the neural activity of multiple brain areas, such as midbrain dopaminergic neurons, prefrontal cortex, and striatum. However, it remains unclear how these signals are expressed through anatomically and functionally distinct subregions of the striatum. In the current study, we examined to which extent RPE signals are represented across different striatal regions. To do so, we recorded local field potentials (LFPs) in sensorimotor, associative, and limbic striatal territories of two male rhesus monkeys performing a free-choice probabilistic learning task. The trial-by-trial evolution of RPE during task performance was estimated using a reinforcement learning model fitted on monkeys' choice behavior. Overall, we found that changes in beta band oscillations (15-35 Hz), after the outcome of the animal's choice, are consistent with RPE encoding. Moreover, we provide evidence that the signals related to RPE are more strongly represented in the ventral (limbic) than dorsal (sensorimotor and associative) part of the striatum. To conclude, our results suggest a relationship between striatal beta oscillations and the evaluation of outcomes based on RPE signals and highlight a major contribution of the ventral striatum to the updating of learning processes.SIGNIFICANCE STATEMENT Reward prediction error (RPE) signals are crucial for reinforcement learning and decision-making as they quantify the mismatch between predicted and obtained rewards. Current models suggest that RPE signals are encoded in the neural activity of multiple brain areas, including the midbrain dopaminergic neurons, prefrontal cortex and striatum. However, it remains elusive whether RPEs recruit anatomically and functionally distinct subregions of the striatum. Our study provides evidence that RPE-related modulations in local field potential (LFP) power are dominant in the striatum. In particular, they are stronger in the rostro-ventral rather than the caudo-dorsal striatum. Our findings contribute to a better understanding of the role of striatal territories in reward-based learning and may be relevant for neuropsychiatric and neurologic diseases that affect striatal circuits.
Keywords: LFP; learning; mutual information; rewards; striatum.
Copyright © 2023 the authors.
Figures


References
Publication types
MeSH terms
LinkOut - more resources
Full Text Sources