. 2023 Apr 5;14(4):239.
doi: 10.1038/s41419-023-05759-3.

FHL2 deficiency impairs follicular development and fertility by attenuating EGF/EGFR/YAP signaling in ovarian granulosa cells

Affiliations

FHL2 deficiency impairs follicular development and fertility by attenuating EGF/EGFR/YAP signaling in ovarian granulosa cells

Chen Wang et al. Cell Death Dis. .

Abstract

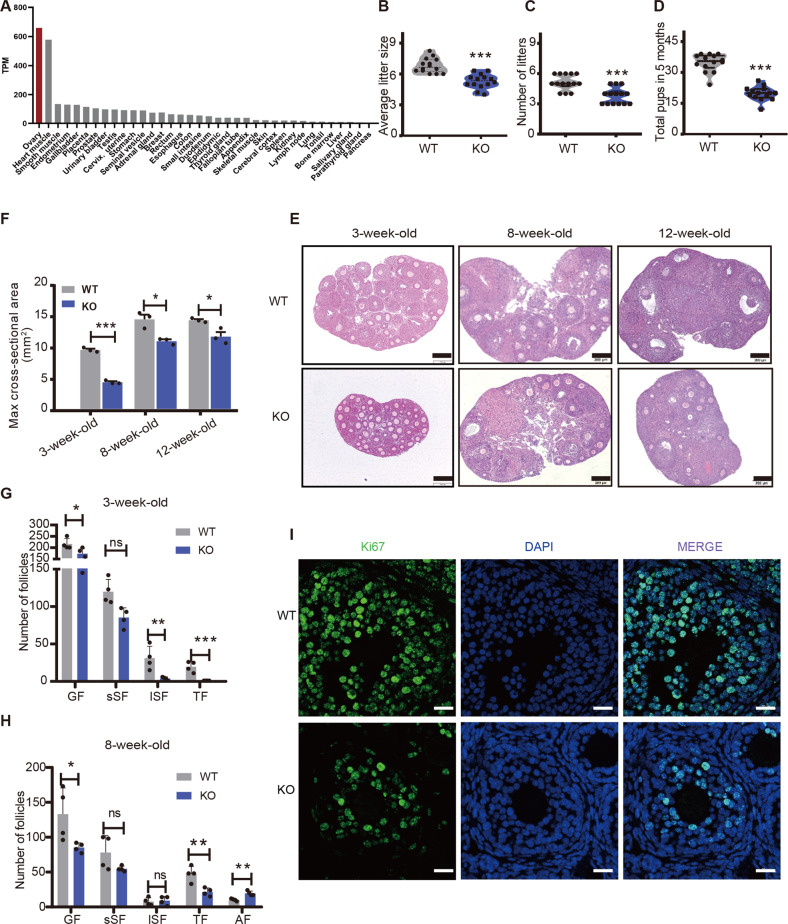
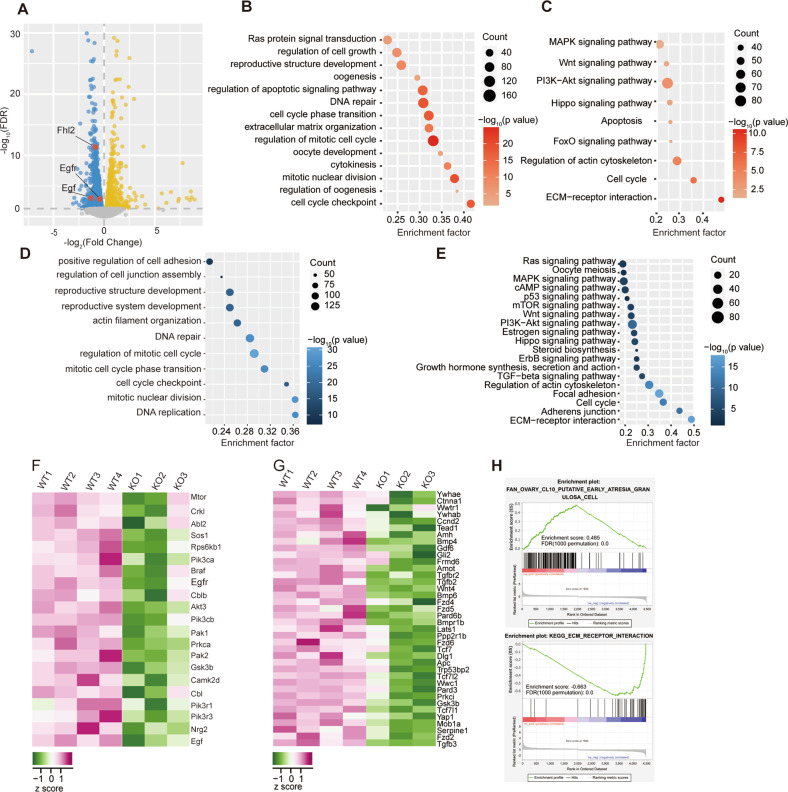
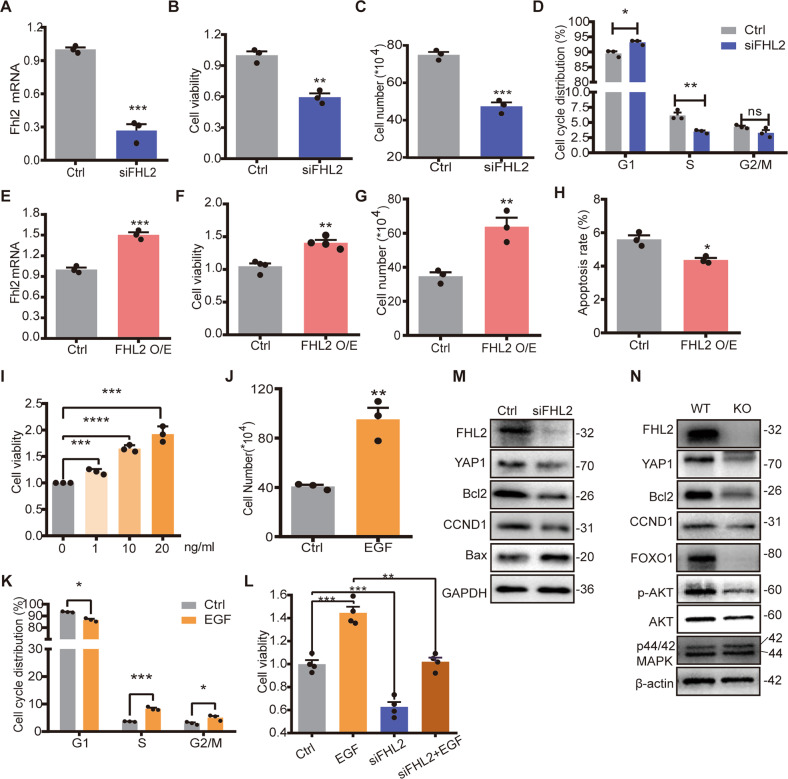
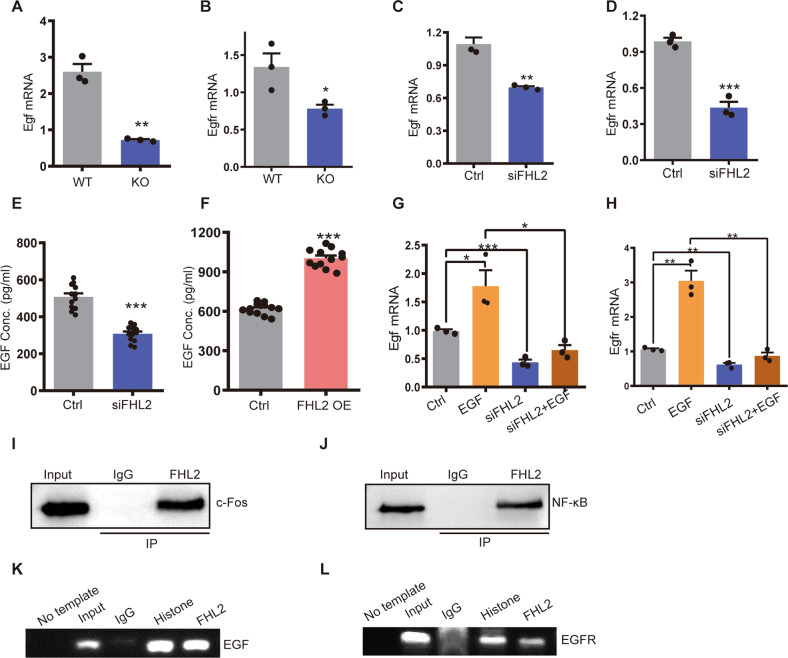
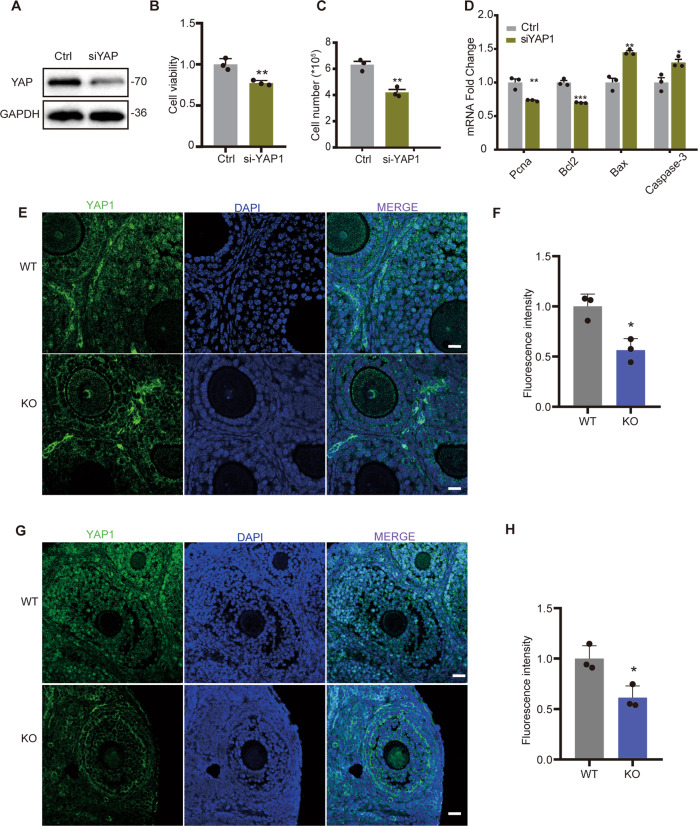
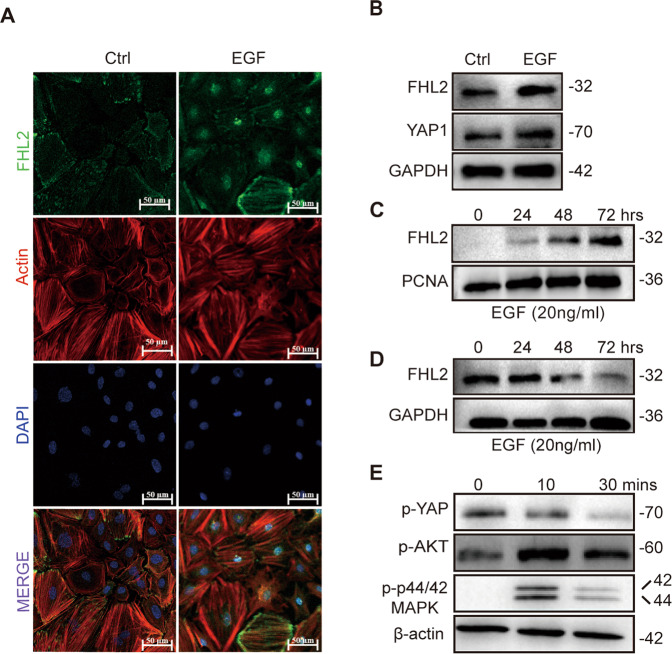
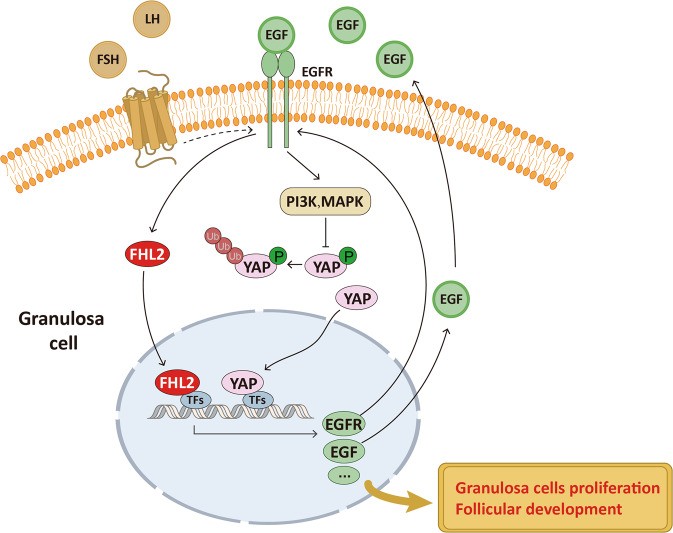
Female subfertility is an increasing reproductive issue worldwide, which is partially related to abnormal ovarian follicular development. Granulosa cells (GCs), by providing the necessary physical support and microenvironment for follicular development, play critical roles in maintaining female fertility. We previously showed that ectopic expression of four and a half LIM domains 2 (FHL2) promoted ovarian granulosa cell tumor progression. However, its function in follicular development and fertility remains unknown. Here, we confirmed that FHL2 is highly expressed in human and mouse ovaries. FHL2 immunosignals were predominantly expressed in ovarian GCs. A Fhl2 knockout (KO) mouse model was generated to examine its roles in follicular development and fertility. Compared with wildtype, knockout of Fhl2 significantly decreased female litter size and offspring number. Furthermore, Fhl2 deficiency reduced ovarian size and impaired follicular development. RNA-sequencing analysis of GCs isolated from either KO or WT mice revealed that, Fhl2 deletion impaired multiple biological functions and signaling pathways, such as Ovarian Putative Early Atresia Granulosa Cell, ErbB, Hippo/YAP, etc. In vitro studies confirmed that FHL2 silencing suppressed GCs growth and EGF-induced GCs proliferation, while its overexpression promoted GC proliferation and decreased apoptosis. Mechanistic studies indicated that FHL2, via forming complexes with transcriptional factors AP-1 or NF-κB, regulated Egf and Egfr expression, respectively. Besides, FHL2 depletion decreased YAP1 expression, especially the active form of YAP1 (nuclear YAP1) in GCs of growing follicles. EGF, serving as an autocrine/paracrine factor, not only induced FHL2 expression and nuclear accumulation, but also stimulated YAP1 expression and activation. Collectively, our study suggests that FHL2 interacts with EGFR and Hippo/YAP signaling to regulate follicular development and maintain fertility. This study illuminates a novel mechanism for follicular development and a potential therapeutic target to address subfertility.


Conflict of interest statement

The authors declare no competing interests.

Figures

Fig. 1
Fig. 1. The expression and localization of FHL2 in the ovarian follicles.
A The protein expression profiles of FHL2 in human tissues. Data credit: Human Protein Atlas. Data summary image is derived from the human protein atlas database (ps://v18.proteinatlas.org/ENSG00000115641-FHL2/tissue). BD The Average litter size (B), the number of litters/female (C), and total pups (D) in wildtype (WT) and Fhl2 knockout (KO) mice during 5-months breeding trial. N = 14 for each group. E Hematoxylin and eosin (HE) staining of ovaries isolated from 3-week-old, 8-week-old, and 12-week-old of WT and Fhl2 KO mice. Scale bars: 200 μm. F Max cross-sectional area of ovaries from 3-week-old, 8-week-old, and 12-week-old of WT and Fhl2 KO mice. N = 3 for each group. G, H Number of follicles per ovary isolated from 3-week-old WT or KO mice (G), and 8-week-old WT or KO mice (H). N = 4 for each group. GF total growing follicle, sSF small secondary follicle (wrapped up by 2–5 layers of granule cells), lSF large secondary follicles (wrapped up by more than 5 layers of granule cells), TF tertiary Follicles, AF atretic follicle. I Representative image of immunofluorescence staining of Ki67 in WT and Fhl2 KO mice ovaries. Green color indicated Ki67 immunosignal. Nuclei were staining with DAPI in blue. Scale bar: 20 µm. Student’s t test was used to compare the difference between groups. Data are shown as mean ± SEM. *P < 0.05, **P < 0.01, ***P < 0.001. ns non-significant.
Fig. 2
Fig. 2. Bioinformatics analysis of differentially expressed genes in ovarian GCs of 3-week-old WT and Fhl2 KO mice.
A Volcano plot showing differentially expressed genes (DEGs) (FDR ≤ 0.05) between WT and Fhl2 KO mice. Yellow and blue dots represent the up-regulated or down-regulated genes in KO mice, respectively. Fhl2, Egfr and Egf were indicated by red dots. B, C Representative GO and KEGG enrichment results (P ≤ 0.05) of all DEGs between ovarian GCs of WT and KO mice, respectively. D, E Representative GO and KEGG enrichment results (P ≤ 0.05) of down-regulated DEGs in Fhl2 KO mice ovarian GCs. F Expression heatmap of DEGs in Erbb signaling pathway. G Expression heatmap of DEGs in Hippo signaling pathway. H Representative Gene Set Enrichment Analysis (GSEA) results (FDR ≤ 0.05) of all DEGs between WT and KO mice ovarian GCs. The FDR is obtained from the P-value based on 1000 times permutation test.
Fig. 3
Fig. 3. FHL2 deficiency inhibited GC viability and EGF-induced GC proliferation in vitro.
A Fhl2 mRNA levels in GCs transfected with scramble siRNA (Ctrl) or Fhl2 specific siRNA (siFHL2). N = 3 for each group. β-actin was used as a loading control. B Knockdown of FHL2 inhibited cell viability significantly. Cell viability was detected by CCK-8. N = 3 for each group. C Quantitative data showing cell number changes in control and FHL2 knockdown cells. N = 3 for each group. D Flow cytometry showing cell cycle distribution in GCs transfected with scramble siRNA (Ctrl) or Fhl2 specific siRNA (siFHL2). Data was displayed as a percentage of cells in each phase of the cell cycle. N = 3 for each group. E Fhl2 mRNA levels in GCs transfected with control vector (Ctrl) or Fhl2 overexpression vector (Fhl2 O/E). N = 3 for each group. β-actin was used as loading control. F Overexpression of FHL2 promoted GC viability. N = 4 for each group. G Cell growth changes in control and FHL2 overexpression cells. N = 3 for each group. H Overexpression of FHL2 dramatically deceased cell apoptosis. Cells were stained with an Annexin V-APC/PI dual staining kit and apoptosis was analyzed by flow cytometry. N = 3 for each group. I EGF treatment improved cell viability in a dose-dependent manner. GCs were incubated in medium containing DMEM/F12 (1:1) and 1% fetal bovine serum (FBS) in the absence (vehicle control, Ctrl) or presence of 1, 10, or 20 ng/ml EGF for 48 h. CCK-8 was employed to measure GC viability. N = 3 for each group. J EGF treatment stimulated GC proliferation. GCs were incubated in the absence (vehicle control, Ctrl) or presence of EGF (20 ng/ml) in medium containing DMEM/F12 (1:1) and 1% FBS for 48 h. N = 3 for each group. K Cell cycle distribution in GCs treated with absence or presence of EGF. N = 3 for each group. Cell cycle analysis was performed by flow cytometry. L Knockdown of FHL2 attenuated EGF induced cell proliferation. GCs were transfected with scramble siRNA (Ctrl) or Fhl2 specific siRNA (siFHL2) for 24 h, followed by EGF treatment (20 ng/ml) for 48 h. Cell viability was measured by CCK-8. N = 4 for each group. M Knockdown of FHL2 in vitro decreased protein levels related with cell growth. GCs were transfected with either scramble siRNA (Ctrl) or Fhl2 specific siRNA (siFHL2) for 72 h. Protein levels were determined by western blot. GAPDH was used as a loading control. All the experiments were repeated at less 3 times and representative images were presented. N Representative western blot images showing the protein expressions in wildtype (WT) and Fhl2 KO mice ovaries. Whole ovary extracts were prepared for western blot. β-actin was used as the loading control. All the experiments were repeated at less 3 times. Student’s t test or one-way ANOVA were used to compare the difference between groups. Data are shown as mean ± SEM. *P < 0.05, **P < 0.01, ***P < 0.001, ****P < 0.0001, ns non-significant.
Fig. 4
Fig. 4. FHL2 regulated Egf and Egfr transcription by binding with transcriptional factor AP-1 and NF-κB.
A, B QRT-PCR showing the Egf and Egfr mRNA levels of the GCs collected from 3-week-old WT and Fhl2 KO mice. β-actin was used as loading control. N = 3 for each group. C, D QRT-PCR showing the Egf and Egfr mRNA levels of the GCs transfected with scramble siRNA (Ctrl) or Fhl2 specific siRNA (siFHL2). β-actin was used as loading control. N = 3 for each group. E Knockdown of FHL2 reduced EGF concentration in the culture medium. GCs were transfected with scramble siRNA (Ctrl) or Fhl2 specific siRNA (siFHL2) for 72 h. Culture medium were collected from each group and EGF concentration was measured by ELISA. N = 12 for each group. F Overexpress of FHL2 increased EGF concentration in the culture medium. GCs were transfected with control vector (Ctrl) or Fhl2 overexpression vector (Fhl2 OE) for 72 h. Culture medium were collected from each group and EGF concentration was measured by ELISA. N = 12 for each group. G, H Knockdown of FHL2 inhibited EGF induced gene expressions. GCs were transfected with either scramble siRNA (Ctrl) or Fhl2 specific siRNA (siFHL2) for 24 h, followed by EGF treatment (20 ng/ml) for 48 h. QRT-PCR were performed to detect Egf and Egfr mRNA expression levels of each group. β-actin was used as a loading control. N = 3 for each group. I, J Co-immunoprecipitation assay showing the interaction of FHL2 with c-fos and NF-κB. K, L Chromatin immunoprecipitation (ChIP) assay showing that Egf and Egfr was the direct target of FHL2. Acetyl Histone H3 was used as a positive control, while samples from IgG group (antibody replaced with same amount of IgG) was used as a negative control. Student’s t test or one-way ANOVA were used to compare the difference between groups. Data are shown as mean ± SEM. *P < 0.05, **P < 0.01, ***P < 0.001.
Fig. 5
Fig. 5. YAP1 depletion inhibited GC growth and FHL2 deficiency induced YAP signal translocation.
A Representative western blot image showing YAP1 protein level. GCs were transfected with scramble siRNA (Ctrl) or Yap1 specific siRNA (siYAP) for 72 h. YAP1 expression was detected by western blot. GAPDH was used as a loading control. Quantitative data showing YAP1 knockdown inhibited cell viability (B), and reduced cell number (C), N = 3 for each group. D Knockdown of YAP1 decreased gene expression related with cell proliferation. GCs were transfected with scramble siRNA (Ctrl) or Yap1 specific siRNA (siYAP) and QRT-PCR were used to detect relative gene expressions. N = 3 for each group. E Immunofluorescence staining showing the expression and localization of YAP1 immunosignal in GCs of 3-week-old WT and Fhl2 KO mice. Ovaries were isolated from 3-week-old WT and Fhl2 KO mice and then fixed to perform immunofluorescence staining. Green color represents YAP1 immunosignal. Nuclei were stained with DAPI (blue). Scale bar: 20 µm. F Quantification of YAP1 immunosignal intensity in 3-week-old WT and Fhl2 KO mice. Image J was used to quantify immunosignal intensity. N = 3 for each group. G Immunofluorescence staining showing the expression and localization of YAP1 immunosignal in 8-week-old WT and Fhl2 KO mice GCs.Scale bar: 20 µm. H Quantification of YAP1 immunosignals in 8-week-old WT and Fhl2 KO mice. N = 3 for each group. Student’s t test were used to compare the difference between groups. Data are shown as mean ± SEM. *P < 0.05, **P < 0.01, ***P < 0.001.
Fig. 6
Fig. 6. EGF Treatment Induced FHL2 and YAP1 Expression and Translocation.
A Immunofluorescence staining showing FHL2 expression and subcellular location in vitro. Primary GCs were isolated and cultured with absence (vehicle control, Ctrl) or presence of 20 ng/ml EGF (EGF) for 48 h. Immunofluorescence staining was used to identify the subcellular location of FHL2. The FHL2 immunosignal was presented in green and F-actin (phalloidin) was presented in red color. Nuclei were stained with DAPI (blue). Scale bar: 50 μm. B FHL2 and YAP1 protein expression in GCs treated in absence (vehicle control, Ctrl) or presence of EGF (20 ng/ml). GAPDH was used as a loading control. C, D Western blot images showing FHL2 expressions in the nucleus (C) or cytoplasm (D) of GCs. GCs were incubated with absence (vehicle control, Ctrl) or presence of EGF (20 ng/ml) for 24 h, 48 h or 72 h in vitro. Nuclear and cytoplasmic protein were isolated to analyze FHL2 expression by western blot. PCNA was used as a nuclear protein loading control. GAPDH was used as a cytosol protein loading control. E EGF treatment stimulated the active form of YAP1. GCs were incubated with 20 ng/ml EGF for 0, 10 or 30 min. Phosphorylated protein levels were determined using western blot. β-actin was used as a loading control.
Fig. 7
Fig. 7
A schematic diagram showing the proposed mechanism for FHL2 to regulate GC proliferation and follicular development.

References

    1. Farquhar CM, Bhattacharya S, Repping S, Mastenbroek S, Kamath MS, Marjoribanks J, et al. Female subfertility. Nat Rev Dis Primers. 2019;5:1–21. - PubMed
    1. Dumesic DA, Meldrum DR, Katz-Jaffe MG, Krisher RL, Schoolcraft WB. Oocyte environment: follicular fluid and cumulus cells are critical for oocyte health. Fertil Steril. 2015;103:303–16. - PubMed
    1. Fan H-Y, Liu Z, Shimada M, Sterneck E, Johnson PF, Hedrick SM, et al. MAPK3/1 (ERK1/2) in ovarian granulosa cells are essential for female fertility. Science. 2009;324:938–41. - PMC - PubMed
    1. Pellatt L, Hanna L, Brincat M, Galea R, Brain H, Whitehead S, et al. Granulosa cell production of anti-Mullerian hormone is increased in polycystic ovaries. J Clin Endocrinol Metab. 2007;92:240–5. - PubMed
    1. Lo BK, Sheikh S, Williams SA. In vitro and in vivo mouse follicle development in ovaries and reaggregated ovaries. Reproduction. 2019;157:135–48. - PMC - PubMed

Publication types