. 2023 Apr 4;14(1):1867.
doi: 10.1038/s41467-023-36967-2.

An epigenetic switch controls an alternative NR2F2 isoform that unleashes a metastatic program in melanoma

Affiliations

An epigenetic switch controls an alternative NR2F2 isoform that unleashes a metastatic program in melanoma

Veronica Davalos et al. Nat Commun. .

Abstract

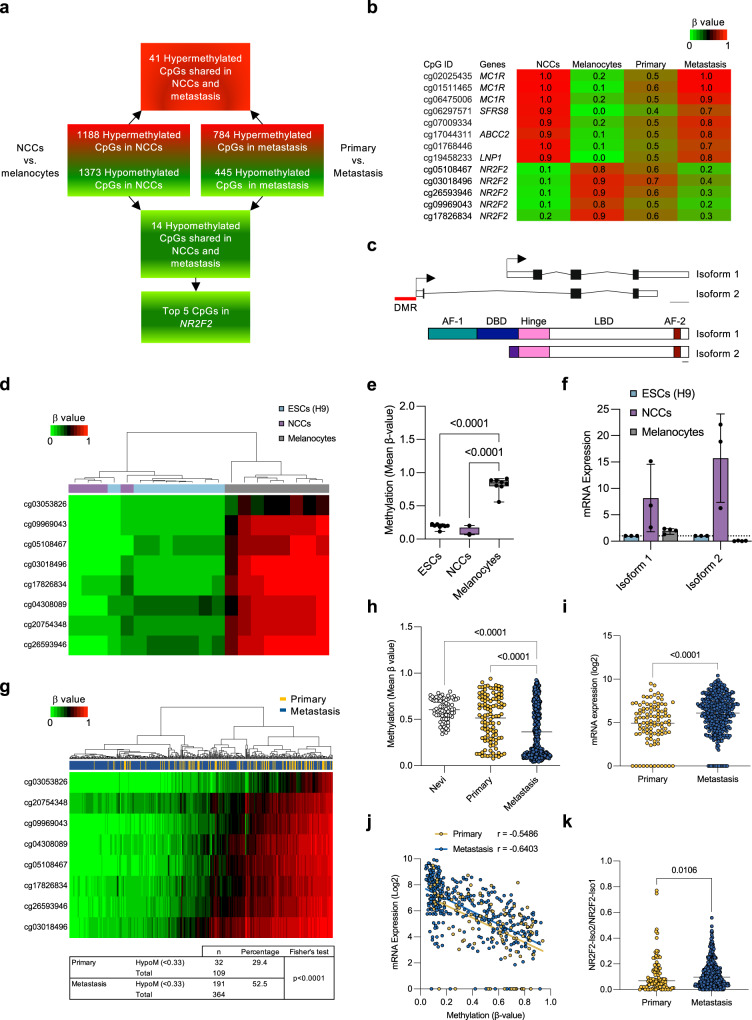
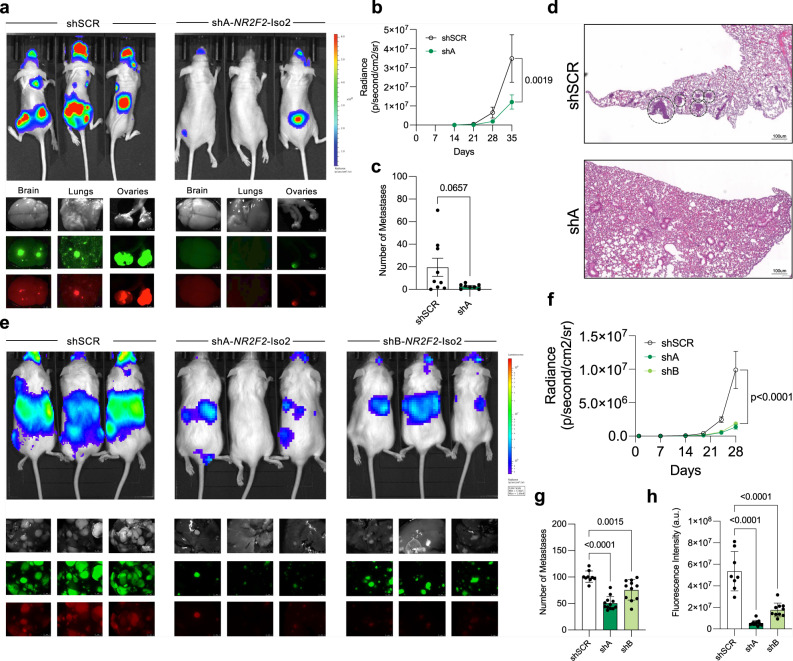
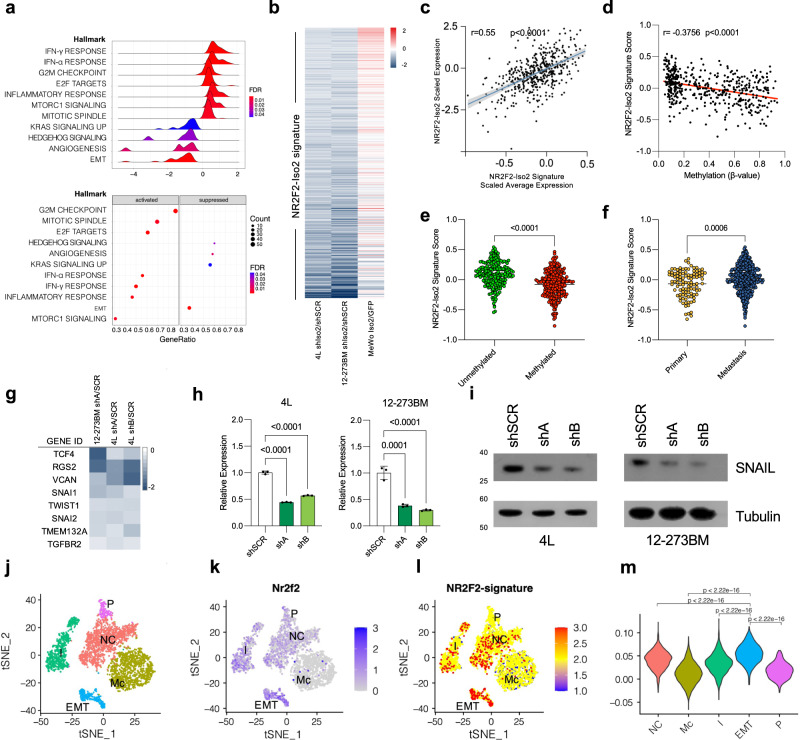
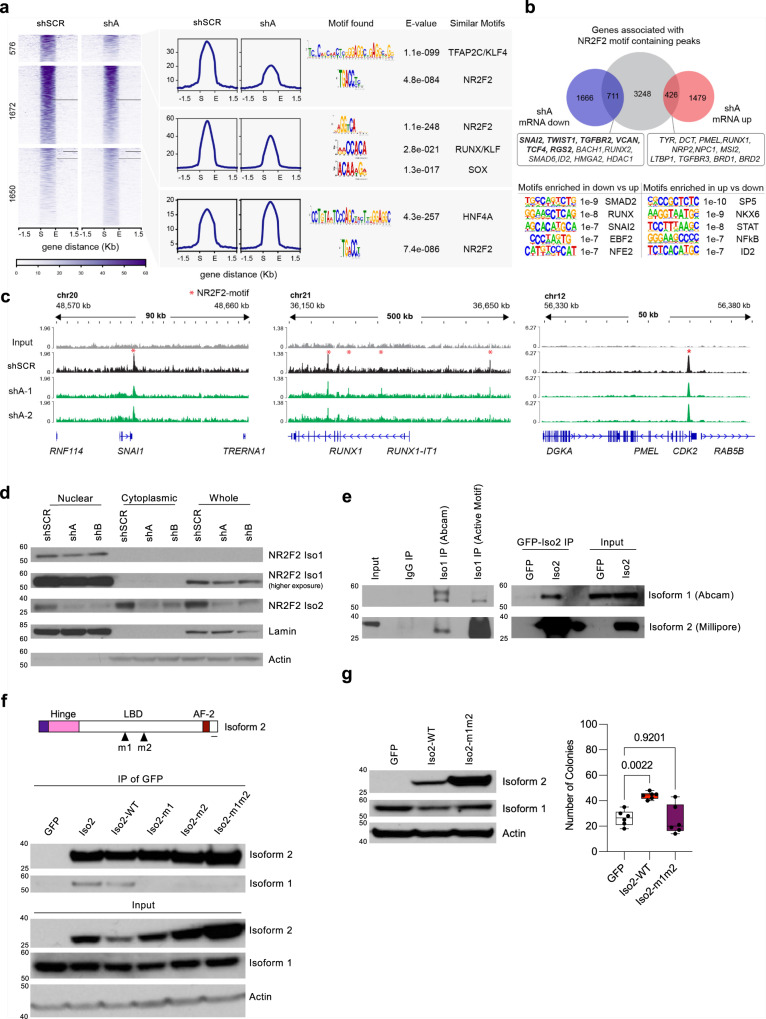
Metastatic melanoma develops once transformed melanocytic cells begin to de-differentiate into migratory and invasive melanoma cells with neural crest cell (NCC)-like and epithelial-to-mesenchymal transition (EMT)-like features. However, it is still unclear how transformed melanocytes assume a metastatic melanoma cell state. Here, we define DNA methylation changes that accompany metastatic progression in melanoma patients and discover Nuclear Receptor Subfamily 2 Group F, Member 2 - isoform 2 (NR2F2-Iso2) as an epigenetically regulated metastasis driver. NR2F2-Iso2 is transcribed from an alternative transcriptional start site (TSS) and it is truncated at the N-terminal end which encodes the NR2F2 DNA-binding domain. We find that NR2F2-Iso2 expression is turned off by DNA methylation when NCCs differentiate into melanocytes. Conversely, this process is reversed during metastatic melanoma progression, when NR2F2-Iso2 becomes increasingly hypomethylated and re-expressed. Our functional and molecular studies suggest that NR2F2-Iso2 drives metastatic melanoma progression by modulating the activity of full-length NR2F2 (Isoform 1) over EMT- and NCC-associated target genes. Our findings indicate that DNA methylation changes play a crucial role during metastatic melanoma progression, and their control of NR2F2 activity allows transformed melanocytes to acquire NCC-like and EMT-like features. This epigenetically regulated transcriptional plasticity facilitates cell state transitions and metastatic spread.


Conflict of interest statement

The authors declare no competing interests.

Figures

Fig. 1
Fig. 1. Epigenetic regulation of NR2F2 during differentiation and melanoma progression.
a Schematic representation of a workflow to identify and integrate differentially methylated CpGs in neural crest cells (NCCs) and melanocytes along with primary and metastatic melanoma samples from TCGA. 41 CpGs are hypermethylated and 14 CpGs are hypomethylated in NCCs and metastatic melanoma. The five top-ranked hypomethylated CpGs are located in the NR2F2 locus. b Heatmap representation of top-ranked hypo- and hyper-methylated CpGs in NCCs vs melanocytes and metastatic vs. primary melanoma. Methylation scores (β-values) were determined with HumanMethylation450K arrays and they range from 0 (unmethylated, green) to 1 (completely methylated, red). c Schematic representation of NR2F2-Iso1 and NR2F2-Iso2 transcripts (upper panel) and proteins (lower panel). The Differentially Methylated Region (DMR, red line) in NCCs vs. melanocytes and in primary vs. metastatic samples is located at the NR2F2-Iso2 transcriptional start site (TSS; arrow). Upper and lower scale bars depict 1 kb and 10 amino acids, respectively. AF-1, 2: transactivation functional domains; DBD: DNA-binding domain; LBD ligand-binding domain. Heatmap representation of unsupervised cluster analysis of mean β-values (d) and box plots (e one-way ANOVA, whiskers represent min. and max.) showing NR2F2-Iso2 CpGs are unmethylated in embryonic stem (ESCs) and NCC cell lines and hypermethylated in melanocytes (N = 8 ESCs, N = 4 NCCs, N = 8 melanocytes). f Relative NR2F2-Iso1 and NR2F2-Iso2 mRNA expression in ESCs, NCCs and melanocytes by RT-qPCR (bars represent SD, N = 1 ESC, N = 3 NCCs, N = 4 melanocytes). g Heatmap representation of unsupervised cluster analysis of mean β-values showing NR2F2-Iso2 CpGs are more frequently hypomethylated (β < 0.33) in a TCGA cohort of metastatic compared to primary melanoma patient samples. 191 of 364 (52.5 %) metastatic melanoma samples were hypomethylated compared to 32 of 109 (29.4%) primary melanoma samples (Fisher’s exact test, p < 0.0001). h Scatter plots showing mean β-values for NR2F2-Iso2 CpGs of 73 nevi (GSE120878, ref. ), 109 primary (TCGA) and 364 metastatic (TCGA) melanoma tissues (one-way ANOVA, bar represents median). i Scatter plots showing NR2F2-Iso2 mRNA expression in primary and metastatic melanoma samples from TCGA (two-tailed unpaired Mann–Whitney test, bar represents median). j Scatter plots showing inverse correlation (Spearman’s rank correlation, p < 0.0001) between NR2F2-Iso2 mRNA expression and CpG-methylation levels in primary and metastatic melanoma TCGA samples. CpGs depicted in heatmaps d and g are located between −300 to 63 bp relative to the NR2F2-Iso2 TSS. k Ratio of mRNA expression of NR2F2-Iso1/Iso2 in TCGA primary and metastasis melanoma tissues (two-tailed unpaired Mann–Whitney test, bar represents median). Source data are provided as a Source Data file.
Fig. 2
Fig. 2. NR2F2-Iso2 promotes anchorage-independent growth and melanoma sphere formation in vitro.
a qRT-PCR showing relative NR2F2-Iso1 and NR2F2-Iso2 transcript levels normalized to SK-MEL-147, where NR2F2-Iso2 is partly methylated (M) and unmethylated (U). Methylation status was determined with Illumina 450 K arrays and/or methylation specific PCR. b Western blots of melanoma cell lines probed with Isoform-specific NR2F2 antibodies. c Heatmap illustrating CpG-methylation status of NR2F2-Iso2 based on Illumina 450 K array data. d Pie charts showing % CpG methylation of indicated sites at the NR2F2 locus as determined by bisulfite sequencing. Asterisks denote CpGs interrogated in 450 K arrays. e qRT-PCR (left) and western blotting (right) show that treatment of MeWo cells with the demethylating agent 5-aza-2′-deoxycytidine (2.5 μM aza, 72 h) permits NR2F2-Iso2 expression (bars represent SD). One experiment of 2 biological replicates is shown; further validated in other cell lines in Supplementary Fig. 7. f qRT-PCR and western blotting validate isoform-specific NR2F2-Iso2 depletion in NR2F2-Iso2 expressing 4L cells with shNR2F2-Iso2 (shA, shB) compared to shSCR (control) (bars represent SD). Actin served as loading control. Representative result from one of multiple repeats is shown (>3). g Growth rates of shSCR and shNR2F2-Iso2 expressing 4L cells showing no significant differences in 2D cultures (two-way ANOVA, bars represent SD). h Bar graph showing significant difference in colony forming potential in soft agar between shSCR and shNR2F2-Iso2 expressing 4 L cells 21 days after seeding (one-way ANOVA, bars represent min. and max.). i Bar graphs showing changes in sphere forming potential between shSCR and shNR2F2-Iso2 expressing 4L cells (one-way ANOVA, bar represents SD). j qRT-PCR and western blotting validate ectopic NR2F2-Iso2 and endogenous NR2F2-Iso1 expression in MeWo cells (bar represents SD). Actin served as loading control. Representative result from one of multiple repeats is shown (>3). k Growth rates of GFP control and NR2F2-Iso2 overexpressing (Iso2 OE) MeWo cells showing no significant differences in 2D cultures (two-way ANOVA, bar represents SD). l Box plots showing significant difference in colony forming potential in soft agar between GFP control and NR2F2-Iso2 overexpressing MeWo cells 28 days after seeding (two-tailed unpaired T-test, bar represents min. and max.). m Bar graphs showing changes in sphere forming potential between GFP control and NR2F2-Iso2 overexpressing MeWo cells (two-tailed unpaired T-test, bar represents SD). (h, i, l, m: One of three independent experiments is represented). Source data are provided as a Source Data file.
Fig. 3
Fig. 3. NR2F2 isoform 2 promotes melanoma metastasis.
ad 4L (N = 9 shSCR, N = 8 shA athymic/nude mice) and eh 12-273BM ( N= 9 shSCR, N = 12 shA, N = 11 shB NSG mice) cells  labeled with lentiviruses that constitutively express luciferase and mCherry, and transduced with lentiviruses expressing shSCR or shNR2F2-Iso2 (shA, shB) along with green fluorescent protein (GFP), were instilled into mouse hearts by ultrasound-guided injection. a, e Bioluminescence and fluorescence images of mice and their corresponding organs (brains, lungs and ovaries in a; livers in e) ex vivo at the endpoint of one representative experiment. b, f In Vivo Imaging System (IVIS) measurements showing significant differences in radiance levels between groups during tumor progression (two-way ANOVA, bars represent SEM). c Bar graphs showing that the average number of lung metastases per tissue section is significantly reduced in mice injected with shNR2F2-Iso2 compared to those injected with shSCR expressing 4L cells (two-tailed unpaired T-test, bars represent SEM). d Representative H&E-stained tissue sections. Circles identify metastases. Scale bar = 100 μm. Bar graphs showing g average number of metastases per liver section and h GFP intensity of livers indicate significantly reduced metastatic burden in mice injected with shNR2F2-Iso2 compared to those instilled with shSCR expressing 12-273 BM cells (two-way ANOVA, bars represent SD). Error bars represent standard error of the mean. Source data are provided as a Source Data file.
Fig. 4
Fig. 4. NR2F2-Iso2 controls an expression signature enriched in metastasis promoting gene sets.
a Ridge and Bubble plots showing transcriptomic changes after NR2F2-Iso2 loss in 4L cells are significantly associated with reduced angiogenesis and EMT gene sets. p.adj indicates FDR. b Heatmap showing Log2 fold changes of 500 NR2F2-Iso2 signature genes that were significantly down-regulated in 4L and 12-273BM cells upon NR2F2-Iso2 knockdown. Most of these genes are up-regulated in MeWo cells upon ectopic NR2F2-Iso2 expression. Scatter plots and Spearman tests (p < 0.001) correlate average NR2F2-Iso2 signature gene expression directly with NR2F2-Iso2 expression (c) and indirectly with NR2F2-Iso2 CpG methylation (d) in human melanoma samples from TCGA. Scatter plots showing the NR2F2-Iso2 signature gene score is significantly higher in unmethylated compared to methylated (e) and metastatic compared to primary (f) melanoma samples from TCGA (two-tailed Mann–Whitney test, bar represents median). g Heatmap showing Log2 fold-change expression of selected EMT genes between shNR2F2-Iso2 and shSCR expressing 4L or 12-273BM cells. h qRT-PCR and i western blotting show significantly reduced SNAI1 expression in shNR2F2-Iso2 compared to shSCR expressing 4L or 12-273BM cells. (N = 3, two-way ANOVA, data shown from one representative experiment; bars represent SD; tubulin served as western blot loading control). jm tSNE and Violin plots showing scRNA-seq data from the Tyr-CreER; BRAFCA/+/ PtenFL/FL;R26-LSL-tdTomato mouse model [ref. .]. j Dimensionality plot identifies neural crest-like (NC), melanocytic (Mc), intermediate (I), EMT-like, and proliferative (P) melanoma cells. Feature plots show enrichment of (k) Nr2f2 expression and (l) NR2F2-Iso2 signature score in melanoma cell states. m Violin plots show Nr2f2-Iso2 signature gene enrichment in EMT-like cells (two-way unpaired Mann-Whitney test). Source data are provided as a Source Data file.
Fig. 5
Fig. 5. NR2F2-Iso2 modulates the transactivation capacity of full-length NR2F2-Iso1.
a Heatmaps and histograms of NR2F2-Iso1 ChIP-seq peaks that significantly decrease (p < 0.05), modestly decrease (p > 0.05) or increase (p < 0.05) upon NR2F2-Iso2 silencing. MEME-ChIP discovers centrally distributed NR2F2-like motifs at peak summits in each cluster along with other transcription factor motifs that are enriched with NR2F2 in specific clusters. b Venn diagram intersecting 4385 potential NR2F2 target genes (annotated with GREAT—Genomic Regions Enrichment of Annotations Tool—using standard parameters) with 1905 up- or 2377 downregulated transcripts in shNR2F2-Iso2 compared to shSCR melanoma cells suggest NR2F2-Iso2 loss inhibits the expression of 711 and activates the expression of 426 direct NR2F2-Iso1 targets. HOMER identifies transcription factor motifs that are significantly enriched at NR2F2-bound sites that result in decreased or increased target gene transcription after NR2F2-Iso2 loss. c Examples of NR2F2-Iso1 ChIP-seq tracks in 4L cells transduced with scrambled or shA (2 experimental replicates shown) showing NR2F2-Iso1 binding to the regulatory regions of genes modulated by NR2F2-Iso2 SNAI1, RUNX1, and PMEL. d Cellular fractionation studies identify NR2F2-Iso2 in the nuclear and cytoplasmic fractions. NR2F2-Iso1 was exclusively detected in the nuclear fraction of 4L cells. e Two NR2F2-Iso1 antibodies (Abcam, Active Motif) co-immunoprecipitate NR2F2-Iso2 along with NR2F2-Iso1 from 4L cell lysates. Likewise, GFP Trap (ChromoTek) immuno-precipitates NR2F2-Iso1 along with ectopically expressed GFP-NR2F2-Iso2 from MeWo cell lysates. Immunoprecipitated NR2F2-Iso1 was detected by western blot with NR2F2-Iso1 (antibody Abcam) and immunoprecipitated NR2F2-Iso2 was detected with NR2F2-Iso2 specific antibody (Millipore). f MeWo cells were transduced with lentiviral vectors expressing GFP (pLenti-C-mGFP), GFP-NR2F2-Iso2 (Iso2, Iso2-wt) or GFP-NR2F2-Iso2 mutants where Leucine 231 (Iso2-m1), Leucine 232 (Iso2-m2) or both (Iso2-m1m2) were mutated to Alanine. GFP antibodies immunoprecipitated NR2F2-Iso1 with wild-type GFP-NR2F2-Iso2 but not with their mutants after their expression in MeWo cells. g Box plots (right) showing that ectopic expression of GFP-NR2F2-Iso2 (Iso2-WT), but not GFP or GFP-NR2F2-Iso2 where Leucine 231 and Leucine 232 were mutated to Alanine (Iso2-m1m2), enhances the colony forming potential of MeWo cells significantly (two-way ANOVA, one of three independent experiments is represented, bars represent min. and max.). NR2F2-isoform specific expression in GFP, Iso2-WT and Iso2m1m2 was assessed by western blot (left). Experiments in f, g have been done twice. Source data are provided as a Source Data file.
Fig. 6
Fig. 6. NR2F2-Iso1 reduces colony formation ability and metastatic potential.
a qRT-PCR and b western blotting confirms ectopic NR2F2-Iso1 expression in MeWo cells (bars represent SD). c Bar graph showing significantly reduced colony forming ability of MeWo cells that ectopically express NR2F2-Iso1 28 days after seeding (two-tailed unpaired T test, bars represent SD). d qRT-PCR data and e western blotting showing differences in NR2F2-Iso1 expression between shSCR and shNR2F2-Iso1 (shX, shY) MeWo cells that ectopically express GFP or GFP-NR2F2-Iso2 (bars represent SD). f Bar graphs showing relative colony forming efficiencies of these cells 21 days after seeding (two-way ANOVA, bars represent SD) (n = 6 experimental replicates). Experiments in af have been done al least twice; c and f three times. (gi) 4L cells (n = 9 GFP, 10 Iso1 OE NSG mice) labeled with lentiviruses that constitutively express luciferase and red fluorescence protein (RFP) and transduced with lentiviruses expressing GFP or GFP-NR2F2-Iso1, were instilled into NSG mouse hearts. g Bioluminescence and fluorescence images of mice and their corresponding metastases containing livers ex vivo at the endpoint of one representative experiment. h In Vivo Imaging System (IVIS) measurements showing significant reduction in radiance levels in mice injected with GFP-NR2F2-Iso1 cells compared to those harboring GFP expressing cohorts during tumor progression (two-way ANOVA, bars represent SEM). i Bar graphs showing average GFP intensity in livers of mice injected with GFP or GFP-NR2F2-Iso1 expressing 4L cells (two-tailed unpaired T-test, bars represent SD). Scale bars = 1 cm on macroscopic images of livers. Source data are provided as a Source Data file.

References

    1. Alison MR, Islam S, Wright NA. Stem cells in cancer: instigators and propagators? J. Cell Sci. 2010;123:2357–2368. doi: 10.1242/jcs.054296. - DOI - PubMed
    1. Baccelli I, Trumpp A. The evolving concept of cancer and metastasis stem cells. J. Cell Biol. 2012;198:281–293. doi: 10.1083/jcb.201202014. - DOI - PMC - PubMed
    1. Marie KL, et al. Melanoblast transcriptome analysis reveals pathways promoting melanoma metastasis. Nat. Commun. 2020;11:333. doi: 10.1038/s41467-019-14085-2. - DOI - PMC - PubMed
    1. Visvader JE, Lindeman GJ. Cancer stem cells in solid tumours: accumulating evidence and unresolved questions. Nat. Rev. Cancer. 2008;8:755–768. doi: 10.1038/nrc2499. - DOI - PubMed
    1. Kath R, Jambrosic JA, Holland L, Rodeck U, Herlyn M. Development of invasive and growth factor-independent cell variants from primary human melanomas. Cancer Res. 1991;51:2205–2211. - PubMed

Publication types

MeSH terms