. 2023 Apr 3;8(1):144.
doi: 10.1038/s41392-023-01351-5.

tRF-Gln-CTG-026 ameliorates liver injury by alleviating global protein synthesis

Affiliations

tRF-Gln-CTG-026 ameliorates liver injury by alleviating global protein synthesis

Sunyang Ying et al. Signal Transduct Target Ther. .

Abstract

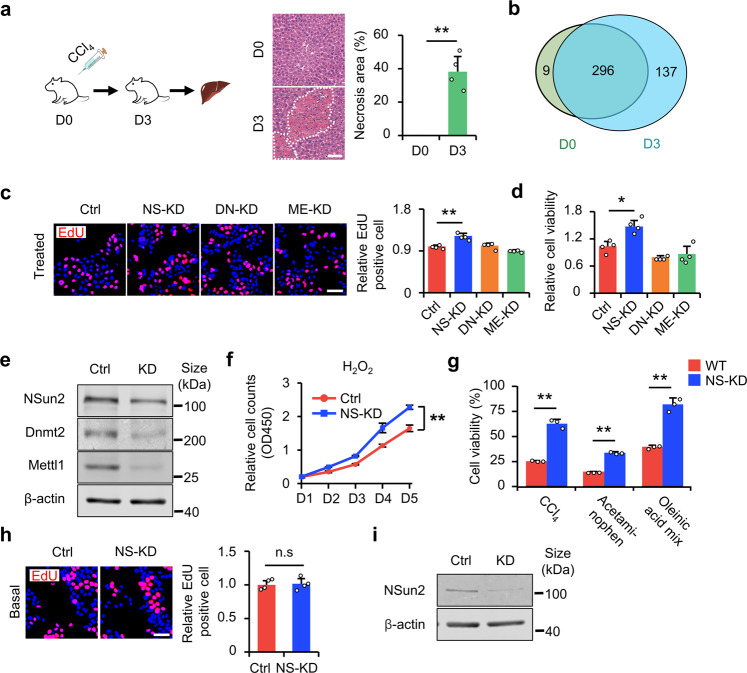
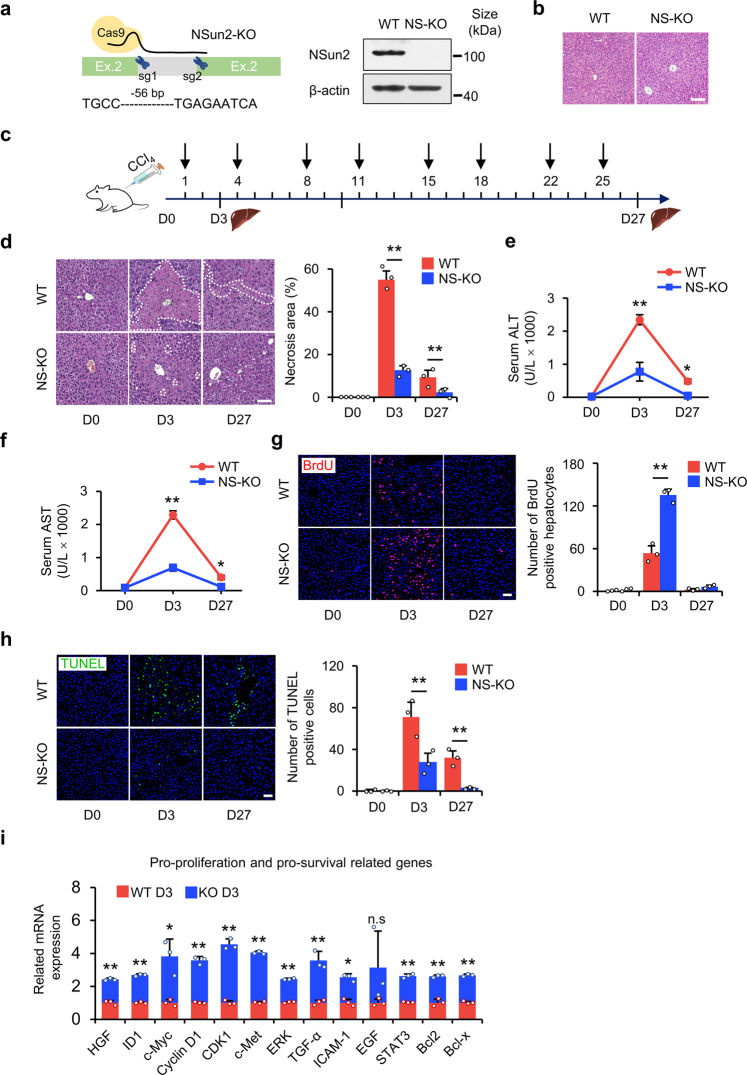
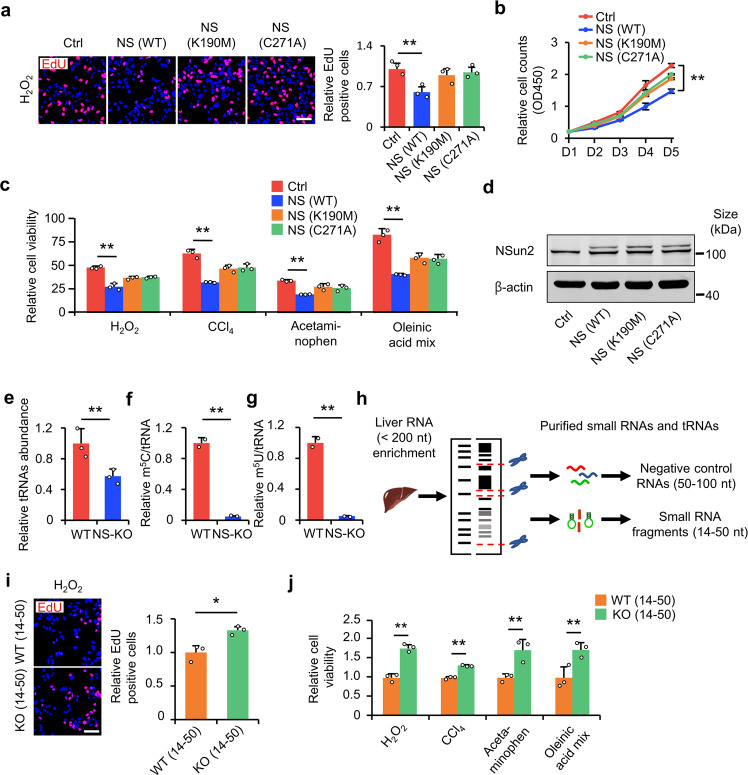
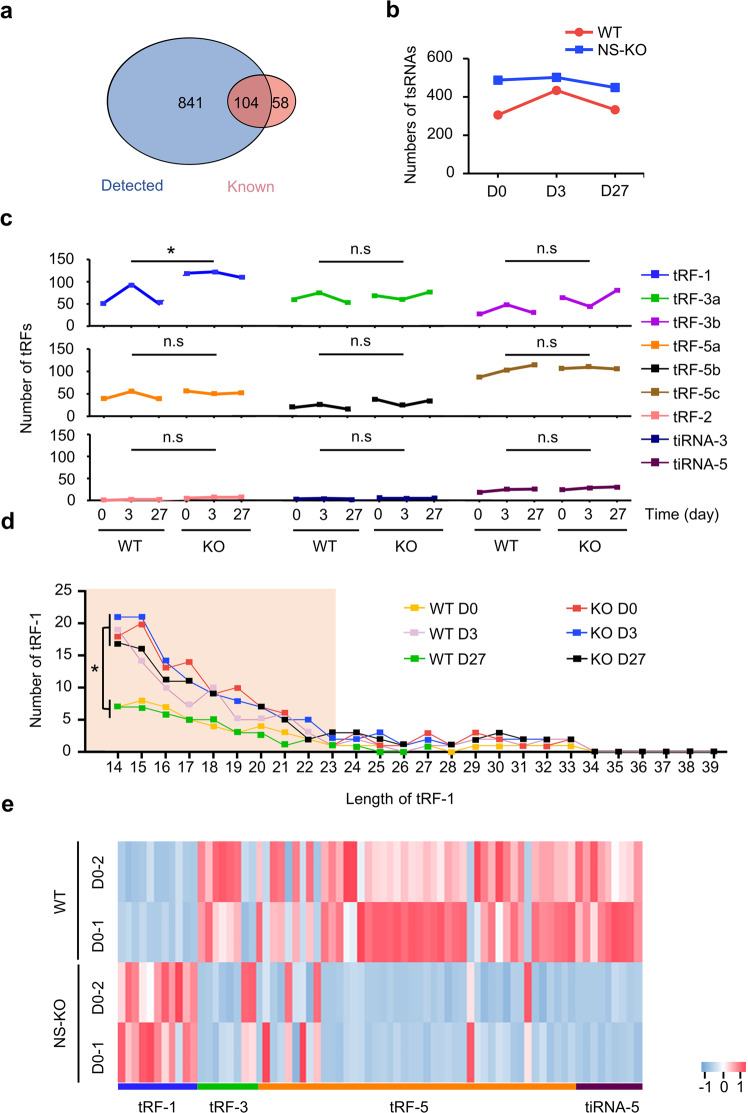
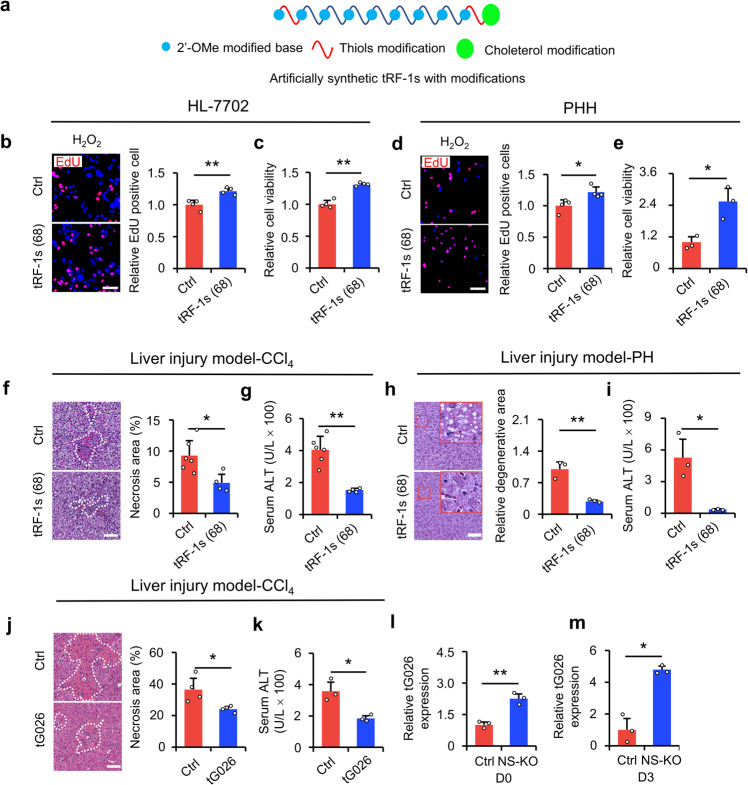
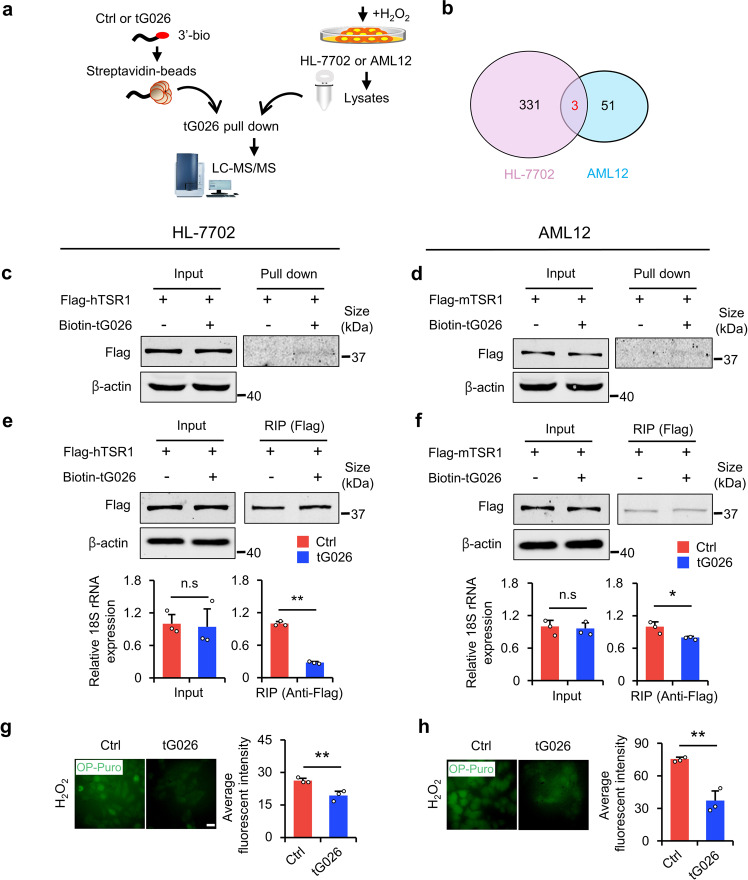
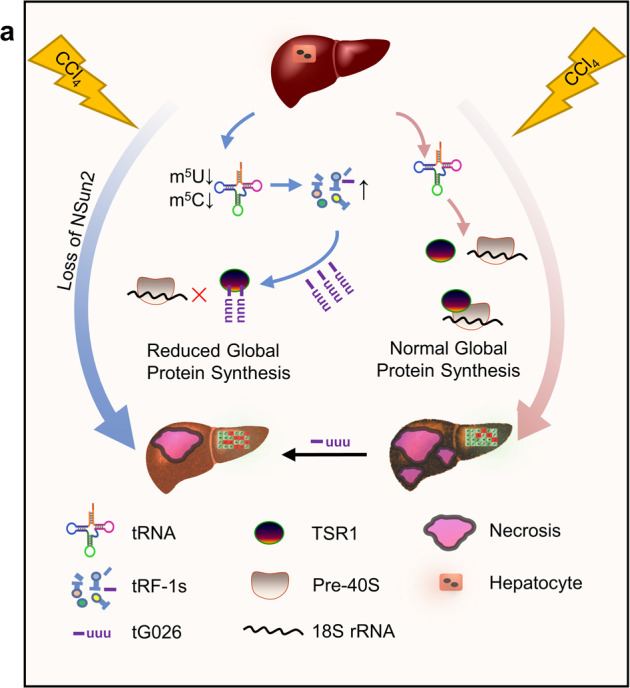
tsRNAs (tRNA-derived small RNAs), as products of the stress response, exert considerable influence on stress response and injury regulation. However, it remains largely unclear whether tsRNAs can ameliorate liver injury. Here, we demonstrate the roles of tsRNAs in alleviating liver injury by utilizing the loss of NSun2 (NOP2/Sun domain family, member 2) as a tsRNAs-generating model. Mechanistically, the loss of NSun2 reduces methyluridine-U5 (m5U) and cytosine-C5 (m5C) of tRNAs, followed by the production of various tsRNAs, especially Class I tsRNAs (tRF-1s). Through further screening, we show that tRF-Gln-CTG-026 (tG026), the optimal tRF-1, ameliorates liver injury by repressing global protein synthesis through the weakened association between TSR1 (pre-rRNA-processing protein TSR1 homolog) and pre-40S ribosome. This study indicates the potential of tsRNA-reduced global protein synthesis in liver injury and repair, suggesting a potential therapeutic strategy for liver injury.


Conflict of interest statement

The authors declare no competing interests.

Figures

Fig. 1
Fig. 1
NS-KD alleviates cell injury. a CCl4-induced liver injury. Left panel: schematic of the construction of liver injury mice models. Liver injury was induced by CCl4 injection. The lower part indicates the time, i.e., D0: intraperitoneally (i.p.) injection of CCl4 or vehicle on day 0. D3: assessing the extent of liver injury on day 3. Right panel: H&E staining showing hepatic necrosis following injection of vehicle (D0) or CCl4 (D3). Dotted lines indicate the necrotic or inflammatory area, and the percentage of the necrotic or inflammatory area is quantified. Scale bar, 50 μm; n = 4 mice. b Venn diagram showing the numbers of tsRNAs in the presence or absence of CCl4 stress. The color represents samples with or without CCl4 stress. The numeral is the number of tsRNAs in the corresponding area. The data are acquired by tsRNA-seq, and each group comprised two duplicate samples. c The effect of four tRNA modification enzymes on HL-7702 proliferation under H2O2 stress. Treated: H2O2. Left panel: representative images of EdU staining are shown. Right panel: statistical results. Scale bar, 100 μm. EdU-positive cells were analyzed as data relative to the control n = 4 replicates. d Relative HL-7702 viability (CCK-8 assay) was assessed by detecting the OD450 value. n = 4 replicates. e NSun2 expression was measured to verify the knockdown effect of NSun2 by western blotting in (c) and (d). f Detection of HL-7702 proliferation using CCK-8 assay under H2O2 stress at the indicated time points (day 1, day 2, day 3, day 4, day 5), **P < 0.01, versus control siRNA at day 5. g Detection of transfected HL-7702 cell survival after stimulation with other chemicals. HL-7702 viability was assessed by the CCK-8 assay. n = 3 replicates. h Detection of transfected HL-7702 cell proliferation in the absence of stress damage. Basal: no H2O2. Left panel: representative images of EdU staining. Right panel: statistical results. Scale bar, 100 μm. EdU-positive cells were analyzed relative to the control. n = 4 replicates. i NSun2 expression was measured to verify the knockdown effect of NSun2 by western blotting for (fh) and Supplementary Fig. S1j. NSun2 siRNA: NS-KD; Ctrl siRNA: Ctrl. All data are expressed as the mean ± SD. *P < 0.05, **P < 0.01, n.s. no significance, Student’s t-test
Fig. 2
Fig. 2
NS-KO improves liver necrosis, regeneration, and survival in vivo. a Generation of NS-KO mice. Left panel showing a schematic representation of NS-KO mice, NSun2 genomic locus, and NSun2 deleted locus. The targeting sgRNA was designed to knock out 56 bp DNA fragments in exon 2 of the NSun2 gene. The right panel is genotyping analysis of WT and NS-KO mice confirmed by western blotting. b H&E staining showing mouse liver in WT and NS-KO mice not subjected to stress. Scale bar, 50 μm; n = 3 mice. c Schematic of the construction of liver injury mice models. Liver injury was induced by repeated injections of CCl4. The part above the arrow line of time represents the injection time, and the part under the arrow line represents the liver-obtained time. D0: no injury; D3: day 3 after injury; D27: day 27 after injury. d H&E staining showing hepatic necrosis at different time points after CCl4 injection. Dotted lines indicate the necrotic or inflammatory area and the percentage of the necrotic or inflammatory areas is quantified. Scale bar, 50 μm; n = 3 mice. e, f Mouse serum ALT (e) and AST (f) concentrations were assessed to determine the degree of liver injury after repeated CCl4 injection, n = 4 mice. g Hepatocytes proliferation in liver sections. Three hours before the mice were euthanized, 5-bromodeoxyuridine (BrdU) incorporation was performed for WT and NS-KO mice treated with CCl4 and BrdU-positive hepatocytes were quantified. Scale bars, 200 μm; n = 3 mice. h TdT-mediated dUTP nick end labeling (TUNEL) assay on liver sections of WT mice or NS-KO mice treated with CCl4. Green cells indicate TUNEL-positive (apoptotic) cells. Nuclei were stained with DAPI, and TUNEL-positive nuclei were quantified. Scale bars, 200 μm; n = 3 mice. i Proliferation- and survival-related gene expression was quantified by qRT-PCR after liver injury. n = 3 mice. For data in this figure, representative images are shown. All data are presented as the mean ± SD. *P < 0.05, **P < 0.01, Student’s t-test
Fig. 3
Fig. 3
NS-KO-derived tsRNAs alleviate liver injury. a NSun2-knockdown HL-7702 cells were rescued with wild-type NSun2 (NS), two catalytically dead mutants (K190M, C271A), or the empty vector. Relative levels of EdU-positive cells were determined. n = 3 replicates. b Cell proliferation assay (CCK-8) of NSun2-knockdown HL-7702 rescued by enzymatic-dead NSun2. Detection of OD450 at the indicated times (day 1, day 2, day 3, day 4, day 5) under H2O2 stress, **P < 0.01, versus NS-KD at day 5. c Cell viability detection of NSun2-knockdown HL-7702 rescued by enzymatic-dead NSun2. Relative cell viability was assessed by CCK-8 assay. n = 3 replicates. The data in Fig. 3c and Fig. 1g are from the same batch of experiments. d NSun2 expression was measured to verify the rescue effect of NSun2 by western blotting in (ac). e tRNA abundance in WT and NS-KO mice. Data indicate the tRNA abundance relative to WT, n = 3 mice. f, g Liquid chromatography-mass spectrometry showing the differences of tRNA m5U (f) and m5C (g) modifications in WT and NS-KO mice. Data are shown as a relative value (tRNA modification/total tRNA), n = 2 mice. h Schematic for isolating small liver RNAs. i EdU assay showing the proliferation of isolated fragments. EdU-positive cells were analyzed as data relative to WT. Scale bar, 100 μm. n = 3 replicates. j CCK-8 assay showing the survival of isolated fragments. Relative cell viability (CCK-8 assay) of 14–50 nt RNAs transfection was assessed by detecting the OD450 value. n = 3 replicates. For all data in this figure representative images are shown. All data are presented as the mean ± SD. *P < 0.05, **P < 0.01, Student’s t-test
Fig. 4
Fig. 4
tsRNA-seq showing the signature of tRF-1s in WT and NS-KO mice subjected to stress. a Venn diagram showing the known tsRNAs from tRFdb and the tsRNAs detected from tsRNA-seq. b Group line chart showing the different number of tsRNAs at different time points in WT and NS-KO mice. D0: day 0: no injury; D3: day 3 after injury; D27: day 27 after injury. n = 2 mice. c Group line chart showing the distribution of subtypes of tsRNAs. The Y-axis represents the number of tsRNAs subtypes. The X-axis represents the injury time points in WT and NS-KO mice. d The number of tRF-1s against the length of tRF-1s reads. A line chart showing the sequence read length distribution in WT and NS-KO mice at different injury time points. The X-axis represents the length of tRF-1s, and the Y-axis represents the number of tRF-1s. The color represents the injury time points in WT and NS-KO mice. e Hierarchical clustering heatmap of differentially expressed tsRNAs (P < 0.05 and log2FC > 2). Each column represents each tsRNA, and all selected tsRNAs are categorized into no more than six clusters based on the tsRNAs subtypes. Each row represents a replicate. The color in the panel represents the relative expression level of the same type of tsRNAs (row normalization by z-score). The color scale is shown on the right: blue represents an expression level below the mean; while red represents an expression level above the mean. All data in this figure are acquired by tsRNA-seq, with two duplicates performed for each group. All data are expressed as the mean ± SD. *P < 0.05, n.s no significance, Student’s t-test
Fig. 5
Fig. 5
Screened tG026 promoted cell proliferation and survival after injury. a The modified pattern of artificially synthesized tRF-1s. b HL-7702 cells were transfected with 68 artificially synthesized tRF-1s. Random code sequence was used as a negative control. EdU-positive cells were analyzed relative to the control. n = 4 replicates. Representative images (left panel) and statistical results (right panel) are shown. Scale bar, 100 μm. c Relative cell viability (CCK-8 assay) was assessed by detecting the OD450 value. n = 4 replicates. d The results of (b) in PHH cells. n = 4 replicates. e The results of (c) in the PHH cells. n = 3 replicates. f, g The effects of injection of 68 synthetic tRF-1s with modifications in vivo in CCl4-induced liver injury. H&E staining (f) and the liver function index, ALT (g), were used to assess the extent of liver injury. Control mice, n = 6; tRF-1s mice, n = 4. h, i The effects of injection of 68 synthetic tRF-1s with modifications in vivo on partial hepatectomy liver. H&E staining (h) and the liver function index, ALT (i), were used to assess the extent of liver injury. n = 3 mice. j, k The effects of injection of synthetic tG026 with modifications in vivo on CCl4-induced liver injury. H&E staining (j) and the liver function index, ALT (k), were used to assess the extent of liver injury. H&E staining, n = 4 mice; ALT measurement, n = 3 mice. l, m The relative expression of tG026 in NS-KO mice at D0 (l) or D3 (m) after injury. D0: no injury; D3: on day 3 after liver injury. n = 3 mice. For data in this figure, control mice received an i.p. injection of random code sequence RNAs. Images shown are representative. Scale bar for H&E staining is 50 μm. All data are presented as mean ± SD. *P < 0.05, **P < 0.01, Student’s t-test
Fig. 6
Fig. 6
tG026 inhibits the interaction between TSR1 and 18S rRNA to reduce GPS. a The schematic of using RNA pull-down binding LC-MS to screen interactive proteins with tG026. b Venn diagram showing the interacting proteins with tG026 common to both HL-7702 and AML12 after tG026 RNA pull-down. The screening standards of interacting proteins are as follows: 1. The average value in control group must be zero; 2. The average value in tG026 group is non-zero. The red font represents the number of interacting proteins common to HL-7702 and AML12. n = 3 replicates. c, d RNA pull-down verified the interaction between TSR1 and tG026 in HL-7702 (c) and AML12 (d). e, f After tG026 and Flag-TSR1 were transfected, the interaction between TSR1 and 18S rRNA in HL-7702 (e) and AML12 (f) were detected by RIP. Input showing the unchanged 18S rRNA expression after transfection of tG026. n = 3 replicates. g, h Global protein synthesis under H2O2 stress in HL-7702 (g) and AML12 (h) was assayed by OP-Puro incorporation. Representative images (left panel) and statistical results (right panel) are shown. Scale bar, 50 μm. n = 3 replicates. All data are expressed as the mean ± SD. *P < 0.05, **P < 0.01, n.s. no significance, Student’s t-test
Fig. 7
Fig. 7
Model of tG026 mechanism in liver injury. Loss of NSun2 can ameliorate liver injury produced by CCl4 injection. Mechanistically, the loss of NSun2 reduces m5U and m5C modifications. Hence, the tRNAs become unstable and produce tsRNAs, particularly tRF-1s. Through further screening experiments, tG026 was found to inhibit the association between TSR1 and 18S rRNA by interacting with TSR1, thereby reducing global protein synthesis and alleviating liver injury

References

    1. Ruart M, et al. Impaired endothelial autophagy promotes liver fibrosis by aggravating the oxidative stress response during acute liver injury. J. Hepatol. 2019;70:458–469. doi: 10.1016/j.jhep.2018.10.015. - DOI - PMC - PubMed
    1. Dey A, Cederbaum AI. Alcohol and oxidative liver injury. Hepatology. 2006;43:S63–S74. doi: 10.1002/hep.20957. - DOI - PubMed
    1. Losser MR, Payen D. Mechanisms of liver damage. Semin. Liver Dis. 1996;16:357–367. doi: 10.1055/s-2007-1007249. - DOI - PubMed
    1. Cole C, et al. Filtering of deep sequencing data reveals the existence of abundant Dicer-dependent small RNAs derived from tRNAs. RNA. 2009;15:2147–2160. doi: 10.1261/rna.1738409. - DOI - PMC - PubMed
    1. Lee YS, Shibata Y, Malhotra A, Dutta A. A novel class of small RNAs: tRNA-derived RNA fragments (tRFs) Genes Dev. 2009;23:2639–2649. doi: 10.1101/gad.1837609. - DOI - PMC - PubMed

Publication types