. 2023 Apr 4;13(1):5482.
doi: 10.1038/s41598-023-31545-4.

Varying genesis and landfall locations for North Atlantic tropical cyclones in a warmer climate

Affiliations

Varying genesis and landfall locations for North Atlantic tropical cyclones in a warmer climate

Mackenzie M Weaver et al. Sci Rep. .

Abstract

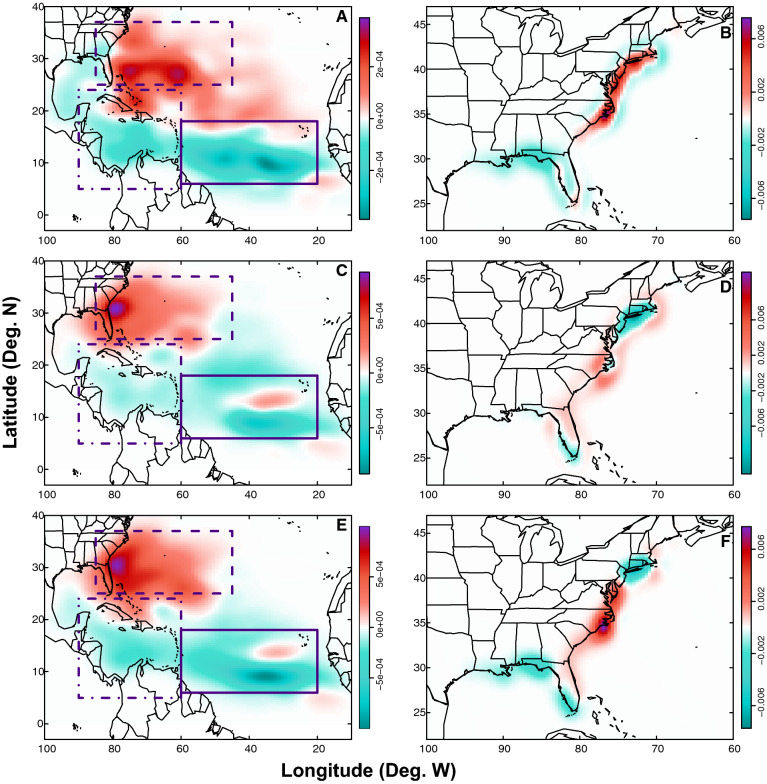
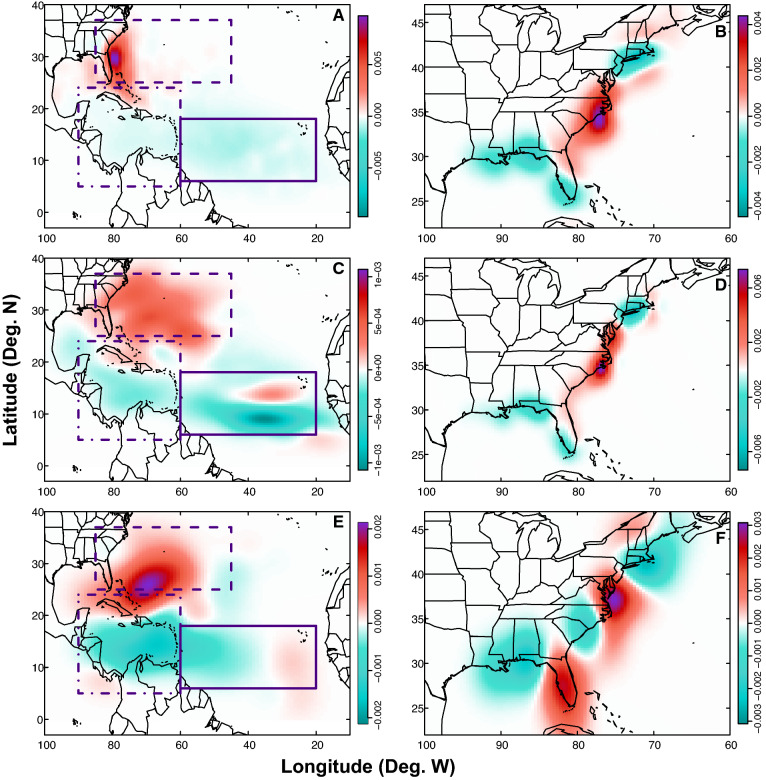
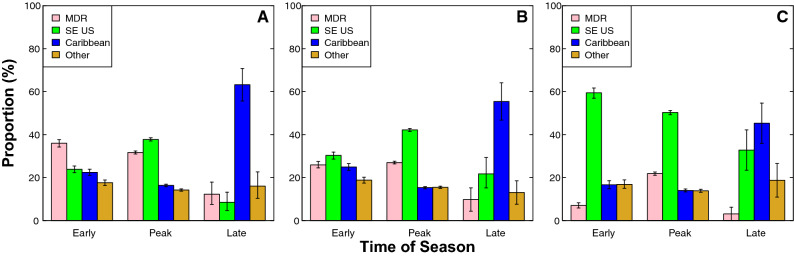
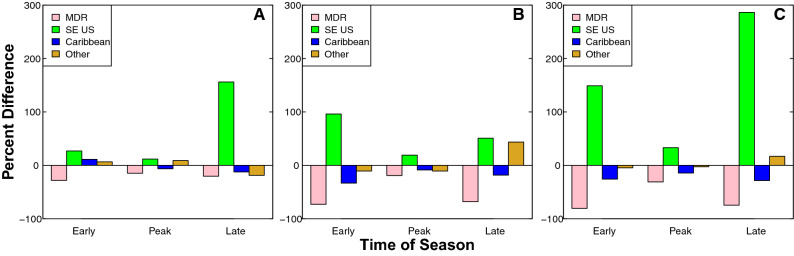
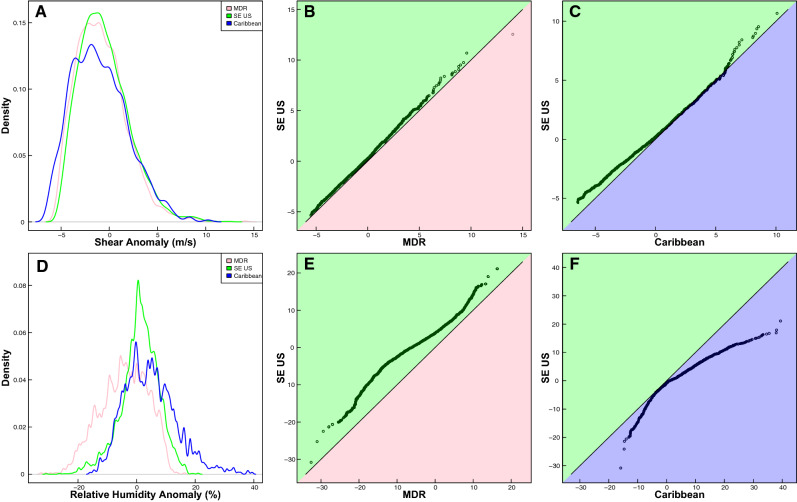
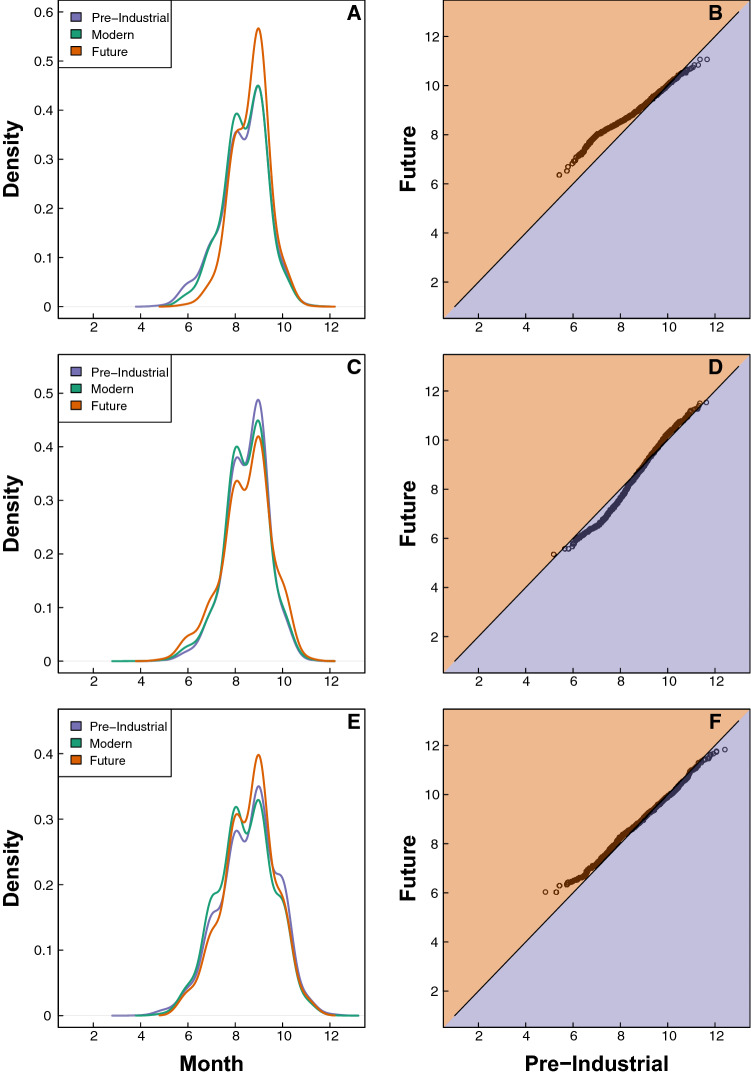
Tropical cyclones (TCs) are one of the most dangerous hazards that threaten U.S. coastlines. They can be particularly damaging when they occur in densely populated areas, such as the U.S. Northeast. Here, we investigate seasonal-scale variations in TC genesis and subsequent first landfall locations of > 37,000 synthetic TCs that impact the U.S. Northeast from the pre-industrial era (prior to 1800) through a very high emissions future (RCP8.5; 2080-2100). TC genesis in the Main Development Region decreases across all parts of the season from the pre-industrial to the future, with the greatest decreases in the proportion of genesis (up to 80.49%) occurring in the early and late seasons. Conversely, TC genesis in a region near the U.S. southeast coast increases across all parts of the season from the pre-industrial to the future, with the greatest increases in the proportion of genesis (up to 286.45%) also occurring in the early and late seasons. Impacts of changing TC genesis locations are highlighted by variations in where TCs make their first landfall over the same time periods, with an increase in landfalls along the mid-Atlantic seaboard from Delaware to North Carolina during all parts of the season from the pre-industrial to the future.


Conflict of interest statement

The authors declare no competing interests.

Figures

Figure 1
Figure 1
Density difference maps of TC genesis and landfall locations. Maps show the density differences of TC genesis points (A, C, E) and TC first landfall points (B, D, F). Density differences are shown for the modern era minus the pre-industrial era (A, B); future era minus modern era (C, D), and future era minus pre-industrial era (E, F). On genesis plots (A, C, E), solid purple rectangles designate the location of the MDR, dashed rectangles designate the location of the SE US, and dashed/dotted rectangles designate the location of the Caribbean. Note that in order to clearly show all results, colorbars are not uniform across maps. Units for the colorbars are TC points per grid cell, where each map has 100 grid cells in both the latitudinal and longitudinal directions.
Figure 2
Figure 2
Density difference maps of TC genesis (A, C, E) and landfall locations (B, D, F) during different parts of the season. Maps show the density differences of TC genesis points (A, C, E) and TC first landfall points (B, D, F). Density differences are shown for the future minus pre-industrial early season (A, B); future minus pre-industrial peak season (C, D), and future minus pre-industrial late season (E, F). Rectangles (A, C, E) are as in Fig. 1. Note that in order to clearly show all results, colorbars are not uniform across maps. Units for the colorbars are TC points per grid cell, where each map has 100 grid cells in both the latitudinal and longitudinal directions.
Figure 3
Figure 3
Bar graphs displaying the amount of TC genesis in each region during each part of the season. Bars show seasonal amounts of TC genesis during (A) the pre-industrial era, (B) the modern era, and (C) the future era. Error bars show bootstrapped 90% credible intervals.
Figure 4
Figure 4
Bar graphs displaying the proportional change in TC genesis within each region during each part of the season. Bar graphs of the proportional change across (A) modern era compared to pre-industrial era, (B) future era compared to modern era, and (C) future era compared to pre-industrial era.
Figure 5
Figure 5
Probability density functions of vertical wind shear (A) and relative humidity (D) anomalies across regions for each genesis point in the future era relative to the 1980–2000 baseline. Note, the baseline is defined as the 1980–2000 mean of (A) wind shear and (D) relative humidity values across the full season for each individual region. In figures (A) and (D), lines represent the MDR (pink), SE US (green), and Caribbean (blue) regions. QQ-plots (B, C, E, F) compare the quantiles of the distributions of the wind shear (B, C) and relative humidity (EF) anomalies between the MDR and SE US (B, E) and between the SE US and Caribbean (C, F). Background colors on QQ-plots are the same as colors used for PDFs, and indicate different regions. Black solid lines on the QQ-plots show the 1–1 line; points that diverge from this line indicate that the distributions for the two regions being compared are significantly different.
Figure 6
Figure 6
Probability density functions (A, C, E) and QQ-plots (B, D, F) of TC genesis points within each region. PDFs of (A) MDR genesis, (C) SE US genesis, and (E) Caribbean genesis are shown for the pre-industrial (purple), modern (green), and future (orange) eras. QQ-plots show the quantile differences of pre-industrial (purple background) and future (orange background) distributions for (B) the MDR, (D) the SE US, and (F) the Caribbean. Black solid lines on the QQ-plots show the 1–1 line; points that diverge from this line indicate that the pre-industrial and future distributions are significantly different.

References

    1. Kishore N, et al. Mortality in Puerto Rico after Hurricane Maria. N. Engl. J. Med. 2018;379:162–170. doi: 10.1056/NEJMsa1803972. - DOI - PubMed
    1. Santos-Burgoa C, et al. Differential and persistent risk of excess mortality from Hurricane Maria in Puerto Rico: A time-series analysis. Lancet Planet Health. 2018;2:e478–e488. doi: 10.1016/S2542-5196(18)30209-2. - DOI - PubMed
    1. NOAA National Centers for Environmental Information (NCEI). U.S. billion-dollar weather and climate disasters. https://www.ncei.noaa.gov/access/billions (2023).
    1. Hanchey A, et al. Notes from the field: Deaths related to Hurricane Ida reported by media—nine states, August 29–September 9, 2021. MMWR Morb. Mort. Wkly. Rep. 2021;70:1385–1386. doi: 10.15585/mmwr.mm7039a3. - DOI - PMC - PubMed
    1. NOAA National Hurricane Center (NHC). Tropical cyclone climatology. https://www.nhc.noaa.gov/climo/ (2020).

LinkOut - more resources