. 2023 Apr 4;6(1):338.
doi: 10.1038/s42003-023-04690-9.

Insect decline in forests depends on species' traits and may be mitigated by management

Affiliations

Insect decline in forests depends on species' traits and may be mitigated by management

Michael Staab et al. Commun Biol. .

Abstract

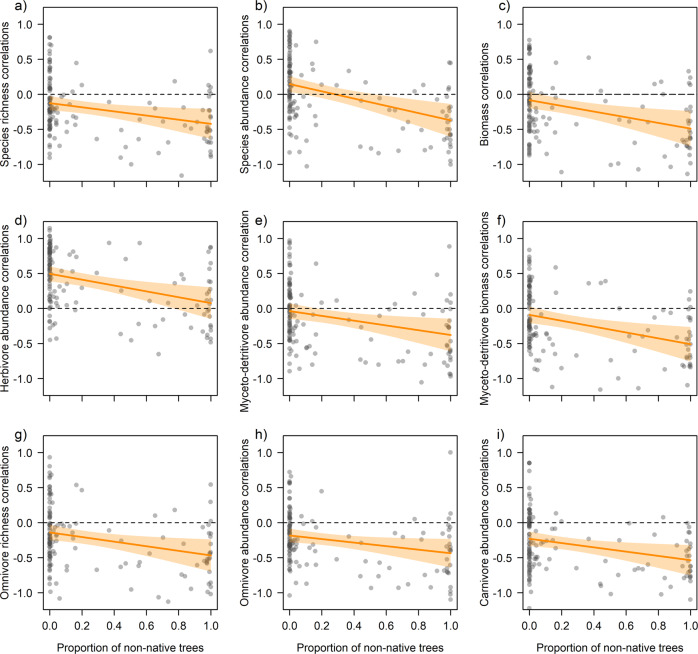
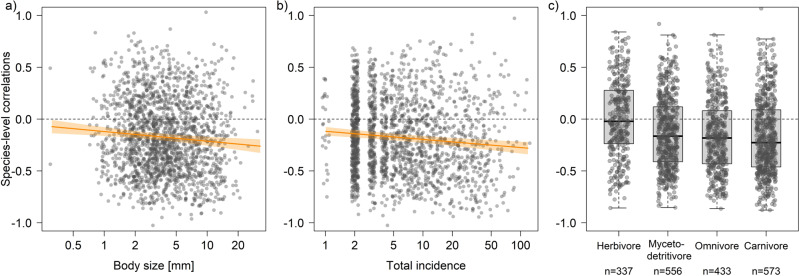
Insects are declining, but the underlying drivers and differences in responses between species are still largely unclear. Despite the importance of forests, insect trends therein have received little attention. Using 10 years of standardized data (120,996 individuals; 1,805 species) from 140 sites in Germany, we show that declines occurred in most sites and species across trophic groups. In particular, declines (quantified as the correlation between year and the respective community response) were more consistent in sites with many non-native trees or a large amount of timber harvested before the onset of sampling. Correlations at the species level depended on species' life-history. Larger species, more abundant species, and species of higher trophic level declined most, while herbivores increased. This suggests potential shifts in food webs possibly affecting ecosystem functioning. A targeted management, including promoting more natural tree species composition and partially reduced harvesting, can contribute to mitigating declines.


Conflict of interest statement

The authors declare no competing interests.

Figures

Fig. 1
Fig. 1. Distribution of site-level correlations.
Shown is Pearson’s r between year and the respective community response in species richness (left column), abundance (middle column), and biomass (right column) for ac the total insect community, df herbivores, gi myceto-detritivores, jl omnivores, and mo carnivores. Bold vertical lines indicate average correlations (95% in shaded polygons). Correlations were negative on average with the exception of positive average correlations for herbivore species richness and abundance, while for total abundance and herbivore biomass 95% CI overlapped with null. Dashed vertical lines mark null with negative values indicating sites with declining and positive values sites with increasing community responses over time. Numerical details are reported in Supplementary Table 2. Percentages in each panel give the proportion of sites with negative (left) and positive (right) correlations.
Fig. 2
Fig. 2. Results for site-level correlations and the proportion of non-native trees.
The proportion of non-native trees per site was related to site-level correlations (each shown as partial residuals of Pearson’s r between year and the respective community response) in insect populations, with sites characterized by more non-native trees having more negative (or less positive) correlations in a total insect species richness, b total insect abundance, and c total insect biomass. The relationship with non-native trees was found for all trophic groups as indicated for d herbivore abundance, e myceto-detritivore abundance, f myceto-detritivore biomass, g omnivore species richness, h omnivore abundance, and i carnivore abundance. Note that even for d herbivores, which had positive correlations with time, abundance correlations on sites with more non-native trees were lower. Full statistical details are available in Supplementary Data 1. Regression lines (95% CI in shaded polygons) indicate the marginal predictions of linear mixed-effects models. Dashed horizontal lines mark null with negative values indicating sites with declining and positive values sites with increasing community responses over time.
Fig. 3
Fig. 3. Results for site-level correlations of the total insect community and further environmental variables.
Site-level correlations (each shown as partial residuals of Pearson’s r between year and the respective community response) for species richness were related to a change in deadwood volume, b change in the proportion of non-native trees, c change in canopy openness, and d PC1 of landscape heterogeneity. For species abundance, site-level correlations were related to e tree diversity, f the effective number of layers, and g change in canopy openness. Site-level correlations for biomass were related to h the change in the proportion of non-native trees. For explanations of variables see Supplementary Table 1. Full statistical details are available in Supplementary Data 1. Regression lines (95% CI in shaded polygons) indicate the marginal predictions of linear mixed-effects models. Dashed horizontal lines mark null with negative values indicating sites with declining and positive values sites with increasing community responses over time. Note that the x-axes in a, b, c, g and h are on a symmetric square-root scale.
Fig. 4
Fig. 4. Results for site-level correlations and harvesting intensity.
Harvesting intensity before the start of insect sampling was related to site-level correlations (each shown as partial residuals of Pearson’s r between year and the respective community response) in insect populations, with sites characterized by higher harvesting having more negative (or less positive) correlations in a total insect abundance. The relationship with harvesting intensity prevailed across trophic groups as indicated for b herbivore abundance, c omnivore species richness, and d omnivore abundance. Note that even for b herbivores, which had positive correlations with time, abundance correlations on sites with more harvesting were lower. Full statistical details are available in Supplementary Data 1. Regression lines (95% CI in shaded polygons) indicate the marginal predictions of linear mixed-effects models. Dashed horizontal lines mark null with negative values indicating sites with declining and positive values sites with increasing community responses over time.
Fig. 5
Fig. 5. Results for species-level correlations and traits.
Species-level correlations decline with a body size and b total incidence of each species per region. Correlations (shown as partial residuals of Pearson’s r between year and the number of individuals per species in a region, excluding single occurrences) varied among c trophic groups, with the majority of the species in all groups except herbivores having negative values on average. Numbers in c indicate species*region combination for each trophic group (center lines in boxplots specify the median, boxes cover the range between the lower and upper quartile, whiskers extend to 1.5x interquartile range). Statistical details are given in Supplementary Tables 3 and 4. Regression lines (95% CI in shaded polygons) indicate the marginal predictions of a linear mixed-effects model. Dashed horizontal lines mark null with negative values indicating species with declining and positive values species with increasing individual numbers over time.

References

    1. Dirzo R, et al. Defaunation in the Anthropocene. Science. 2014;345:401–406. doi: 10.1126/science.1251817. - DOI - PubMed
    1. Leather SR. "Ecological Armageddon"—more evidence for the drastic decline in insect numbers. Ann. Appl. Biol. 2018;172:1–3. doi: 10.1111/aab.12410. - DOI
    1. Wagner DL, Grames EM, Forister ML, Berenbaum MR, Stopak D. Insect decline in the Anthropocene: death by a thousand cuts. Proc. Natl Acad. Sci. USA. 2021;118:e2023989118. doi: 10.1073/pnas.2023989118. - DOI - PMC - PubMed
    1. van Klink R, et al. Meta-analysis reveals declines in terrestrial but increases in freshwater insect abundances. Science. 2020;368:417–420. doi: 10.1126/science.aax9931. - DOI - PubMed
    1. Wagner DL, Fox R, Salcido DM, Dyer LA. A window to the world of global insect declines: moth biodiversity trends are complex and heterogeneous. Proc. Natl Acad. Sci. USA. 2021;118:e2002549117. doi: 10.1073/pnas.2002549117. - DOI - PMC - PubMed

Publication types