. 2023 Jul;72(7):2459-2471.
doi: 10.1007/s00262-023-03433-3. Epub 2023 Apr 5.

Factors impacting the efficacy of the in-situ vaccine with CpG and OX40 agonist

Affiliations

Factors impacting the efficacy of the in-situ vaccine with CpG and OX40 agonist

Alexander A Pieper et al. Cancer Immunol Immunother. 2023 Jul.

Abstract

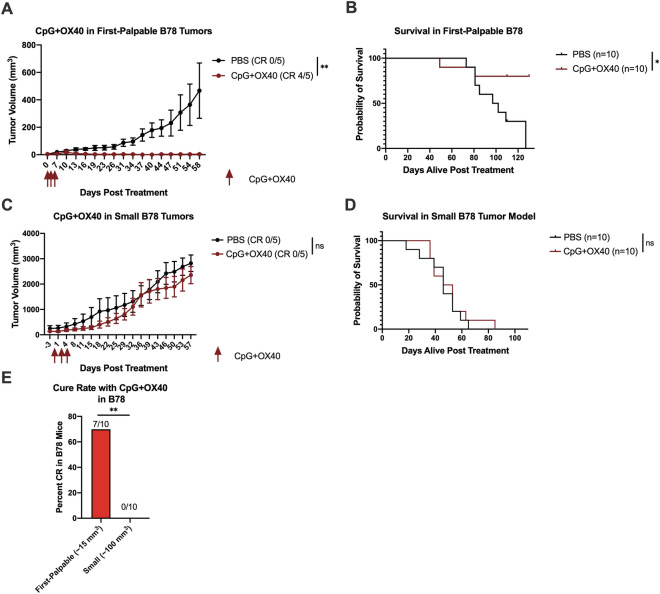
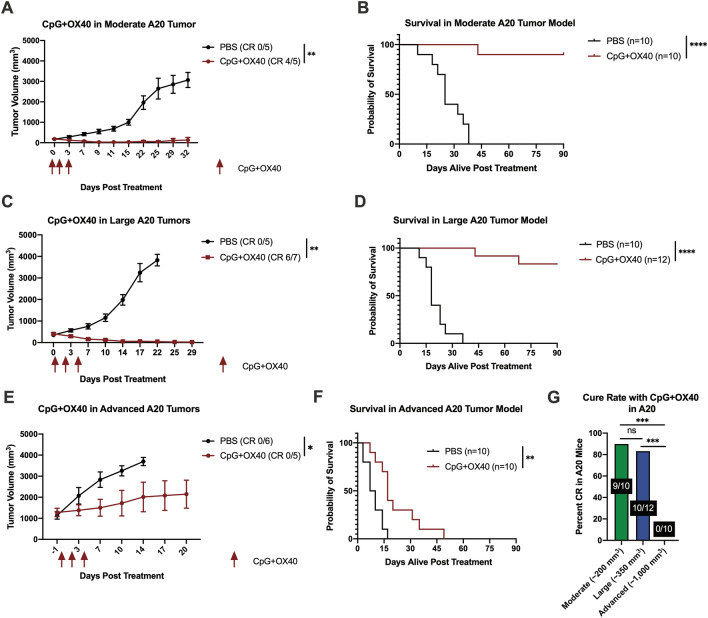
Background: The in-situ vaccine using CpG oligodeoxynucleotide combined with OX40 agonist antibody (CpG + OX40) has been shown to be an effective therapy activating an anti-tumor T cell response in certain settings. The roles of tumor volume, tumor model, and the addition of checkpoint blockade in the efficacy of CpG + OX40 in-situ vaccination remains unknown.

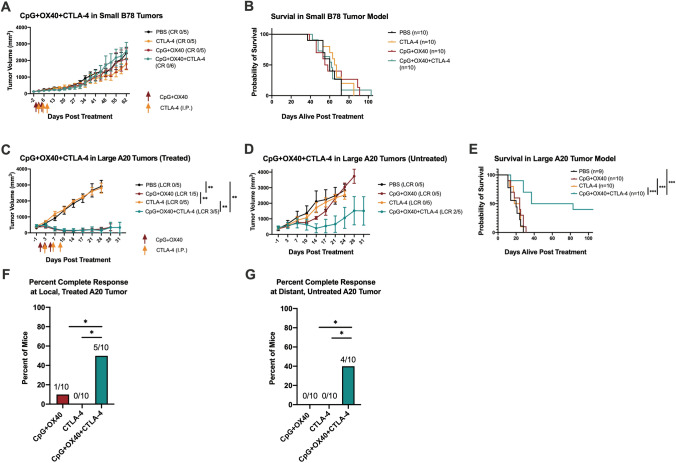
Methods: Mice bearing flank tumors (B78 melanoma or A20 lymphoma) were treated with combinations of CpG, OX40, and anti-CTLA-4. Tumor growth and survival were monitored. In vivo T cell depletion, tumor cell phenotype, and tumor infiltrating lymphocyte (TIL) studies were performed. Tumor cell sensitivity to CpG and macrophages were evaluated in vitro.

Results: As tumor volumes increased in the B78 (one-tumor) and A20 (one-tumor or two-tumor) models, the anti-tumor efficacy of the in-situ vaccine decreased. In vitro, CpG had a direct effect on A20 proliferation and phenotype and an indirect effect on B78 proliferation via macrophage activation. As A20 tumors progressed in vivo, tumor cell phenotype changed, and T cells became more involved in the local CpG + OX40 mediated anti-tumor response. In mice with larger tumors that were poorly responsive to CpG + OX40, the addition of anti-CTLA-4 enhanced the anti-tumor efficacy in the A20 but not B78 models.

Conclusions: Increased tumor volume negatively impacts the anti-tumor capability of CpG + OX40 in-situ vaccine. The addition of checkpoint blockade augmented the efficacy of CpG + OX40 in the A20 but not B78 model. These results highlight the importance of considering multiple preclinical model conditions when assessing the efficacy of cancer immunotherapy regimens and their translation to clinical testing.

Keywords: Anti-CTLA-4; CpG; In-situ vaccine; OX40 agonist; Preclinical tumor progression.


Conflict of interest statement

ZSM is a member of the scientific advisory board for Archeus Technologies and Seneca Therapeutics and received equity options for these companies. ZSM is an inventor on patents or filed patents managed by the Wisconsin Alumni Research Foundation relating to the interaction of targeted radionuclide therapies and immunotherapies, nanoparticles designed to augment the anti-tumor immune response following radiation therapy, and the development of a brachytherapy catheter capable of delivering intra-tumor injectables. PMS is an inventor on patents or filed patents managed by the Wisconsin Alumni Research Foundation relating to mAb-related immunotherapies and the interaction of targeted radionuclide therapies and immunotherapies.

Figures

Fig. 1
Fig. 1
CpG + OX40 in-situ vaccine cures mice of first-palpable (~ 15 mm3) B78 tumors but fails to slow tumor progression of small (~ 100 mm3) B78 Tumors. a Average tumor volume (± SEM) from a representative experiment and b combined overall survival from two independent experiments showing responses to PBS (black) or CpG + OX40 (red) in the first-palpable (~ 15 mm3) B78 tumor model. c Average tumor volume (± SEM) from a representative experiment and d the combined overall survival from two independent experiments showing responses to PBS (black) or CpG + OX40 (red) in the small (~ 100 mm3) B78 model. The number of mice demonstrating a complete response (CR) in a and c is shown in parentheses. e The percent of mice bearing first-palpable or small B78 tumors that were cured with CpG + OX40 treatment. P values for tumor volume plots were calculated using time-weighted average analysis. P values for overall survival were calculated via log rank test. P value for cure rate calculated via chi-square test. *P ≤ 0.05; **P ≤ 0.01; ns, not significant
Fig. 2
Fig. 2
Decreased Curative Effect of CpG + OX40 In-situ Vaccine in A20 Model as Tumor Burden Increases. a, c, e Average tumor volume (± SEM) from a representative experiment and b, d, f combined overall survival from two independent experiments of mice bearing a a, b moderate (~ 200 mm3), c, d large (~ 350 mm3), e, f or advanced (~ 1000 mm3) A20 flank tumor treated with PBS (black) or CpG + OX40 (red). The number of mice cured (CR), based on showing a complete response and remaining tumor-free to day 90, of their tumor in a, c, and e is shown in parentheses. g The percent of mice bearing a single moderate (green), large (blue), or advanced (purple) A20 tumor that were cured with CpG + OX40 treatment. P values for tumor volume plots were calculated using time-weighted average analysis. P values for overall survival were calculated via log rank test. P value for cure rate calculated via chi-square tests. *P ≤ 0.05; **P ≤ 0.01; ***P ≤ 0.001; ****P ≤ 0.0001; ns, not significant
Fig. 3
Fig. 3
In Vivo Tumor Phenotypic Changes with Tumor Progression and Intratumoral CpG. Average (± SEM) median fluorescent intensity (MFI) of a MHC-I and MHC-II, b CD80, and c CD86 on CD19 + cells (e.g. A20 tumor cells) in small (~ 150 mm3) untreated (red), large (500 mm3) untreated (blue), and large (500 mm3) CpG treated (green) A20 tumors. Large CpG treated tumors were injected once, intratumorally, with 50 μg of CpG and all three tumor groups were harvested together, 48 h after CpG injection. P values calculated via one-way ANOVA analysis with Tukey’s multiple comparison correction. *P ≤ 0.05; **P ≤ 0.01; ***P ≤ 0.001; ****P ≤ 0.0001; ns, not significant
Fig. 4
Fig. 4
Systemic in-situ vaccination strength decreases with increased systemic A20 tumor burden. Balb/c mice bearing 2 separate A20 tumors [(a–c) small (~ 100 mm3), (d–f) moderate (~ 200 mm3), and (g–i) large (~ 350 mm3) were treated with PBS (black) or CpG + OX40 (red). Average tumor volume (± SEM) are shown for the treated tumor (a, d, g), and the distant untreated tumor (b, e, h). The combined overall survival for each group is shown (c, f, i), using data pooled from at least 2 experiments. The number of mice demonstrating a local complete response (LCR) at the treated tumor or LCR specifically at the distant untreated tumor are shown in parentheses in (a, d, g) and (b, e, h), respectively. The percent of mice from combined experiments bearing small (red), moderate (green), or large (blue) tumors that demonstrated a LCR to CpG + OX40 at the (j) local, treated tumor and (k) distant, untreated tumor. P values for tumor volume plots were calculated using time-weighted average analysis. P values for overall survival were calculated via log rank test. P values for complete response data calculated via chi-square tests. *P ≤ 0.05; **P ≤ 0.01; ***P ≤ 0.001; ****P ≤ 0.0001; ns, not significant. All comparisons that are not shown with a *, **, *** or **** are not significantly different from each other
Fig. 5
Fig. 5
Differing requirements of T cells for local anti-tumor response in small and large two-tumor A20 models. Representative average tumor volume (± SEM) of the a, d local, treated tumor, b, e distant, untreated tumor, and c, f combined overall survival from two independent experiments of mice treated with PBS (black), CpG + OX40 + Rat IgG (red), or CpG + OX40 + CD4 depletion + CD8 depletion (blue) in the (a–c) small (~ 100 mm3) and (d–f) large (~ 350 mm3) two-tumor A20 models. The number of mice demonstrating a local complete response (LCR) at the treated tumor or distant untreated tumor are shown in parentheses in (a, d) and (b, e), respectively. P values for tumor volume plots were calculated using time-weighted average analysis. P values for overall survival were calculated via log rank test. *P ≤ 0.05; **P ≤ 0.01; ***P ≤ 0.001; ****P ≤ 0.0001. All comparisons that are not shown with an *, **, *** or **** are not significantly different from each other
Fig. 6
Fig. 6
Anti-CTLA-4 enhances the anti-tumor response of CpG + OX40 in the poorly responsive A20 but not B78 tumor models. a Average tumor volume (± SEM) from a representative experiment and b combined overall survival from two independent experiments in C57BL/6 mice bearing a single small (~ 100 mm3) B78 flank tumor treated with PBS (black), anti-CTLA-4 (yellow), CpG + OX40 (red), or CpG + OX40 + anti-CTLA-4 (teal). c Average tumor volume (± SEM) plot of the local, treated tumor and d distant, untreated tumor from a representative experiment, and e combined overall survival from two independent experiments of Balb/c mice treated with PBS (black), anti-CTLA-4 (yellow), CpG + OX40 (red), or CpG + OX40 + anti-CTLA-4 (teal) in mice bearing two separate large (~ 350 mm3) A20 tumors. [Note in Fig. 6C, the data for CpG + OX40 + anti-CTLA-4 (teal) are superimposed on the data for CpG + OX40 (red), making it hard to view]. The number of mice demonstrating a local complete response (LCR) at the treated tumor or distant untreated tumor are shown in parentheses in (a, c) and (d), respectively. Percent of Balb/c mice treated with CpG + OX40 (red), anti-CTLA-4 (yellow), or CpG + OX40 + anti-CTLA-4 (teal) cured of their local, treated A20 tumor (f) and distant, untreated A20 tumor (g). P values for tumor volume plots were calculated using time-weighted average analysis. P values for overall survival were calculated via log rank test. P values for CR comparison calculated via chi-square tests. *P ≤ 0.05; **P ≤ 0.01; ***, P ≤ 0.001. All comparisons that are not shown with an *, **, or *** are not significantly different from each other

References

    1. Chardin D, Paquet M, Schiappa R et al (2020) Baseline metabolic tumor volume as a strong predictive and prognostic biomarker in patients with non-small cell lung cancer treated with PD1 inhibitors: a prospective study. J Immunother Cancer 8(2). - PMC - PubMed
    1. Joseph RW, Elassaiss-Schaap J, Kefford R, et al. Baseline tumor size is an independent prognostic factor for overall survival in patients with melanoma treated with pembrolizumab. Clin Cancer Res. 2018;24(20):4960–4967. doi: 10.1158/1078-0432.CCR-17-2386. - DOI - PMC - PubMed
    1. Katsurada M, Nagano T, Tachihara M, et al. Baseline tumor size as a predictive and prognostic factor of immune checkpoint inhibitor therapy for non-small cell lung cancer. Anticancer Res. 2019;39(2):815–825. doi: 10.21873/anticanres.13180. - DOI - PubMed
    1. Guisier F, Cousse S, Jeanvoine M, et al. A rationale for surgical debulking to improve anti-PD1 therapy outcome in non small cell lung cancer. Sci Rep. 2019;9(1):16902. doi: 10.1038/s41598-019-52913-z. - DOI - PMC - PubMed
    1. Nesseler JP, Lee MH, Nguyen C et al (2020) Tumor size matters-understanding concomitant tumor immunity in the context of hypofractionated radiotherapy with immunotherapy. Cancers (Basel) 12(3). - PMC - PubMed