

Spatial distribution and determinants of stunting, wasting and underweight in children under-five in Ethiopia
- PMID: 37016328
- PMCID: PMC10071774
- DOI: 10.1186/s12889-023-15488-z
Spatial distribution and determinants of stunting, wasting and underweight in children under-five in Ethiopia
Abstract
Background: The burden of malnutrition in children under five remains an important child health issue where significant regional variations are observed in Ethiopia. The main aim of the current study was to explore the spatial distribution of stunting, wasting, and underweight in children under five in Ethiopia.
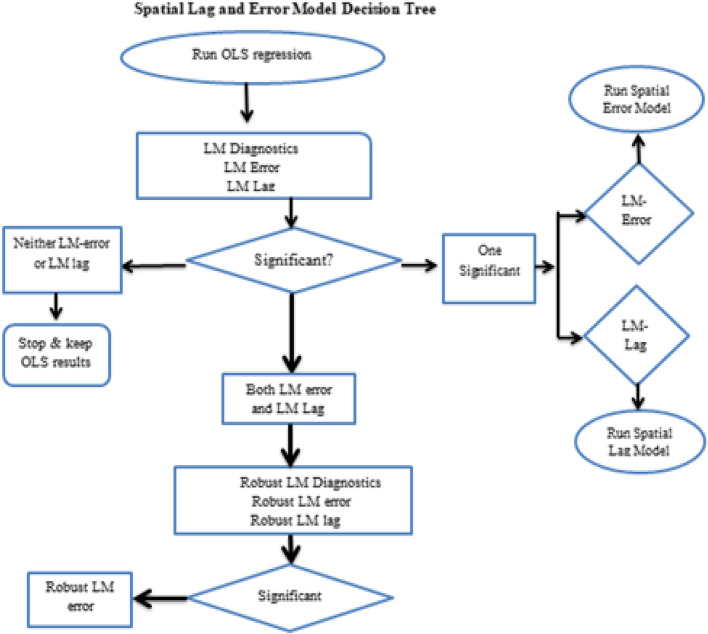
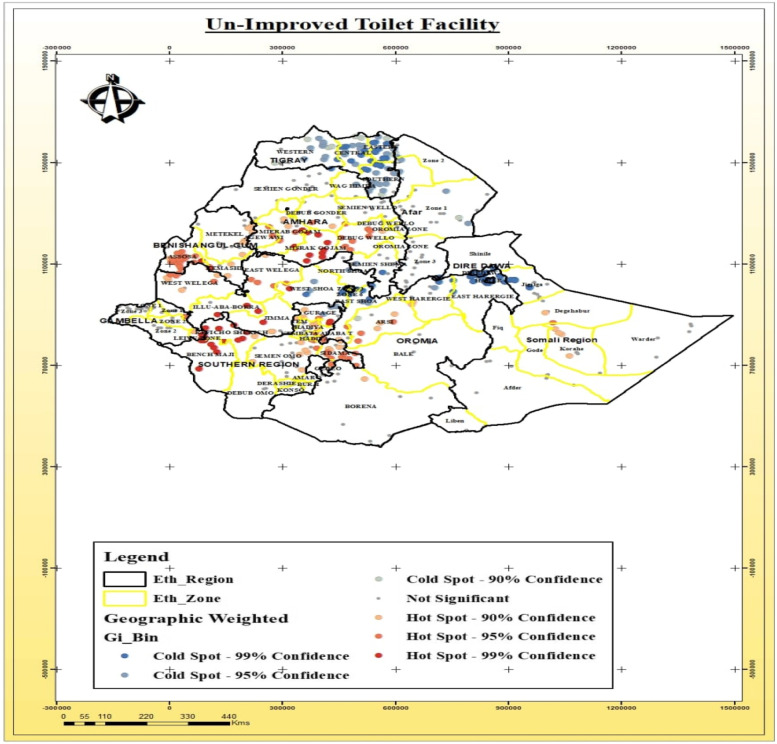
Methods: The secondary data from EDHS, 2016, was employed, and a total of 7960 under-five children were included in the analysis. The general spatial analysis was performed to explore the spatial distribution of malnutrition among under-five within and between the regions of Ethiopia. The Spatial Lag and Spatial Error models were used to examine the spatial dependence between stunting, wasting, and being underweight. The Geographically weighted regression analysis was performed to estimate the types and strength of relationships between malnutrition and associated determinant factors across the regions and within the clusters or Zones of each region.
Results: Among the under-five children included in the study, 36.6% were stunted, 12.2% were wasted and 25.2% were underweight. The Global Moran Index's value indicates (Stunting, I = 0.3135, p-value < 0.00001, Wasting, I = 0.1948, p-value < 0.0001 and Underweight, I = 0.5291, p-value < 0.0001) that there was a significant spatial variation of malnutrition across the regions and Zones of Ethiopia. The significant source of spatial variation of malnutrition in children under five was associated with the mother's education level, drinking water facility, toilet facilities, number of children under-five in the household, household's wealth index, breastfeeding duration of the child, child size at birth, Body Mass Index of Mothers (BMI), region, and place of residence.
Conclusions: The spatial association and spatial patterns of stunting, wasting, and being underweight were clustered within and between the regions of Ethiopia. The hotspot areas of stunting, wasting, and being underweight were detected in the regions where there were poor health facilities and limited socioeconomic indicators.
Keywords: Ethiopia; Malnutrition; Spatial analysis; Under-five children.
© 2023. The Author(s).
Conflict of interest statement
The authors declare no competing interests.
Figures


References
-
- Tibilla MA. The nutritional impact of the world food programme supported supplementary feeding programme on children less than five years in rural tamale. Ghana: International Household Survey Network; 2016.
-
- World Health Organization . Child Growth Standards: Length/Height for Age, Weight for Age, Weight for Height and Body Mass Index for Age: Methods and Development. Geneva: Switzerland; 2006.
-
- Black RE, Victora CG, Walker SP, Bhutta ZA, Christian P. de Onis M, Ezzati M, Grantham-McGregor S, Katz J, Martorell R, Uauy R. Review Maternal and child under-nutrition and overweight in low-income and middle-income countries. Maternal and Child Nutrition Study Group. Lancet 2013. - PubMed
-
- De Onis M, Brown D, Blossner M, Borghi E. Levels and Trends in Child Malnutrition. UNICEF-WHO-The World Bank Joint Child Malnutrition EstimatesLevels and Trends in Child Malnutrition. New York, NY, USA: UNICEF; 2018.
-
- World Health Organization . Annual report 2019 WHO Country Office Lebanon. Health for all. 2019.
MeSH terms
LinkOut - more resources
Full Text Sources
Medical
