

Levels, trends, and determinants of cause-of-death diversity in a global perspective: 1990-2019
- PMID: 37016370
- PMCID: PMC10072917
- DOI: 10.1186/s12889-023-15502-4
Levels, trends, and determinants of cause-of-death diversity in a global perspective: 1990-2019
Abstract
Background: While much is known about the leading causes of death (CoD) and how they have evolved over time, much less is known about the diversity of such causes of death. CoD diversity is an important marker of population health heterogeneity that has been largely overlooked in the study of contemporary health dynamics.
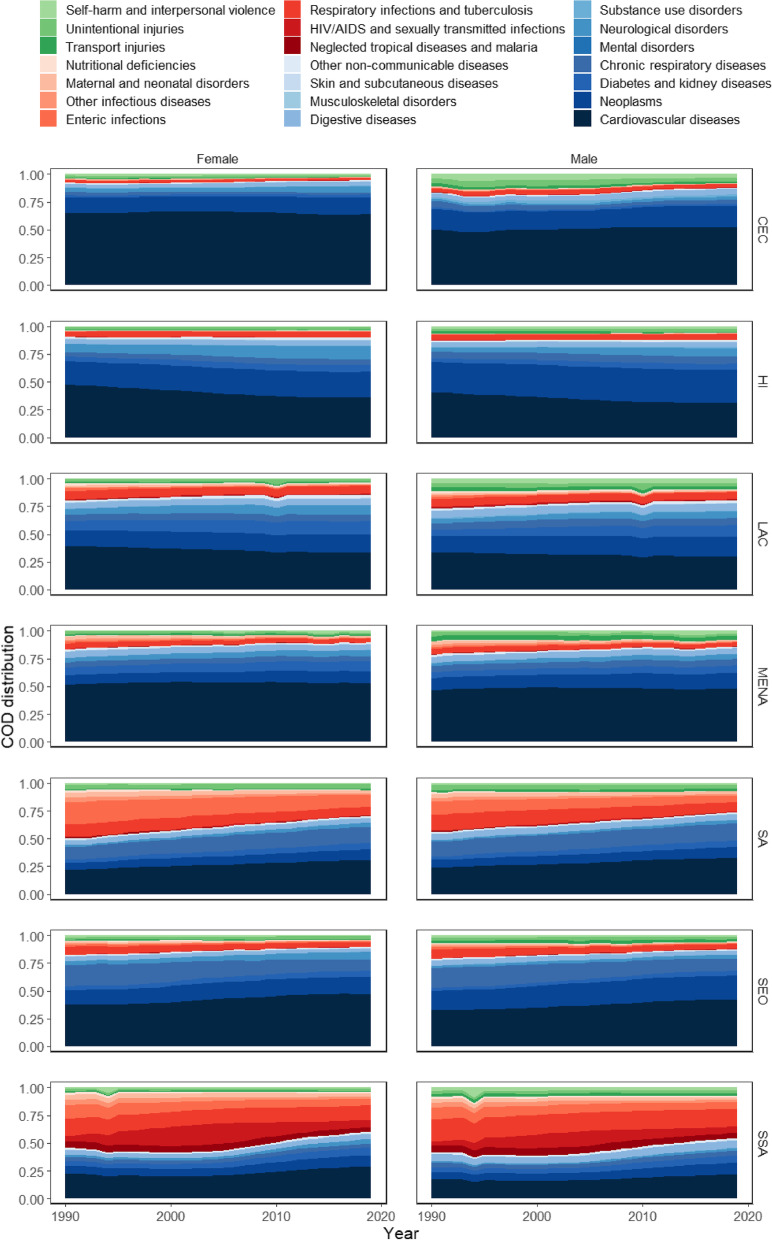
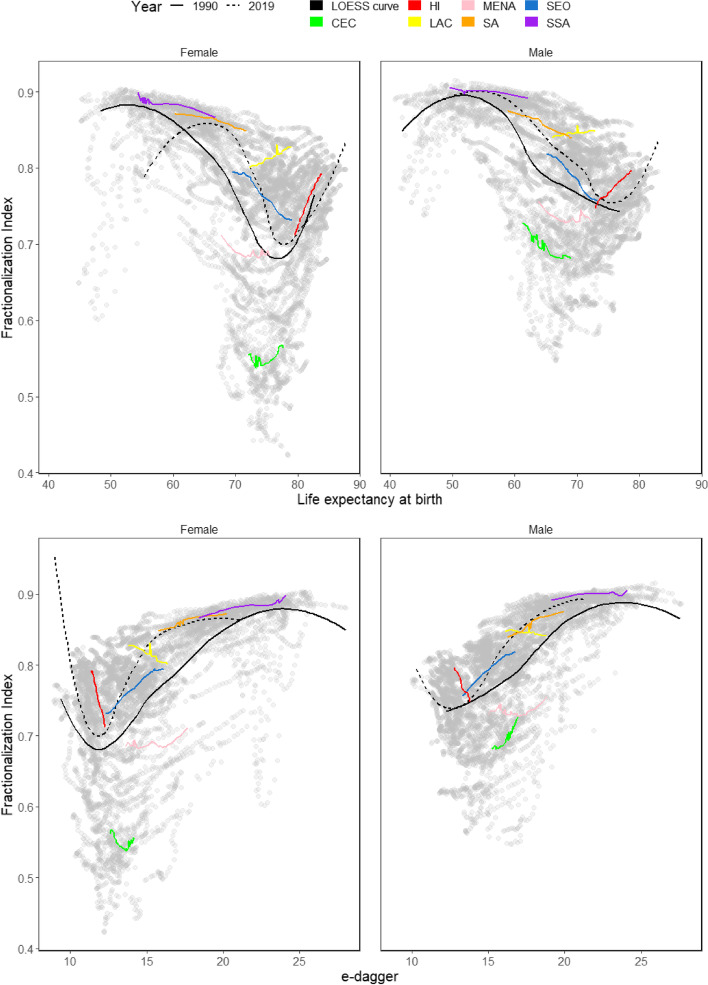
Methods: We provide regional and national estimates of CoD diversity from 1990 to 2019. We rely on data from the Global Burden of Disease project, using information on 21 CoD. Results are presented for 204 countries and territories, for women and men separately. CoD diversity is measured with the index of Fractionalization. Results are disaggregated by age and cause of death.
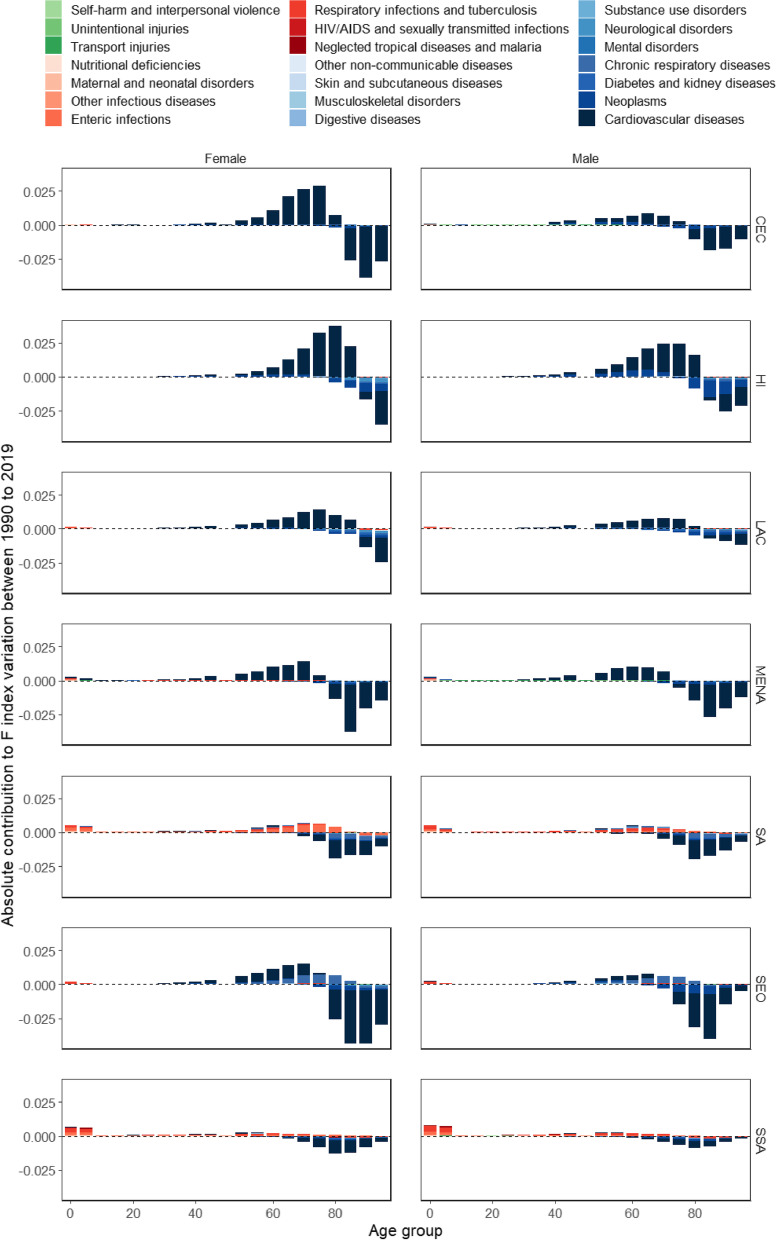
Results: CoD diversity has declined across world regions, except for Latin America and the Caribbean, the region of High-income countries and women in Central Europe, Eastern Europe, and Central Asia. Changes in mortality at adult and older ages have been mostly responsible for CoD diversity dynamics, except for the regions of South Asia and Sub-Saharan Africa, where infant and child mortality still play a non-negligible role. The relationship between CoD diversity, life expectancy, and lifespan inequality is strongly non-monotonic, with turning points differing by sex and indicator. Among longevity vanguard countries, further increases in life expectancy are associated with decreasing lifespan inequality but increasing CoD diversity.
Conclusion: As mortality declines, there is no universal pathway toward low CoD diversity, thus casting doubts on the ability of Epidemiological Transition Theory to predict prospective CoD dynamics among high- and middle-mortality countries. Despite the postponement and increasing predictability of the ages at which individuals die, low-mortality populations are composed of an increasingly heterogenous mix of robust and frail individuals, thus increasing the diversity of health profiles among older persons - an issue that could potentially complicate further improvements in longevity.
Keywords: Ageing; Cause of death diversity; Fractionalization index; Health inequality; Mortality.
© 2023. The Author(s).
Conflict of interest statement
The authors declare no competing interests.
Figures
References
-
- Riley JC. Estimates of regional and global life expectancy, 1800–2001. Popul Dev Rev. 2005;31(3):537–43. doi: 10.1111/j.1728-4457.2005.00083.x. - DOI
Publication types
MeSH terms
LinkOut - more resources
Full Text Sources
Research Materials
