. 2023 Jul 5;31(7):2240-2256.
doi: 10.1016/j.ymthe.2023.03.028. Epub 2023 Apr 4.

The unfolded protein response transcription factor XBP1s ameliorates Alzheimer's disease by improving synaptic function and proteostasis

Affiliations

The unfolded protein response transcription factor XBP1s ameliorates Alzheimer's disease by improving synaptic function and proteostasis

Claudia Duran-Aniotz et al. Mol Ther. .

Abstract

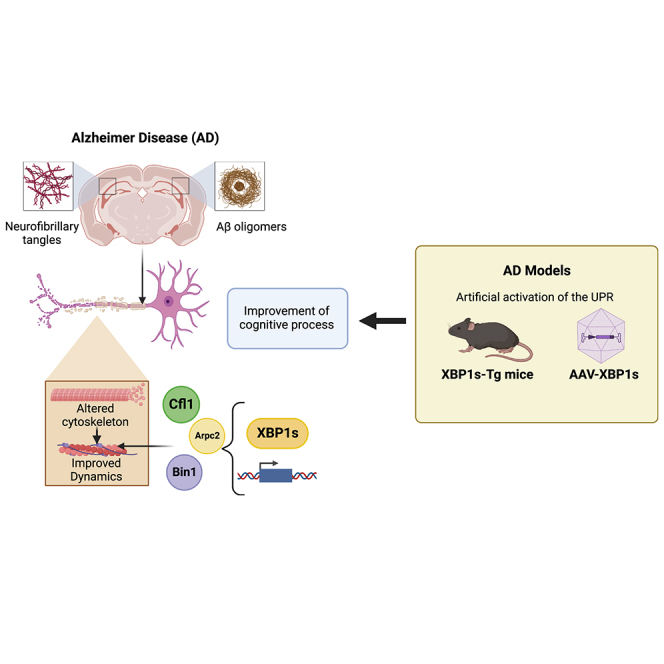
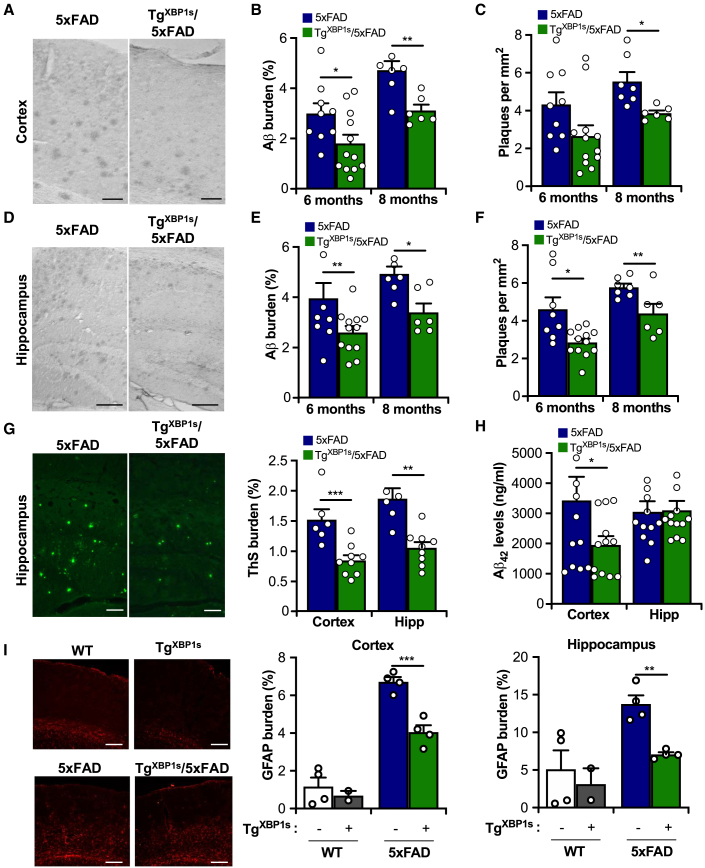
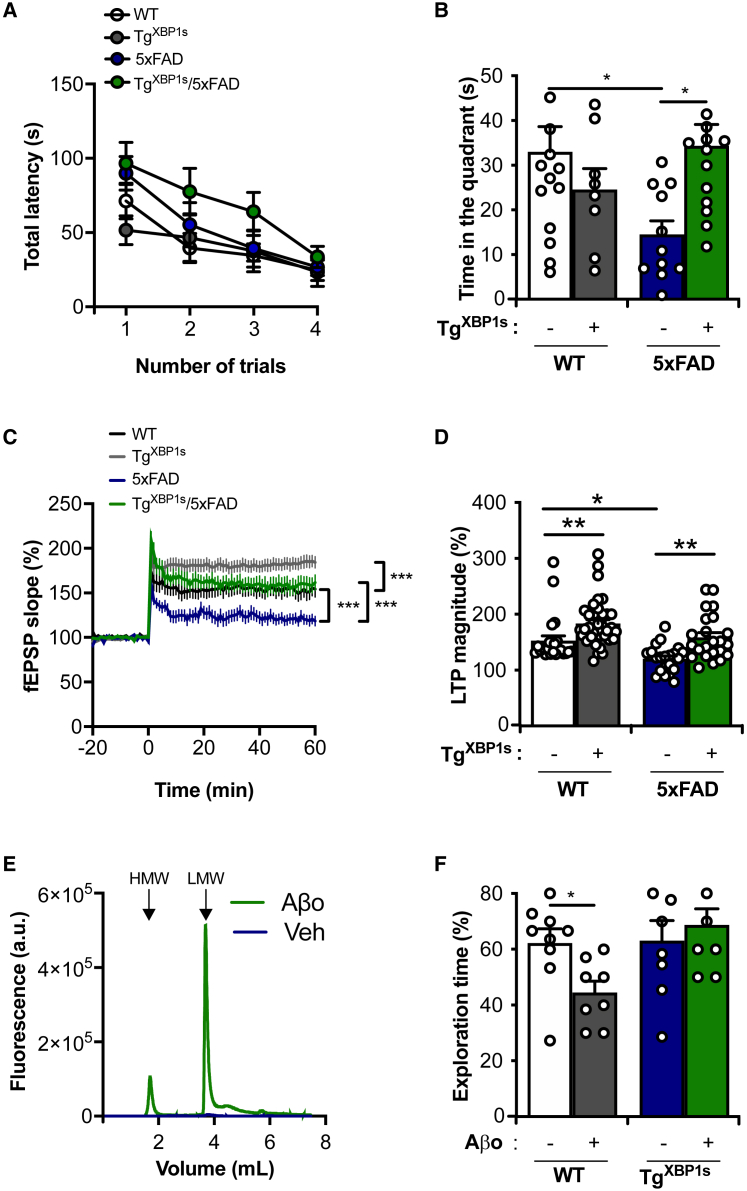
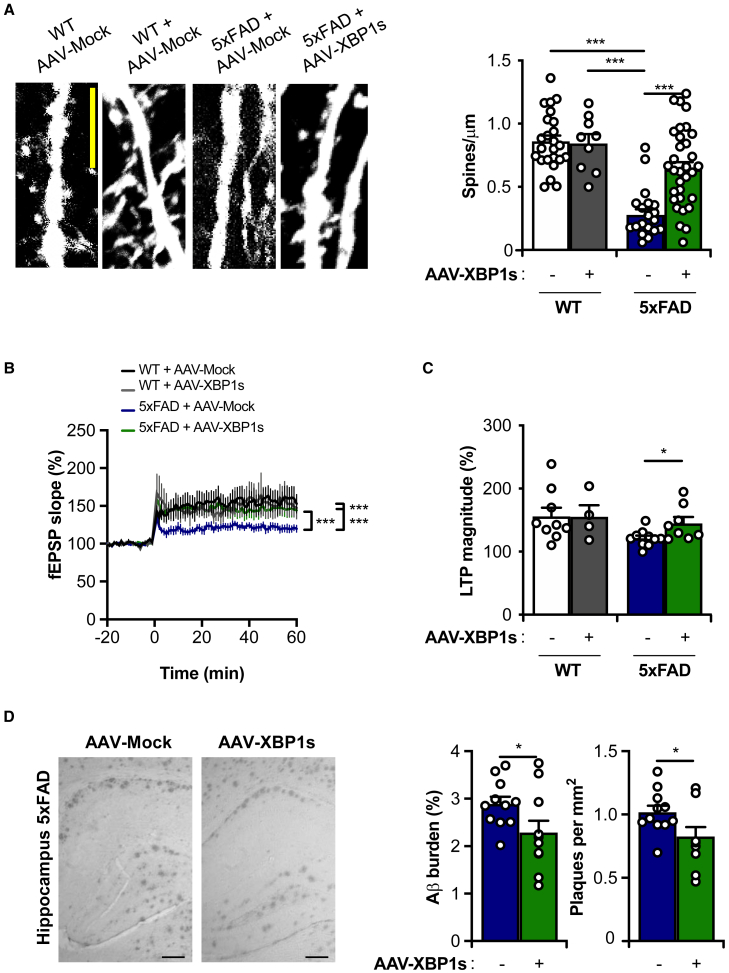
Alteration in the buffering capacity of the proteostasis network is an emerging feature of Alzheimer's disease (AD), highlighting the occurrence of endoplasmic reticulum (ER) stress. The unfolded protein response (UPR) is the main adaptive pathway to cope with protein folding stress at the ER. Inositol-requiring enzyme-1 (IRE1) operates as a central ER stress sensor, enabling the establishment of adaptive and repair programs through the control of the expression of the transcription factor X-box binding protein 1 (XBP1). To artificially enforce the adaptive capacity of the UPR in the AD brain, we developed strategies to express the active form of XBP1 in the brain. Overexpression of XBP1 in the nervous system using transgenic mice reduced the load of amyloid deposits and preserved synaptic and cognitive function. Moreover, local delivery of XBP1 into the hippocampus of an 5xFAD mice using adeno-associated vectors improved different AD features. XBP1 expression corrected a large proportion of the proteomic alterations observed in the AD model, restoring the levels of several synaptic proteins and factors involved in actin cytoskeleton regulation and axonal growth. Our results illustrate the therapeutic potential of targeting UPR-dependent gene expression programs as a strategy to ameliorate AD features and sustain synaptic function.

Keywords: Alzheimer’s disease; ER stress; UPR; XBP1; amyloid β.


Conflict of interest statement

Declaration of interests The authors declare that no conflicts of interest exist.

Figures

None
Graphical abstract
Figure 1
Figure 1
Overexpression of XBP1s in the nervous system reduces amyloid β levels TgXBP1s were crossed with 5xFAD mice, and histopathological and biochemical analyses were performed in brain. Representative images of amyloid β (Αβ) deposits in cortical (A) and hippocampal (D) areas of 6-month-old 5xFAD and TgXBP1s/5xFAD animals. Scale bar: 100 μm. The burden of amyloid deposits and the number of deposits per square millimeter were quantified in serial brain slices (10 sections/stain/animal) of the cortex (B and E) and hippocampus (C and F) of 5xFAD and TgXBP1s/5xFAD mice at 6 and 8 months of age, respectively. (G) Representative images of fibrillar amyloid β deposits using thioflavin S (ThS) staining. ThS was quantified in cortical and hippocampal areas of 5xFAD and TgXBP1s/5xFAD animals at 8 months of age. Scale bar: 100 μm. (H) Insoluble Aβ42 levels were quantified in cortical and hippocampal homogenates after a serial extraction protocol (see materials and methods) followed by detection using human-specific ELISA. (I) Representative images and quantification of immunofluorescence of GFAP in cortical and hippocampal areas of 5xFAD and TgXBP1s/5xFAD animals. Scale bar: 100 μm. Values are expressed as mean ± SEM. 5xFAD (n = 4–10) and TgXBP1s/5xFAD (n = 4–8) animals. Quantification of immunofluorescence of GFAP in cortical (left panel) and hippocampal (right panel) areas of 5xFAD and TgXBP1s/5xFAD animals. Data were analyzed using Student’s t test. ∗p < 0.05, ∗∗p < 0.01, and ∗∗∗p < 0.001.
Figure 2
Figure 2
XBP1s overexpression in the nervous system attenuates cognitive deficits and synaptic alterations of 5xFAD mice WT (n = 15), TgXBP1s (n = 8), 5xFAD (n = 14), and TgXBP1s/5xFAD (n = 14) mice were analyzed using the Barnes maze behavioral test at 8 months of age. Learning performance was measured as total latency during the training phase (A), and the time in the correct quadrant at the test day was evaluated (B). The excitatory synaptic transmission was analyzed using long-term potentiation (LTP) in hippocampal slices from animals presented in (A). (C) Input-output relationship between fEPSP slope and fiber volley amplitude was monitored (n = 20–40 slices from 4 or 5 animals per group). (D) Representative traces of the field excitatory postsynaptic potentials (fEPSPs) magnitude of hippocampal LTP induced by theta-burst stimulation (TBS) protocol is shown (n = 17–36 slices from 4–6 animals per group). (E) In vitro generated amyloid β oligomers (Aβo) were analyzed using size exclusion chromatography to assess oligomerization state and measure low-molecular weight (LMW) and high-molecular weight (HMW) species. (F) Percentage of exploration time of the novel object in the NOR test was measured on day 7 after i.c.v. injection of amyloid β oligomers (Aβo) in 3-month-old TgXBP1s and WT mice. Data values are expressed as mean ± SEM. Data from (A) and (C) were analyzed using two-way ANOVA followed by Tukey’s multiple-comparison post-test. Data from (B), (D), and (E) were analyzed using one-way ANOVA followed by Tukey’s multiple-comparison post-test. ∗p < 0.05 and ∗∗p < 0.01.
Figure 3
Figure 3
Therapeutic effects of AAV-XBP1s administration into the hippocampus of AD mice WT and 5xFAD mice were injected with either AAV-XBP1s or AAV-Mock at 1.5 months of age and sacrificed after 8–9 months. Learning curves using the Morris water maze (A) and Barnes maze (BM) (B) behavioral tests were measured. Long-term memory was measured at 12 days post-training of BM paradigm (C). Percentage of alternation of behavioral paradigm Y maze (D). Data values are expressed as mean ± SEM. WTAVV-Mock (n = 7–10), WTAVV-XBP1s (n = 7–10), 5xFADAVV-Mock (n = 7–10), and 5xFADAVV-XBP1s (n = 7–10). Data from (C) and (D) were analyzed using one-way ANOVA followed by Tukey’s multiple-comparison post-test. Data from (A) and (B) were analyzed using two-way ANOVA followed by Tukey’s multiple-comparison post-test. ∗p < 0.05, ∗∗p < 0.01, and ∗∗∗p < 0.001.
Figure 4
Figure 4
AAV-XBP1s administration into the hippocampus of 5xFAD mice improves synaptic function (A) Dendritic spine density of pyramidal neurons in the CA1 region was measured in indicated experimental groups. Left panel: representative images of dendritic spines, and the quantification (right panel). Scale bar: 100 μm. (B) Time course of the TBS-induced LTP in slices prepared from all experimental groups and (C) quantification of LTP using hippocampal slices. (D) Representative images of amyloid deposits in the hippocampus (left panel), and quantification of amyloid β load, and the number of plaques of injected animals (right panel). Scale bar: 100 μm. Data values are expressed as mean ± SEM. WTAVV-Mock (n = 7–10), WTAVV-XBP1s (n = 7–10), 5xFADAVV-Mock (n = 7–10), and 5xFADAVV-XBP1s (n = 7–10). Data were analyzed using one-way ANOVA followed by Tukey’s multiple-comparison post-test. Data from (B) were analyzed using two-way ANOVA followed by Tukey’s multiple-comparison post-test. ∗p < 0.05 and ∗∗∗p < 0.001.
Figure 5
Figure 5
Comparative proteomics analysis of hippocampal tissue of AD mice overexpressing XBP1s (A) The significance score in the heatmap represents a combination of the statistical significance and the direction of change (see materials and methods). The values at the top represent Spearman’s correlation coefficient between the groups. (B) Overlap of the biological processes regulated in opposite directions in WT vs. 5xFAD and 5xFAD vs. TgXBP1s/5xFAD mice. Top 10 enriched overlapping processes are displayed in the dashed boxes. p values at the bottom represent the statistical significance of the overlap. (C) Cfl1 western blot (upper panel) and the respective quantification of hippocampal lysate (lower panel) from WT, TgXBP1s, 5xFAD, and TgXBP1s/5xFAD mice, using α-tubulin as a housekeeping control. (D) Proteomic changes in the hippocampus of Alzheimer’s disease patients and humans at different ages for the top proteins restored by XBP1s overexpression. At the top, we show the mean fold changes for the candidate proteins in each comparison group. In parentheses, we indicate the number of proteins measured in each dataset. The dot plot below displays the quantile normalized fold change values of the proteins in each dataset (dot color). p values at the bottom indicate the statistical significance from a t test with population mean equal zero.

Comment in

References

    1. Ballard C., Gauthier S., Corbett A., Brayne C., Aarsland D., Jones E. Alzheimer's disease. Lancet. 2011;377:1019–1031. doi: 10.1016/S0140-6736(10)61349-9. - DOI - PubMed
    1. Querfurth H.W., LaFerla F.M. Alzheimer's disease. N. Engl. J. Med. 2010;362:329–344. doi: 10.1056/NEJMra0909142. - DOI - PubMed
    1. Serrano-Pozo A., Frosch M.P., Masliah E., Hyman B.T. Neuropathological alterations in Alzheimer disease. Cold Spring Harb. Perspect. Med. 2011;1:a006189. doi: 10.1101/cshperspect.a006189. - DOI - PMC - PubMed
    1. Balch W.E., Morimoto R.I., Dillin A., Kelly J.W. Adapting proteostasis for disease intervention. Science. 2008;319:916–919. doi: 10.1126/science.1141448. - DOI - PubMed
    1. Kennedy B.K., Berger S.L., Brunet A., Campisi J., Cuervo A.M., Epel E.S., Franceschi C., Lithgow G.J., Morimoto R.I., Pessin J.E., et al. Geroscience: linking aging to chronic disease. Cell. 2014;159:709–713. doi: 10.1016/j.cell.2014.10.039. - DOI - PMC - PubMed

Publication types