. 2023;64(4):80.
doi: 10.1007/s00348-023-03610-1. Epub 2023 Mar 30.

Interferometric laser imaging for respiratory droplets sizing

Affiliations

Interferometric laser imaging for respiratory droplets sizing

Livia Grandoni et al. Exp Fluids. 2023.

Abstract

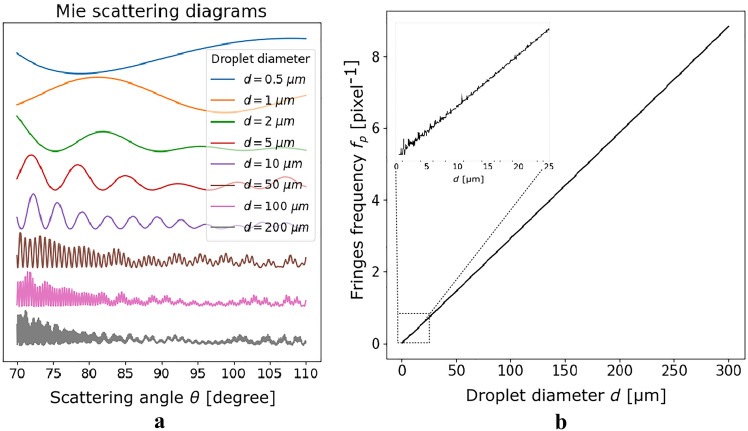
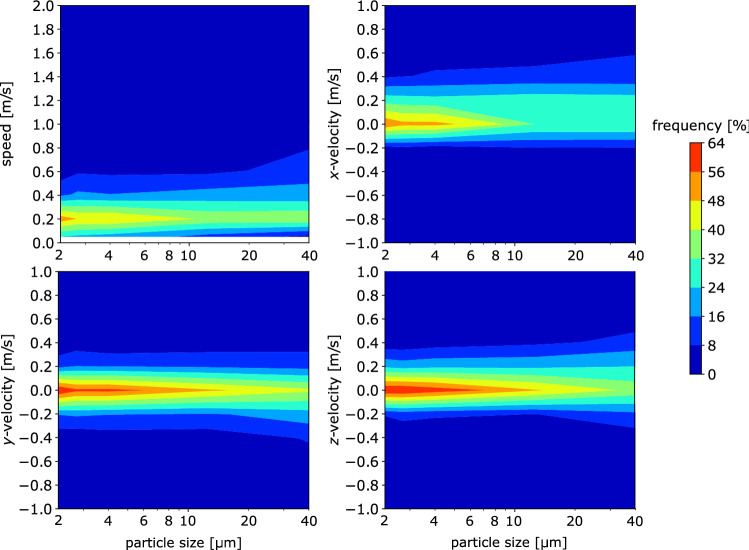
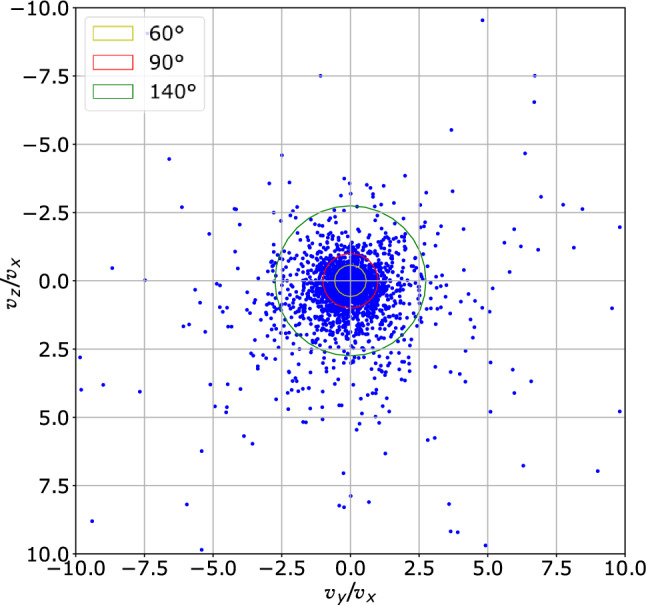
Due to its importance in airborne disease transmission, especially because of the COVID-19 pandemic, much attention has recently been devoted by the scientific community to the analysis of dispersion of particle-laden air clouds ejected by humans during different respiratory activities. In spite of that, a lack of knowledge is still present particularly with regard to the velocity of the emitted particles, which could differ considerably from that of the air phase. The velocity of the particles is also expected to vary with their size. In this work, simultaneous measurements of size and velocity of particles emitted by humans while speaking have been performed by means of Interferometric Laser Imaging Droplet Sizing (ILIDS). This technique allowed us to detect emitted particles with size down to 2 µm as well as to quantify all three components of the velocity vector and the particle concentration. The outcomes of this work may be used as boundary conditions for numerical simulations of infected respiratory cloud transmission.


Conflict of interest statement

Conflict of interestThe authors declare that they have no conflict of interest.

Figures

Fig. 1
Fig. 1
Sketch of ILIDS technique principle. A laser light sheet illuminates the particles. A portion of the light scattered by the particles is collected by an optical system (lenses) along the direction identified by θ. The angle formed between the particle and the effective lens aperture is the collection angle α. Out-of-focus images of the particles are taken by means of a camera located at a distance Lout from the lenses. The light scattered by the particles is characterized by interference fringes, whose frequency is related to the particle size. Therefore, in the out-of-focus image, the particles appear as circles with interference fringes inside. Differently, in the image plane (at a distance Lf from the lenses), the particles appear as glare points. The out-of-focus images become more and more blurry as the distance l increases
Fig. 2
Fig. 2
a Water droplet scattering diagram computed according to Lorenz–Mie Theory, for droplet diameters between 0.5 and 200 μm (from top to bottom of the left panel) and b Fringes angular frequency as a function of droplet diameter computed by using Lorenz–Mie Theory and Fourier analysis for scattering angle centered on θ=90, a wide collection angle α=40, a wavelength λ=532 nm and a sampling step on scattering angle δθ=0.05
Fig. 3
Fig. 3
Effect of spherical aberrations on out-of-focus images. Using a pair of spherical lenses a the red rays at greater angles, far from the optical axis, cross this axis at shorter distances than the blue rays, closer to the optical axis. Using aspherical lenses b almost all the rays cross the optical axis at the same distance. As a consequence, a set of concentric circles corresponding to the different rays appears on the out-of-focus images. With aspherical lenses, the circle diameter increases linearly with ray angle. With spherical lenses, the circle diameter increases, then decreases and increases again, leading to a destructive folding of the fringes to be analyzed
Fig. 4
Fig. 4
a y,z-displacement and b x-displacement. The conditions at two subsequent time steps are depicted in black and red. The displacements of the particles occurring between the two time step are Δz and Δx. In case a, the displacement Δzout is observed in the out-of-focus image. In case b, the circle radius variation ΔR is observed in the out-of-focus image. The lines linking the particle in the laser sheet and its image are the central and the two extreme light ray paths
Fig. 5
Fig. 5
Detection range for particle of different sizes. Small, medium and large particles are represented in green (left panel), blue (central panel) and red (right panel), respectively. I0 is the laser light intensity, while x is the position within the laser sheet thickness
Fig. 6
Fig. 6
Schematic of the experimental setup. The principal planes (PP1 and PP2) of the two lenses are also drawn; these represent the position of the equivalent perfect thin lenses defined in Sect. 2.3
Fig. 7
Fig. 7
Upper panels: a superposition of 9 images of a point light source at 9 different distances from the optical axis and b the same images after deformation. Lower panels: example of image before (a) and after (b) deformation
Fig. 8
Fig. 8
a Measured laser intensity profile along with detection limits for particles of 2, 10 and 20 µm, b Volume of measurement and related standard deviation of circle radius for each particle size
Fig. 9
Fig. 9
Measured particle size distribution, compared to data by Duguid (1946) and Johnson et al. (2011)
Fig. 10
Fig. 10
Joint probability density function of particle velocity and size. Colors are number of particles characterized by a certain size and velocity normalized by the total number of particles of each size
Fig. 11
Fig. 11
Ratios between the spanwise and the streamwise (normal-to-the-mouth) velocity components. The yellow (inner), red (intermediate) and green (outer) circles indicate an aperture angle of the particle cloud of 60°, 90° and 140°, respectively

References

    1. Asadi S, Wexler AS, Cappa CD, et al. Aerosol emission and superemission during human speech increase with voice loudness. Sci Rep. 2019;9(1):2348. doi: 10.1038/s41598-019-38808-z. - DOI - PMC - PubMed
    1. Bahl P, de Silva CM, Chughtai AA, et al. An experimental framework to capture the flow dynamics of droplets expelled by a sneeze. Exp Fluids. 2020;61:176. doi: 10.1007/s00348-020-03008-3. - DOI - PMC - PubMed
    1. Bahl P, de Silva C, MacIntyre CR, et al. Flow dynamics of droplets expelled during sneezing. Phys Fluids. 2021;33(11):111,901. doi: 10.1063/5.0067609. - DOI - PMC - PubMed
    1. Bourouiba L. The fluid dynamics of disease transmission. Annu Rev Fluid Mech. 2021;53(1):473–508. doi: 10.1146/annurev-fluid-060220-113712. - DOI
    1. Bourouiba L, Dehandschoewercker E, Bush JWM. Violent expiratory events: on coughing and sneezing. J Fluid Mech. 2014;745:537–563. doi: 10.1017/jfm.2014.88. - DOI

LinkOut - more resources