Meta-Analysis
. 2023 Apr 28;132(9):1144-1161.
doi: 10.1161/CIRCRESAHA.122.321692. Epub 2023 Apr 5.

FHL5 Controls Vascular Disease-Associated Gene Programs in Smooth Muscle Cells

Affiliations
Meta-Analysis

FHL5 Controls Vascular Disease-Associated Gene Programs in Smooth Muscle Cells

Doris Wong et al. Circ Res. .

Abstract

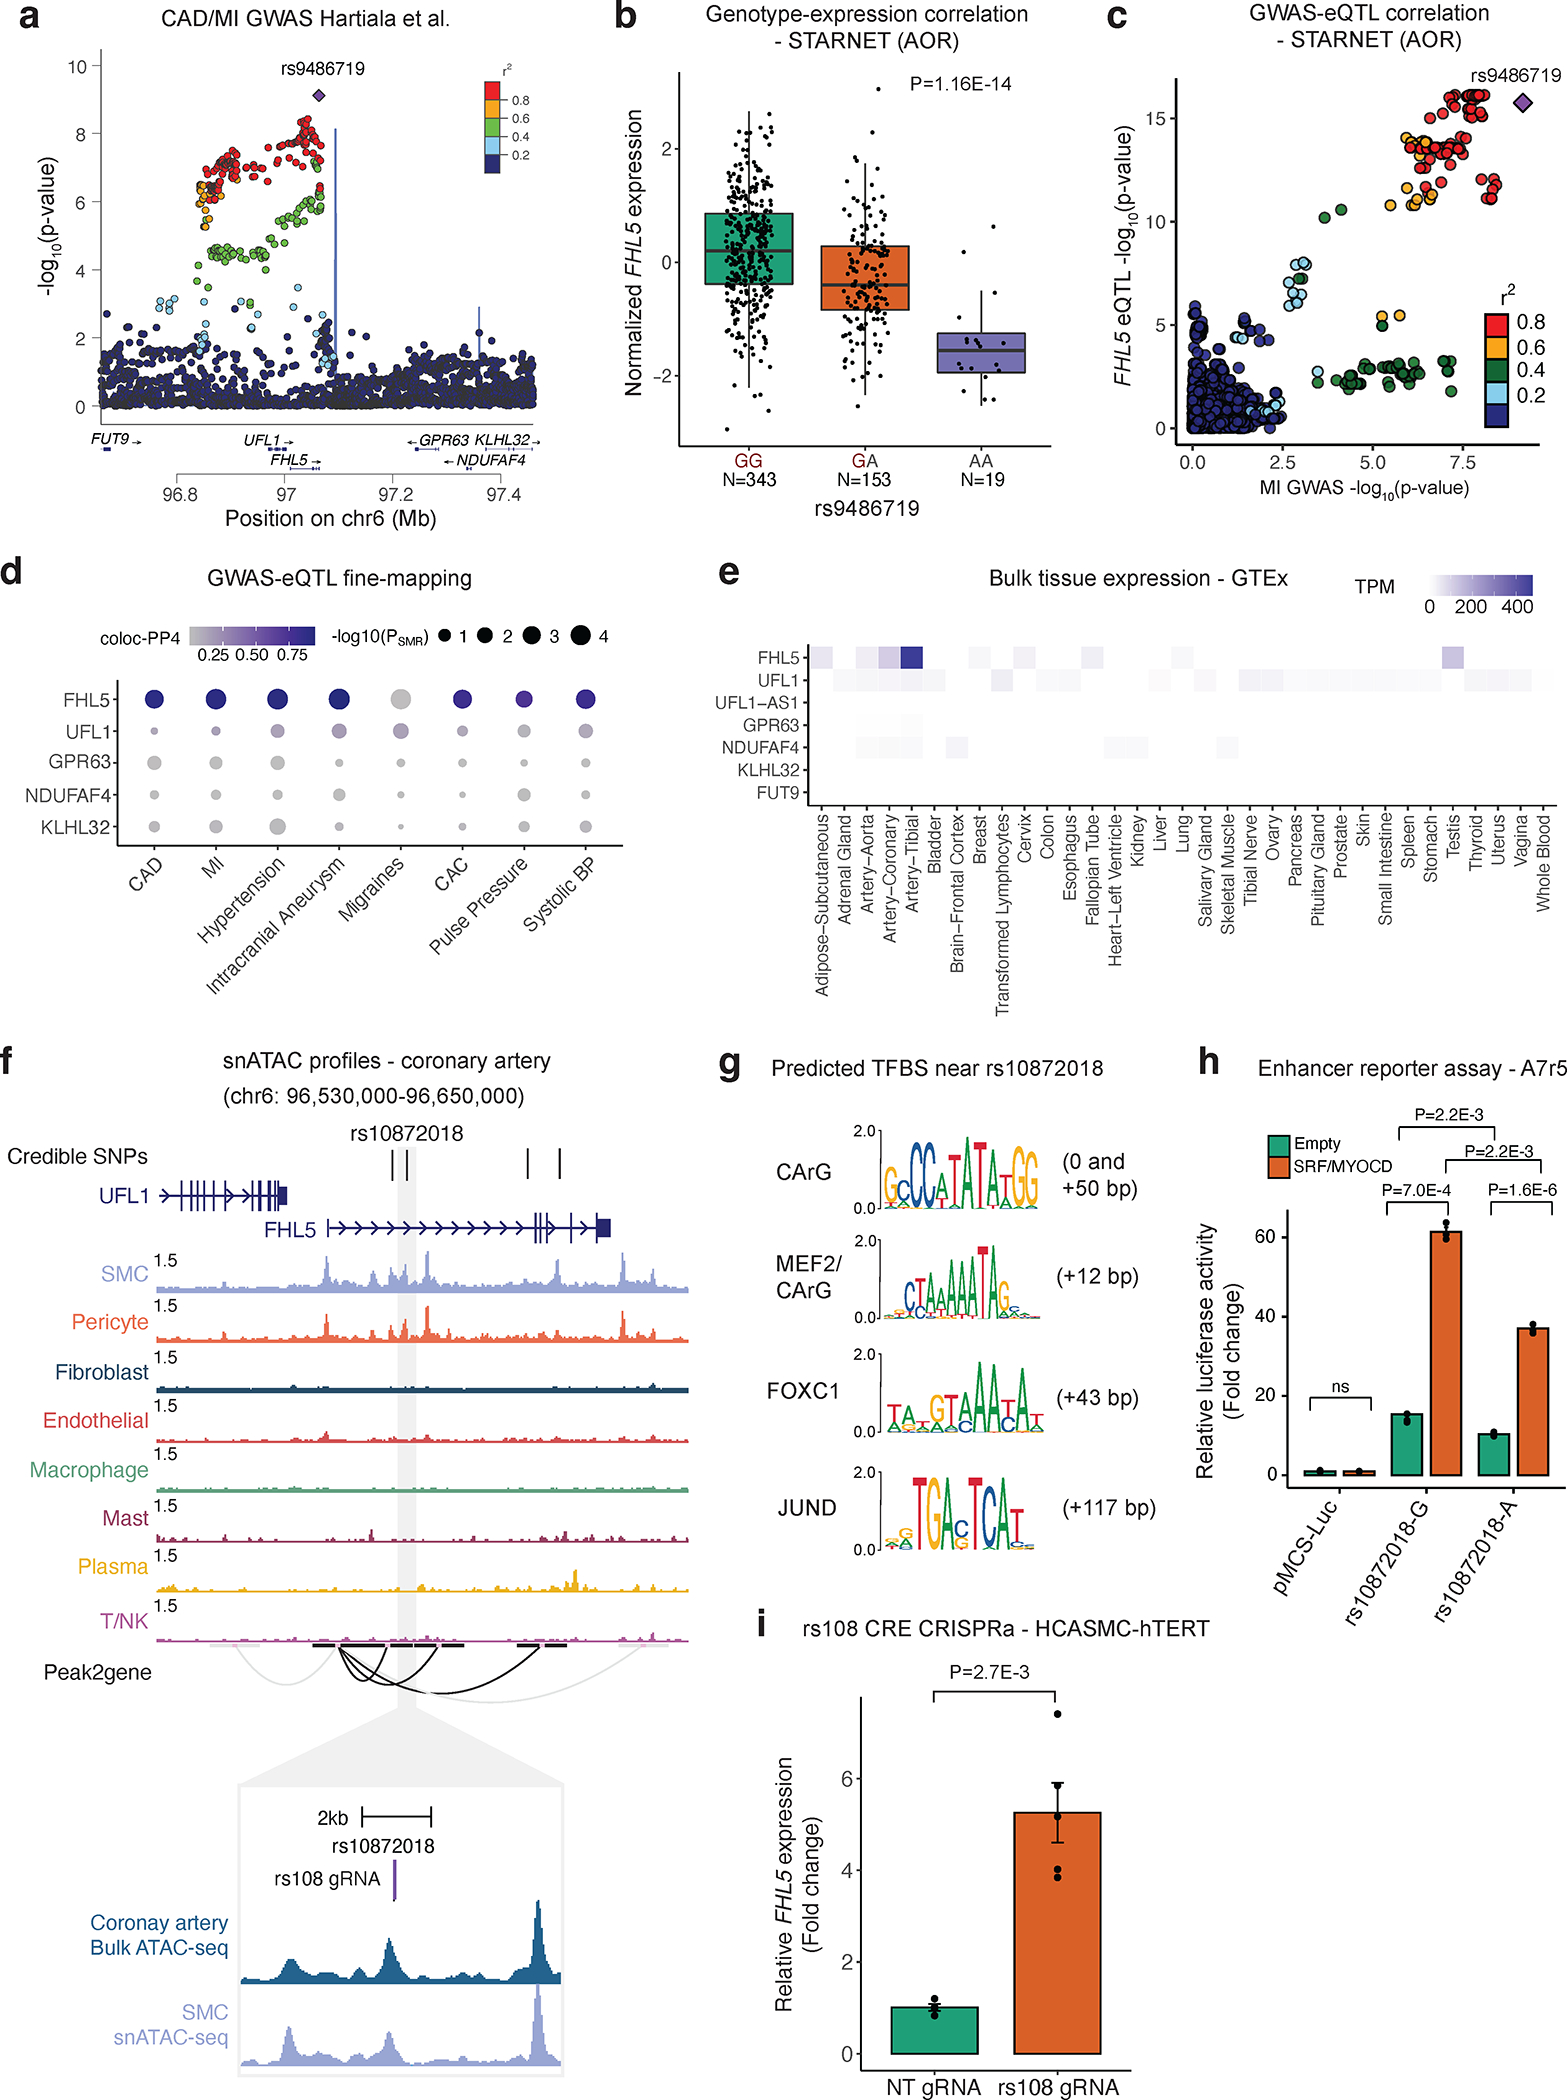
Background: Genome-wide association studies have identified hundreds of loci associated with common vascular diseases, such as coronary artery disease, myocardial infarction, and hypertension. However, the lack of mechanistic insights for many GWAS loci limits their translation into the clinic. Among these loci with unknown functions is UFL1-four-and-a-half LIM (LIN-11, Isl-1, MEC-3) domain 5 (FHL5; chr6q16.1), which reached genome-wide significance in a recent coronary artery disease/ myocardial infarction GWAS meta-analysis. UFL1-FHL5 is also associated with several vascular diseases, consistent with the widespread pleiotropy observed for GWAS loci.

Methods: We apply a multimodal approach leveraging statistical fine-mapping, epigenomic profiling, and ex vivo analysis of human coronary artery tissues to implicate FHL5 as the top candidate causal gene. We unravel the molecular mechanisms of the cross-phenotype genetic associations through in vitro functional analyses and epigenomic profiling experiments in coronary artery smooth muscle cells.

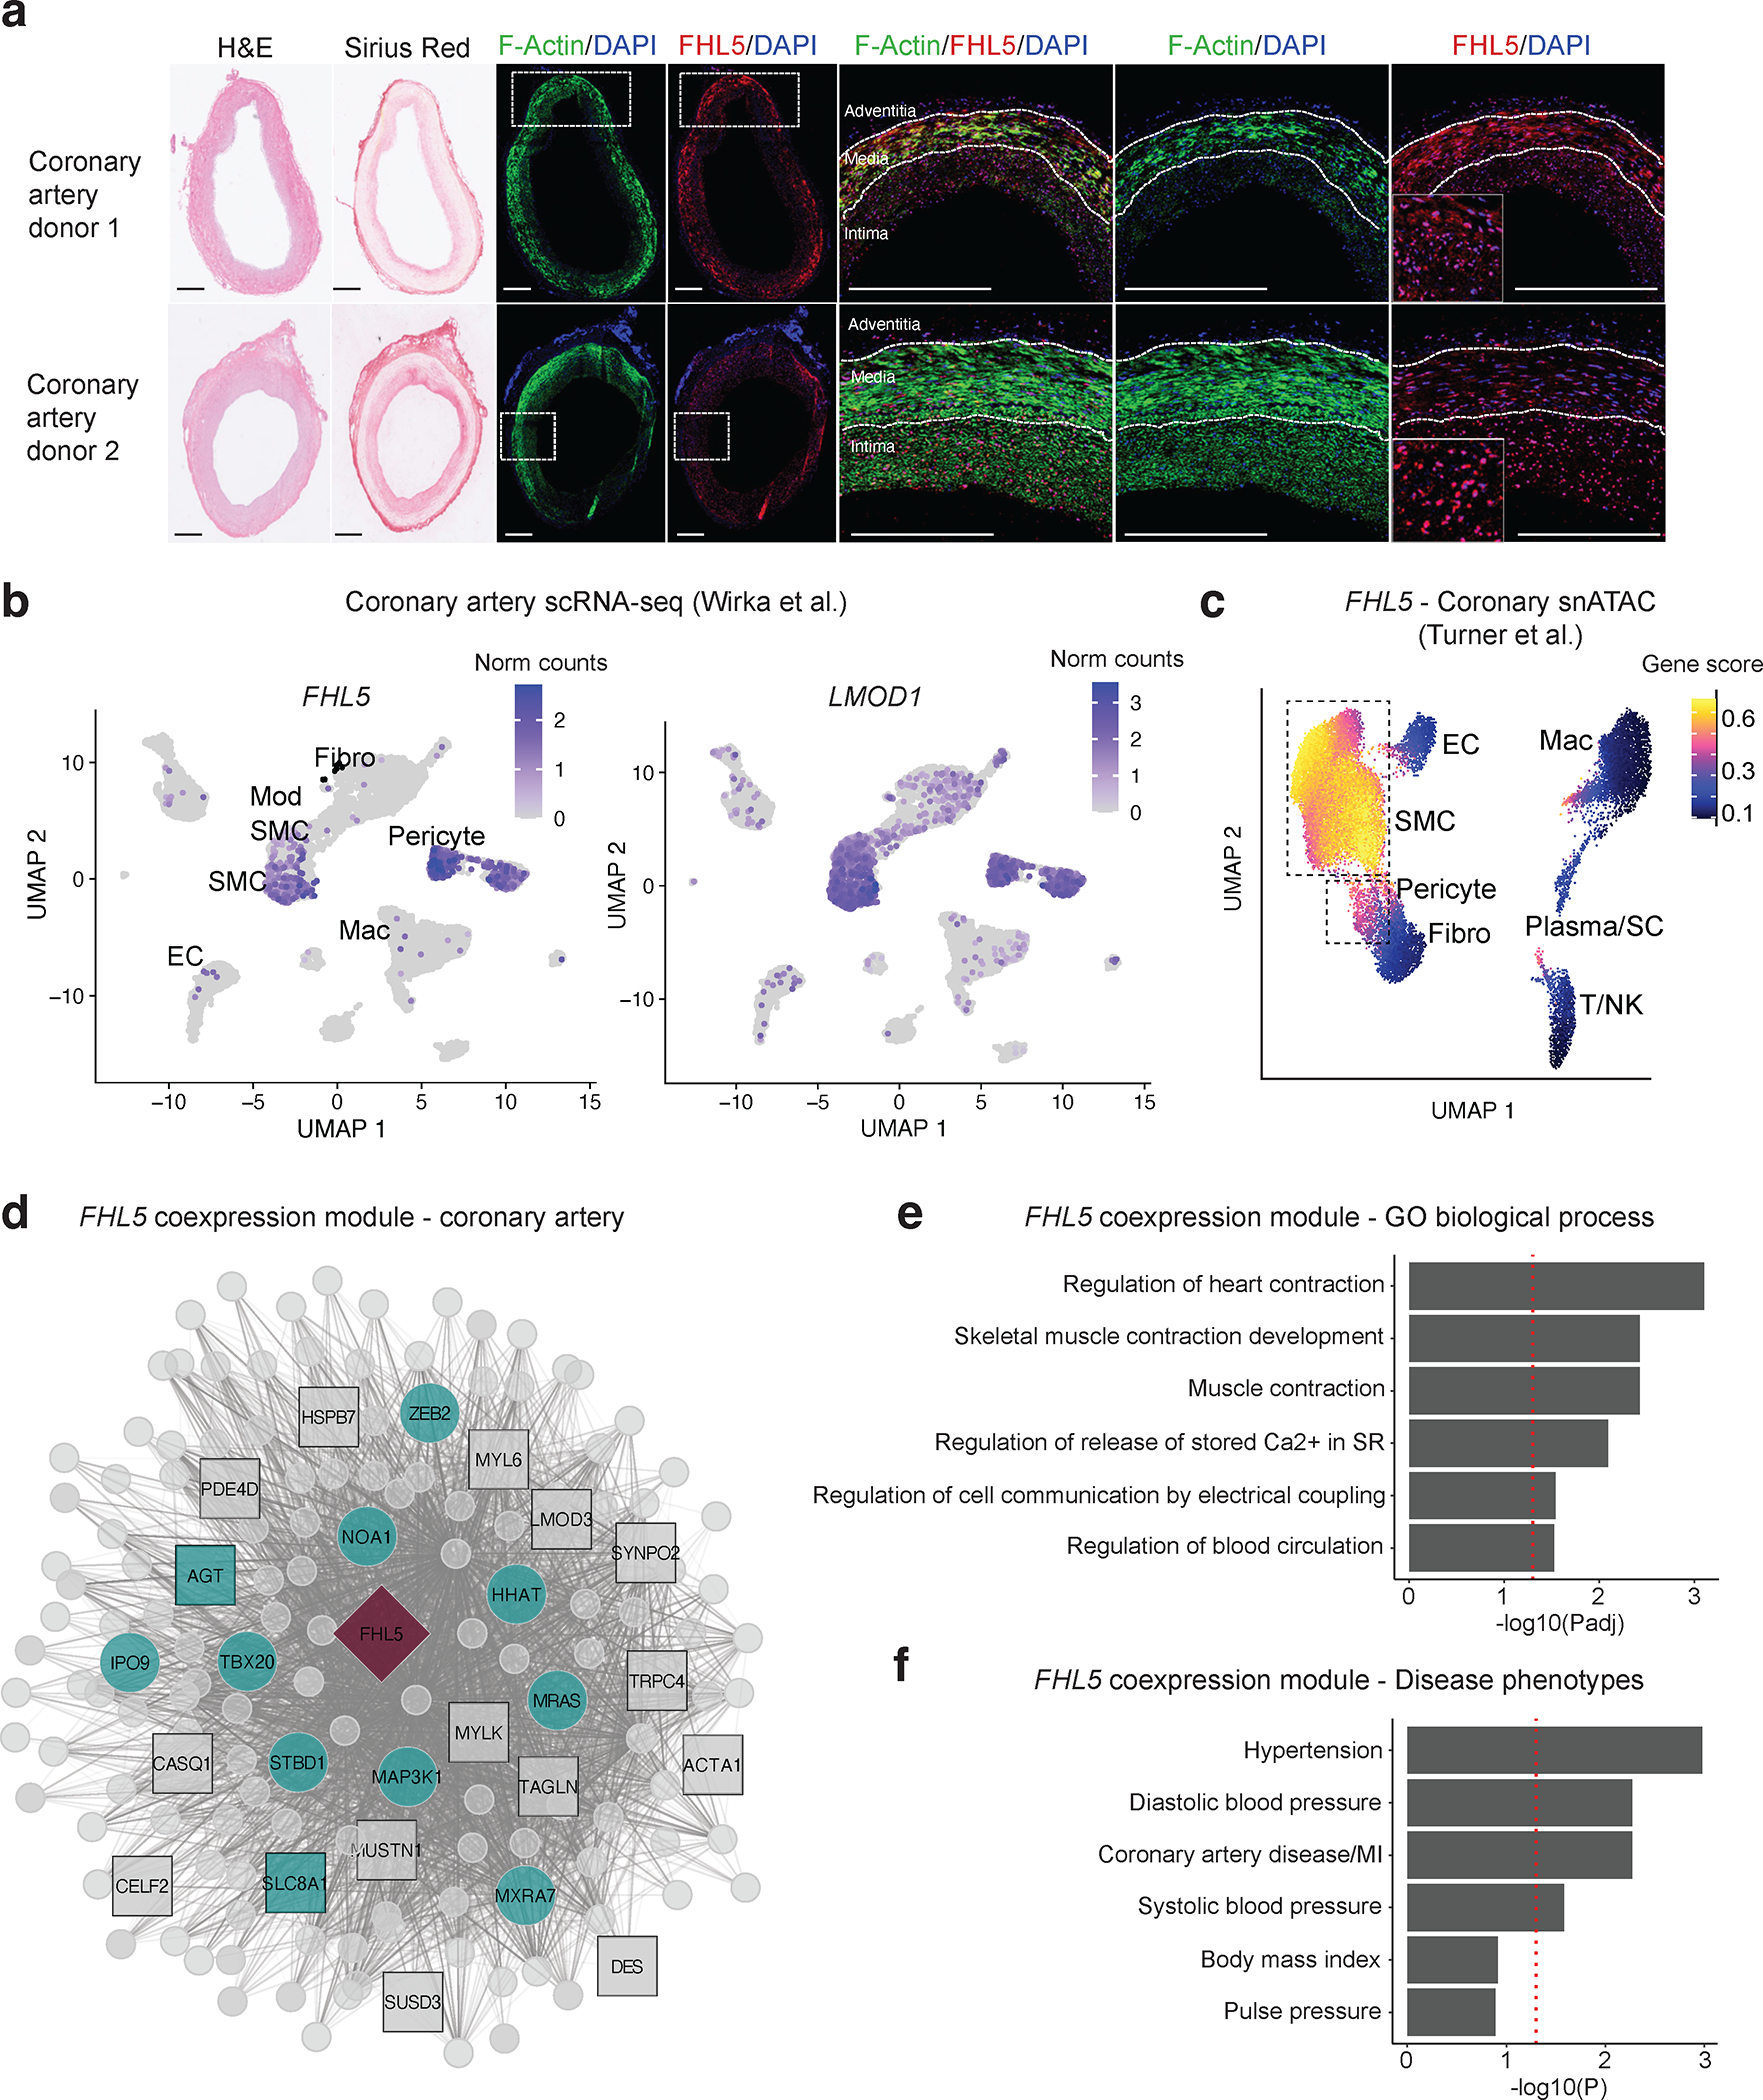
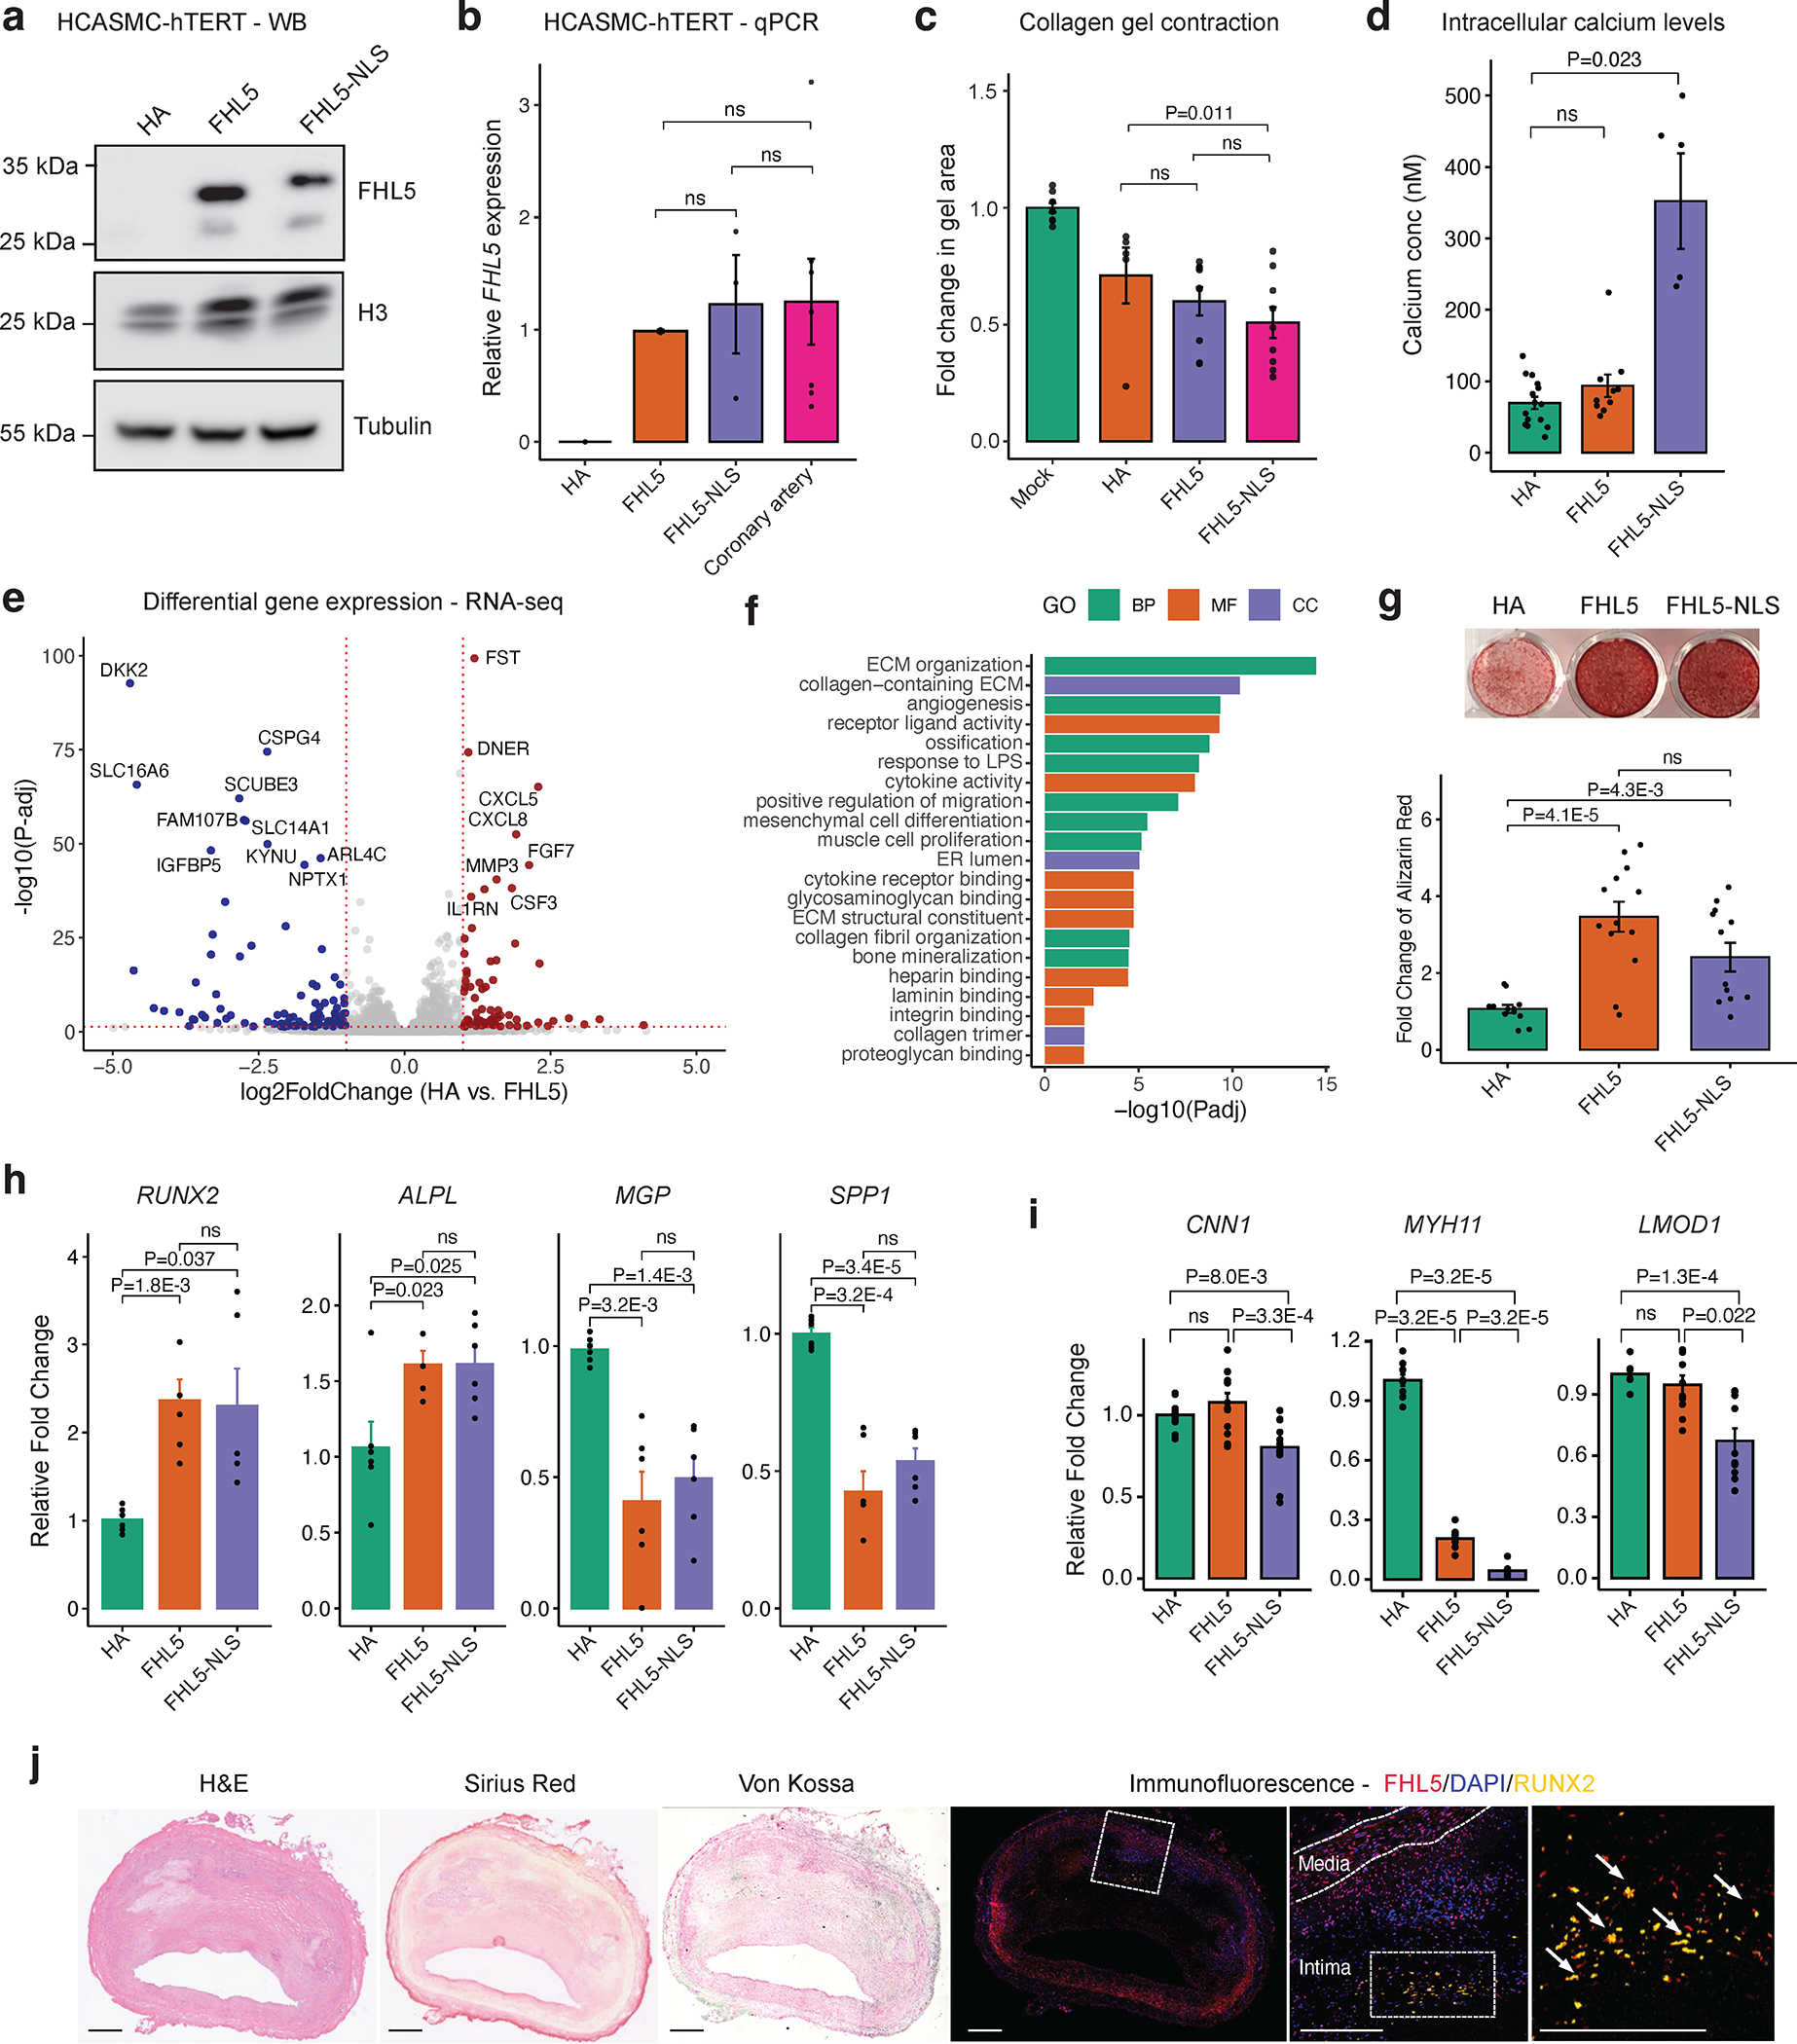
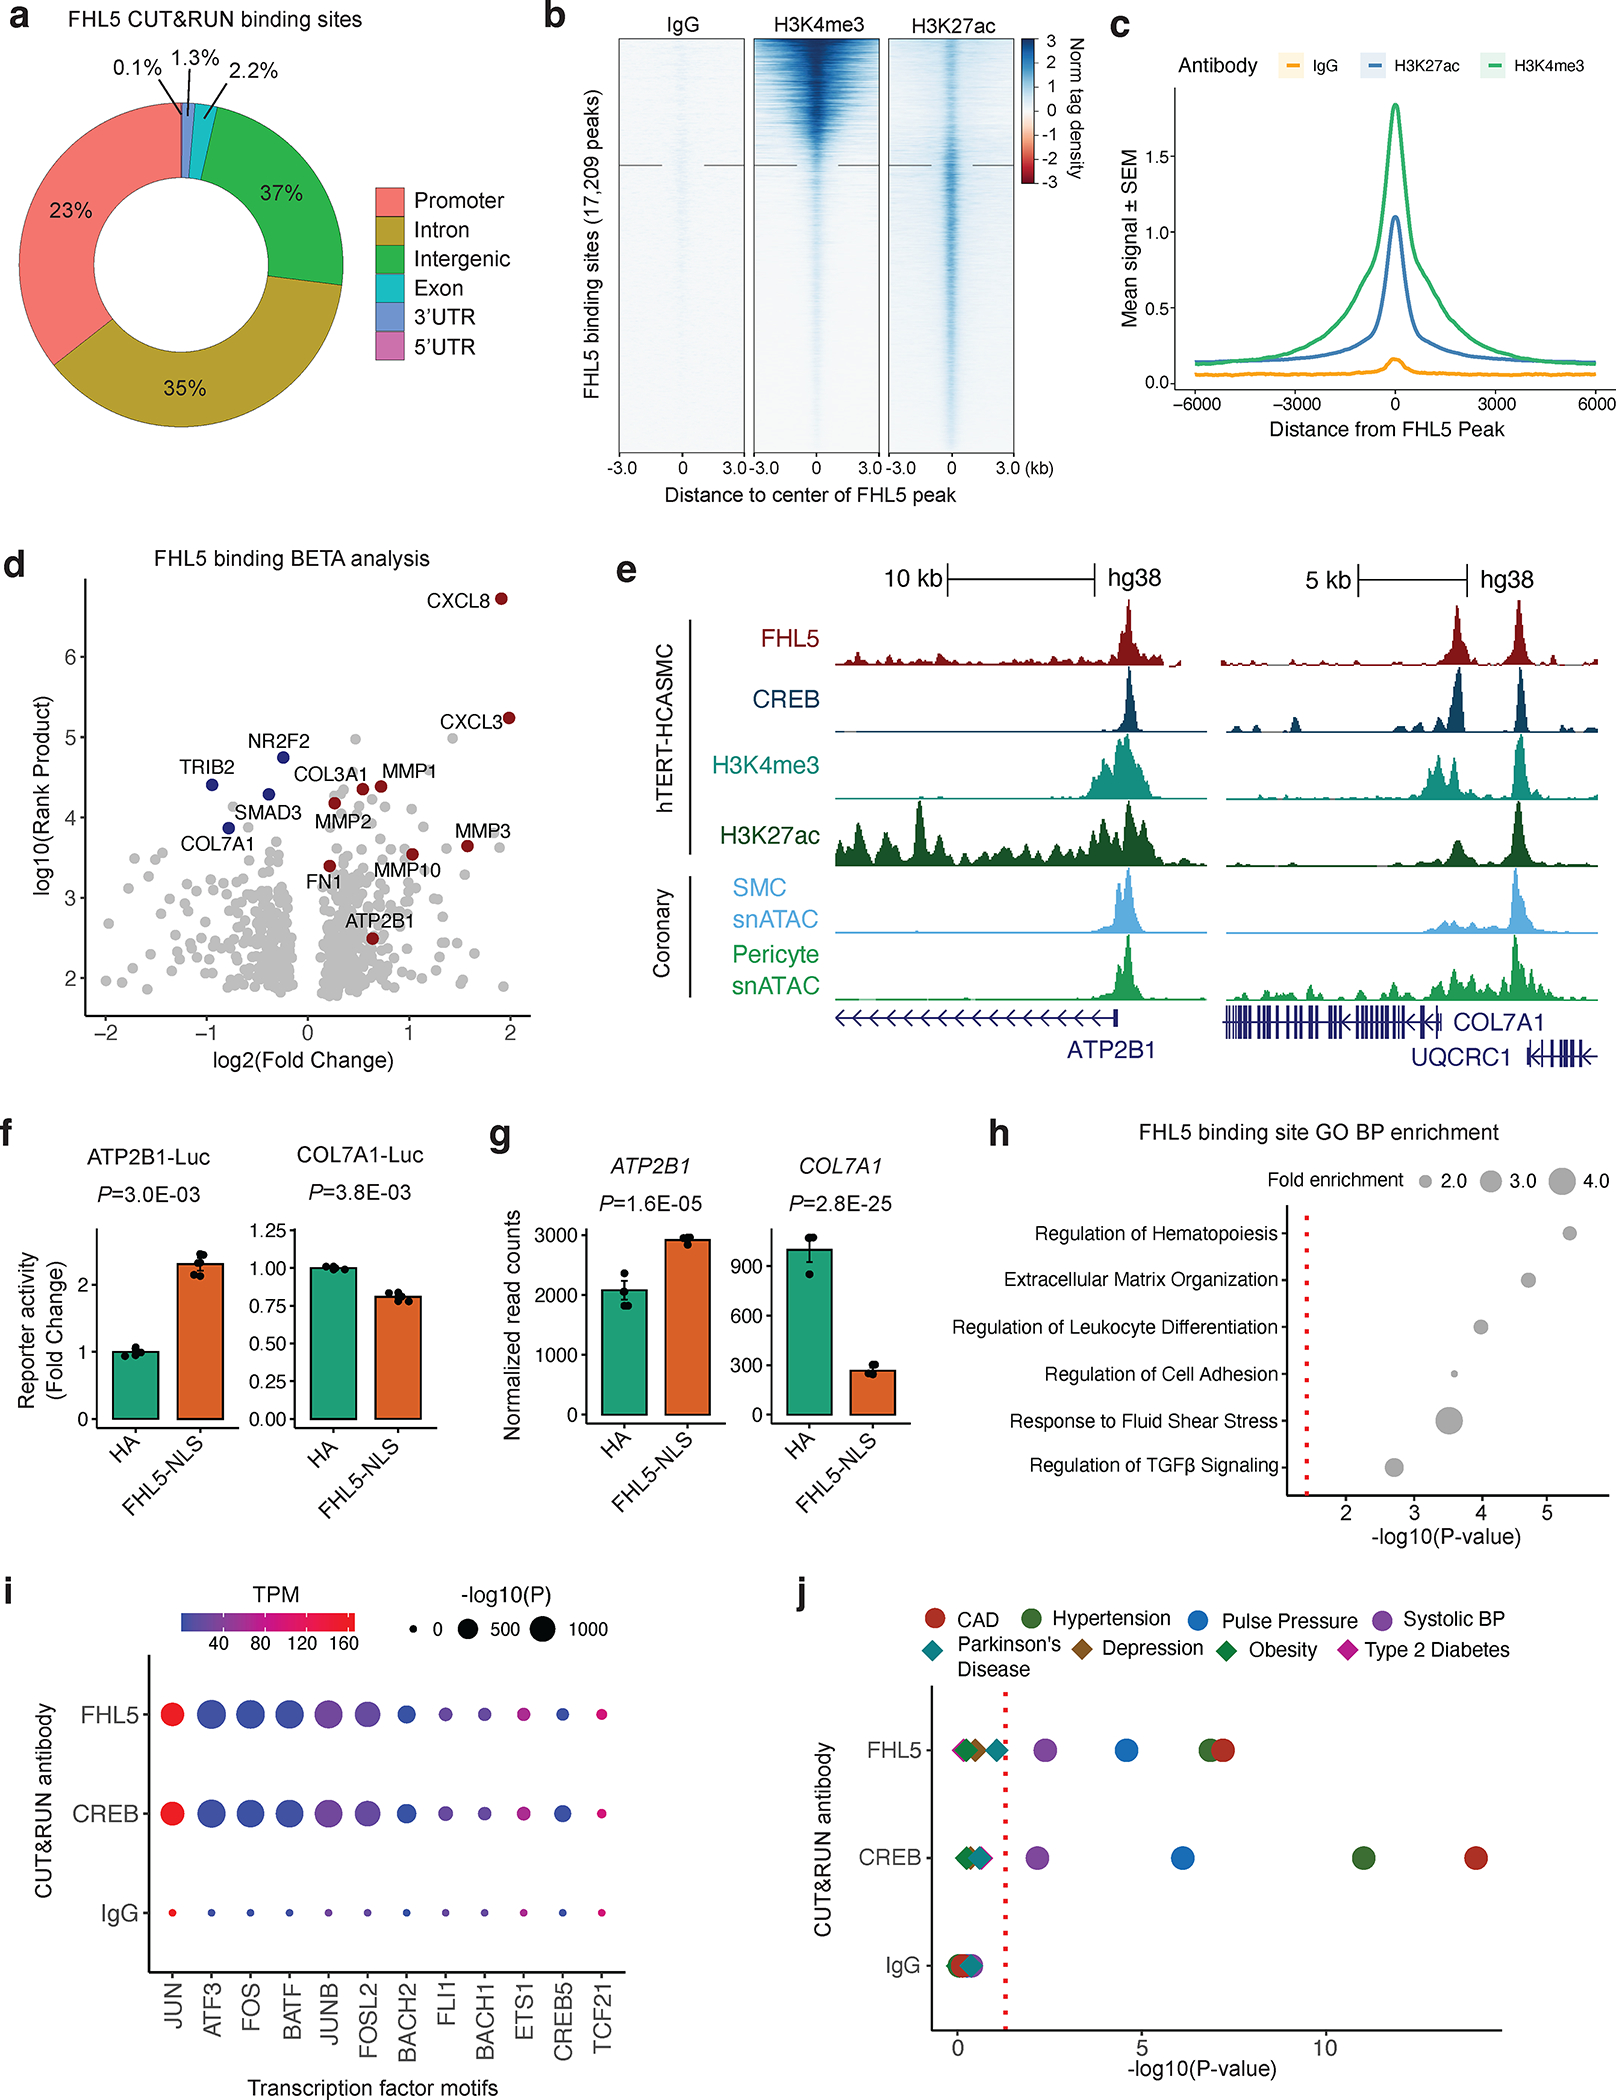
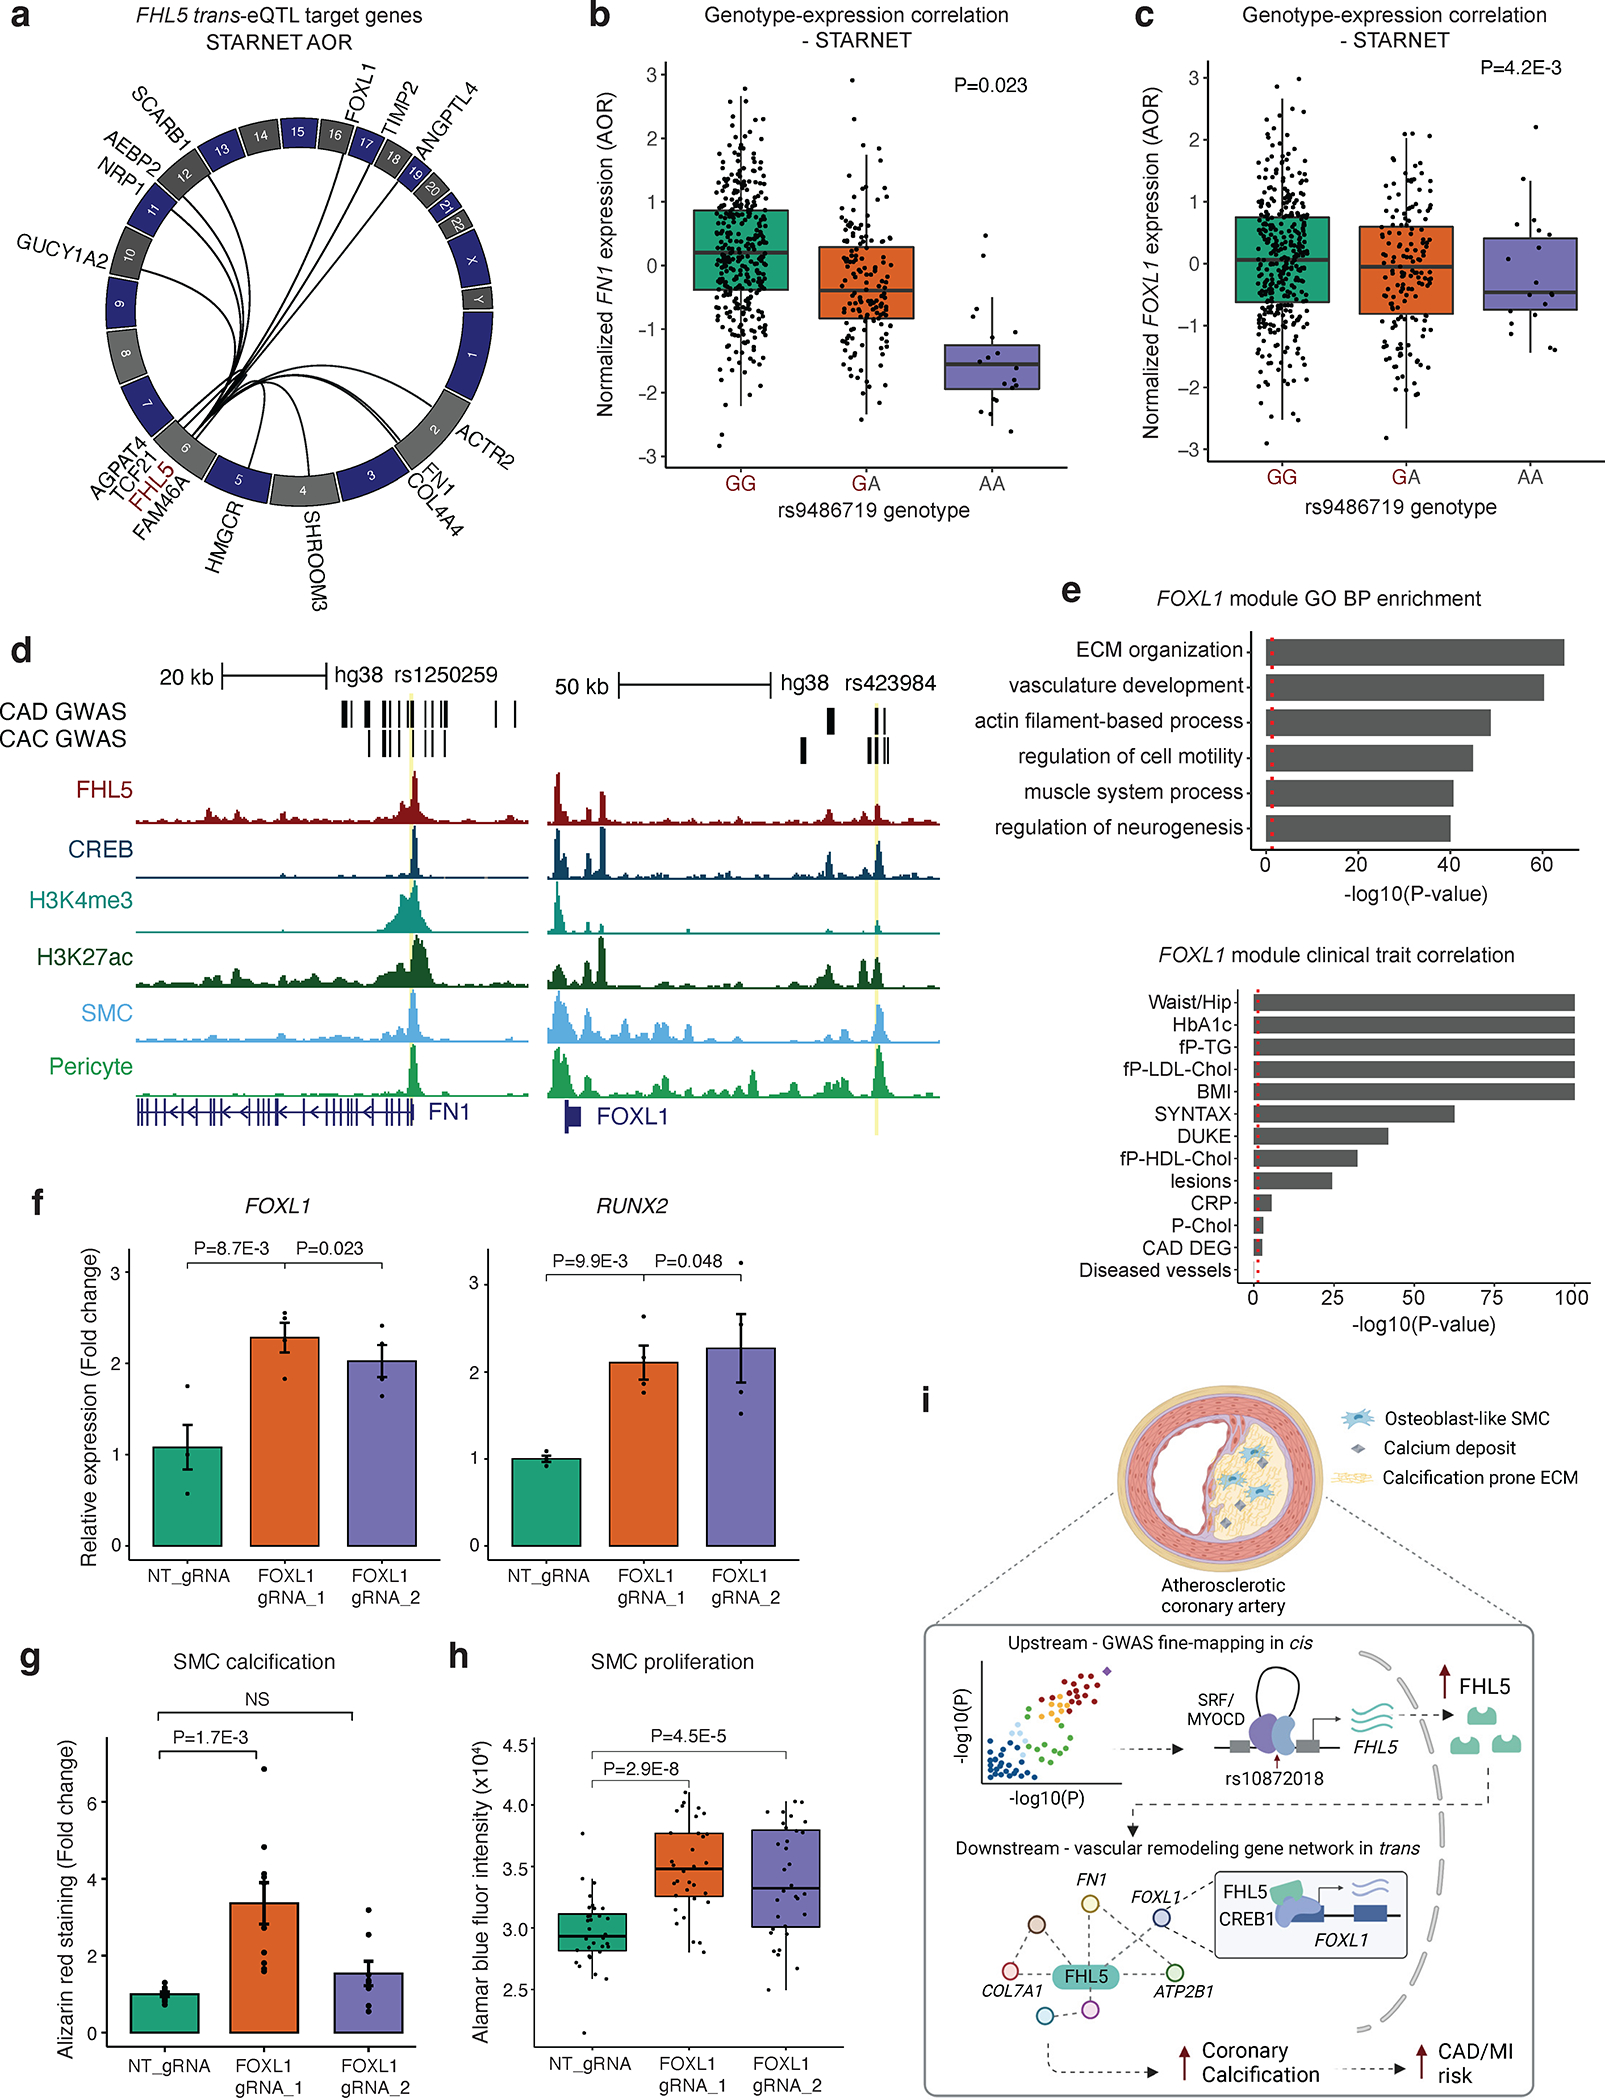
Results: We prioritized FHL5 as the top candidate causal gene at the UFL1-FHL5 locus through expression quantitative trait locus colocalization methods. FHL5 gene expression was enriched in the smooth muscle cells and pericyte population in human artery tissues with coexpression network analyses supporting a functional role in regulating smooth muscle cell contraction. Unexpectedly, under procalcifying conditions, FHL5 overexpression promoted vascular calcification and dysregulated processes related to extracellular matrix organization and calcium handling. Lastly, by mapping FHL5 binding sites and inferring FHL5 target gene function using artery tissue gene regulatory network analyses, we highlight regulatory interactions between FHL5 and downstream coronary artery disease/myocardial infarction loci, such as FOXL1 and FN1 that have roles in vascular remodeling.

Conclusions: Taken together, these studies provide mechanistic insights into the pleiotropic genetic associations of UFL1-FHL5. We show that FHL5 mediates vascular disease risk through transcriptional regulation of downstream vascular remodeling gene programs. These transacting mechanisms may explain a portion of the heritable risk for complex vascular diseases.

Keywords: coronary artery disease; epigenomics; genome-wide association study; myocardial infarction; vascular calcification.


Figures

Figure 1.
Figure 1.. FHL5 is the top candidate causal gene at the UFL1-FHL5 locus associated with increased CAD/MI risk.
(a) LocusZoom plot showing the association of UFL1-FHL5 locus with myocardial infarction (MI) in the combined UKBB and CARDIoGRAMplusC4D meta-analysis. (b) Association of rs9486719 CAD/MI risk alleles with FHL5 gene expression in STARNET aortic tissue (AOR). CAD/MI risk allele at rs9486719 highlighted in red. Box plots represent the median with the box spanning the first and third quartiles and whiskers as 1.5 times IQR. (c) Locuscompare plot showing the associations of top FHL5 STARNET aortic tissue cis-eQTLs with MI. (d) Summary of SMR and coloc based fine-mapping analyses to prioritize candidate causal gene(s) at UFL1-FHL5 locus associated with vascular diseases and cardiovascular risk factors. The size of the dot reflects the -log10(pSMR) and the intensity of purple color represents the posterior probability of colocalization. (e) Normalized gene expression as transcripts per million (TPM) for all genes at the UFL1-FHL5 locus across GTEx tissues. (f) Genome browser view of human coronary artery snATAC-seq peaks showing overlap between CAD 95% credible set of SNPs (highlighting top candidate rs10872018) with putative enhancers correlated with the FHL5 promoter through peak2Gene analyses. Inset, genomic location of guide RNA targeting the cis-regulatory element (CRE) containing rs10872018 (rs108 gRNA) in purple. Bulk coronary and smooth muscle cell (SMC) snATAC tracks are shown below. (g) Predicted transcription factor binding sites (TFBS) at or around rs10872018 determined from JASPAR 2022. Distance (bp) of motif sequence is also shown relative to the rs10872018 SNP. (h) Luciferase reporter assay in A7r5 SMCs comparing rs10872018 allele-specific enhancer activity co-transfected with empty vector (control) or SRF and MYOCD expression constructs. Results are presented as fold change of empty vector control (pMCS-Luc) and values are mean ± SEM of triplicates. P-values determined using the Kruskal-Wallis test. (i) FHL5 upregulation upon CRISPR activation of rs10872018 CRE by expressing dCas9-p300 and rs108 gRNA in immortalized human coronary artery smooth muscle cells (HCASMC). Results are presented as fold change of non-targeting control (NT gRNA) and values are mean ± SEM of n=5 replicates.
Figure 2.
Figure 2.. FHL5 expression is enriched in SMCs and pericytes in human coronary arteries.
(a) Histological staining (H&E and Sirius Red) and immunofluorescence of F-actin (green) and FHL5 protein (red), and region of interest for the overlapping proteins in the medial and intimal layers of two representative human subclinical atherosclerotic coronary arteries (n=8 unique donors). Inset in the far-right image depicts a higher magnification of the nuclear FHL5 localization. Scale bars = 0.5 mm. (b) UMAP visualization of FHL5 and LMOD1 gene expression in different human coronary artery cell types from Wirka et al . (c) UMAP visualization of human coronary artery snATAC-seq cell clusters colored according to FHL5 gene score calculated in ArchR. (d) Undirected FHL5 coexpression network identified in human coronary arteries using weighted gene co-expression network analysis (WGCNA). Each node represents a gene and the lines connecting 2 nodes are weighted according to degree of correlation. The teal color highlights module genes associated with CAD/MI or blood pressure. The square nodes represent module genes that regulate SMC contraction. FHL5 is placed at the center and depicted as a red diamond. (e) Enrichment of gene ontology biological processes (GO-BP) and (f) cardiometabolic disease phenotypes in the FHL5 module protein-coding genes. The highlighted terms are a subset of the full ranked list found in Supp Table 6.
Figure 3.
Figure 3.. FHL5 regulates SMC contraction and calcification.
(a) Western blot of FHL5 showing expression of FHL5 and FHL5-NLS in HCASMC-hTERT cell lines with H3 and Tubulin as loading controls. (b) Relative expression of FHL5 in HCASMC-hTERT (HA, FHL5, FHL5-NLS) compared to endogenous levels of FHL5 in human coronary arteries (n=3 donors) determined using qPCR. (c) Change in collagen gel contraction (mm2) in HCASMC-hTERT (HA, FHL5, FHL5-NLS) relative to gel with no cells (n=4 independent replicates). (d) Quantification of intracellular calcium concentrations following stimulation with 10 μm phenylephrine (n=4 biological replicates). (e) Volcano plot showing differentially expressed genes (DEGs) following FHL5 overexpression in HCASMC-hTERT relative to HA, with upregulated genes in red and downregulated genes in blue. For clarity, genes with log2FoldChange > 5 and log2Foldchange <−5 are not represented. The full DEG list is provided in Table S7. (f) GO enrichment analysis of FHL5 DEGs showing top over-represented terms for biological process (BP), molecular function (MF), and cell compartment (CC). These highlighted terms were selected from the full ranked list found in Table S8. (g) Representative image of HCASMC-hTERT (HA, FHL5, FHL5-NLS) stained with Alizarin Red after 21 days under osteogenic conditions, and fold change (relative to HA) in calcium deposition quantified by measuring Alizarin Red staining in HCASMC-hTERT after 21 days in osteogenic media. (h) Relative expression of vascular calcification activators (RUNX2, ALPL) and inhibitors (MGP, SPP1) 14 days post treatment in osteogenic media measured by qPCR. (i) Relative expression of SMC markers 14 days post treatment in osteogenic media measured by qPCR. (j) Representative immunofluorescence staining of human coronary arteries (n=4 independent donors) showing FHL5 (red) colocalization with RUNX2 (yellow) in the intima layer near regions of calcium deposition; inset shows higher magnification of the regions of interest with overlapping FHL5 and RUNX2 protein. Adjacent sections subjected to histology staining for hematoxylin & eosin (H&E), collagen deposition (Sirius Red), and calcification (Von Kossa). Scale bars = 0.5 mm. All error bars represent mean+/−SEM. P-values determined from paired Student’s t-test. Individual points reflect replicates from at least n=3 independent experiments. ns: non-significant.
Figure 4.
Figure 4.. FHL5 serves as a cofactor for the transcription factor, CREB, to regulate ECM organization in SMCs.
(a) Overlap of FHL5 peaks identified from CUT&RUN with genomic features. (b) Heatmap showing distribution of active chromatin histone marks (H3K4me3 and H3K27ac) +/−3kb from the center of FHL5 peaks, compared to IgG control. (c) Density plot showing genome-wide enrichment of active chromatin histone marks +/− 6kb from the center of FHL5 peaks. (d) Results of Binding and Expression Target Analysis (BETA) using FHL5 CUT&RUN peaks and FHL5 differentially expressed genes (DEGs) as input. Top candidate direct target genes highlighted in red, or blue based on upregulated and downregulated expression, respectively. Log normalized rank sum product score reflects the likelihood of direct transcriptional regulation for each gene. (e) UCSC genome browser tracks for FHL5, CREB, H3K27ac and H3K4me3 CUT&RUN performed in HCASMC-hTert, as well as snATAC-seq for SMCs and pericytes from coronary artery (Turner et al. 2022) at ATP2B1 and COL7A1 loci. (f) Relative change in luciferase reporter activity of ATP2B1 and COL7A1 enhancer regions in FHL5 overexpressing SMCs. (g) Relative change in RNA expression of ATP2B1 and COL7A1 in HCASMC-hTert overexpressing FHL5, shown as normalized read counts. (h) Top GO-BP overrepresented in FHL5 target genes identified from GREAT analysis of FHL5 peaks. These highlighted terms were selected from the full ranked list in Table S10. (i) Top transcription factor motifs enriched in FHL5, CREB, and IgG peaks identified from HOMER known motif analysis (dot size) as well as normalized (transcripts per million: TPM) expression level of the corresponding transcription factors in SMCs (color scale). (j) GREGOR analysis showing enrichment for vascular trait GWAS risk variants in FHL5, CREB, and IgG binding sites.
Figure 5.
Figure 5.. FHL5 regulates a network of CAD associated genes in human artery tissues.
(a) Circos plot showing top trans-eQTL target genes for FHL5 lead SNP rs9486719 from STARNET artery tissues, which also harbor FHL5 binding sites in SMC. Genes are plotted according to genomic position with each black link representing significant trans-eQTL effects (P<0.05). (b) Association of rs9486719 with FOXL1 gene expression in atherosclerotic aortic artery (AOR) in STARNET. (c) Association of rs9486719 with FN1 gene expression in AOR tissue. The red allele color indicates the CAD risk allele (rs9486719-G). (d) UCSC genome browser tracks for FHL5, CREB, H3K27ac and H3K4me3 CUT&RUN performed in HCASMC-hTert, as well as snATAC-seq for SMCs and pericytes from human coronary artery (Turner et al. 2022) at the promoter of FN1 (left) and FOXL1 (right). (e) Top, enrichment of clinical traits in module 28 containing FOXL1 and FHL5 in STARNET cross-tissue networks. The red dotted line corresponds to P<0.05. Bottom, top GO-BP enriched in module 28. The red dotted line corresponds to a nominal threshold of FDR<0.05. These highlighted terms were subset from the full ranked list in Table S13a. (f) Relative expression of FOXL1 (left) and RUNX2 (right) in HCASMC-hTERT under osteogenic conditions where FOXL1 expression was activated using the CRISPR-SAM system and two different guide RNAs (FOXL1 gRNA_1 and FOXL1 gRNA_2), relative to non-targeting guide RNA (NT_gRNA). Values represent mean ± SEM of relative FOXL1 or RUNX2 expression normalized to GAPDH from n=4 replicates. (g) Alizarin red staining-based quantification of calcification in HCASMC expressing NT gRNA or FOXL1_gRNA_1, FOXL1_gRNA_2 under osteogenic conditions for 21 days. Values represent mean ± SEM from n=8 replicates. (h) Proliferation measured with Alamar blue fluorescence quantification after 4 days in FOXL1-CRISPRa HCASMC-hTERT. (i) Schematic depicting the proposed upstream and downstream mechanisms underlying the FHL5 genetic association with CAD/MI and other vascular traits. Top, risk alleles for candidate causal variants (e.g., rs10872018) are associated with increased FHL5 gene expression, which are predicted to function through SRF-MYOCD enhancers in cis. Bottom, this results in increased binding of FHL5 cofactor to CREB regulatory elements in vascular remodeling gene network in trans, ultimately leading to maladaptive ECM remodeling and vascular calcification in SMC and osteogenic-like SMC, thus increasing disease risk. Created with BioRender.com

References

    1. Wong D, Turner AW, Miller CL. Genetic insights into smooth muscle cell contributions to coronary artery disease. Arterioscler. Thromb. Vasc. Biol. 2019;39:1006–1017. - PMC - PubMed
    1. Miano JM, Fisher EA, Majesky MW. Fate and state of vascular smooth muscle cells in atherosclerosis. Circulation. 2021;143:2110–2116. - PMC - PubMed
    1. Liu M, Gomez D. Smooth muscle cell phenotypic diversity. Arterioscler. Thromb. Vasc. Biol. 2019;39:1715–1723. - PMC - PubMed
    1. van der Harst P, Verweij N. Identification of 64 novel genetic loci provides an expanded view on the genetic architecture of coronary artery disease. Circ. Res. 2018;122:433–443. - PMC - PubMed
    1. Tcheandjieu C, Zhu X, Hilliard AT, Clarke SL, Napolioni V, Ma S, Lee KM, Fang H, Chen F, Lu Y, et al. Large-scale genome-wide association study of coronary artery disease in genetically diverse populations. Nat. Med. 2022;28:1679–1692. - PMC - PubMed

Publication types

MeSH terms

Supplementary concepts