. 2023 Jun 5;62(23):e202301209.
doi: 10.1002/anie.202301209. Epub 2023 May 2.

Conformationally Controlled sp3 -Hydrocarbon-Based α-Helix Mimetics

Affiliations

Conformationally Controlled sp3 -Hydrocarbon-Based α-Helix Mimetics

Lydia I Dewis et al. Angew Chem Int Ed Engl. .

Abstract

With over 60 % of protein-protein interfaces featuring an α-helix, the use of α-helix mimetics as inhibitors of these interactions is a prevalent therapeutic strategy. However, methods to control the conformation of mimetics, thus enabling maximum efficacy, can be restrictive. Alternatively, conformation can be controlled through the introduction of destabilizing syn-pentane interactions. This tactic, which is often adopted by Nature, is not a common feature of lead optimization owing to the significant synthetic effort required. Through assembly-line synthesis with NMR and computational analysis, we have shown that alternating syn-anti configured contiguously substituted hydrocarbons, by avoiding syn-pentane interactions, adopt well-defined conformations that present functional groups in an arrangement that mimics the α-helix. The design of a p53 mimetic that binds to Mdm2 with moderate to good affinity, demonstrates the therapeutic promise of these scaffolds.

Keywords: Conformation Control; Organoboron; Protein-Protein Interactions; Syn-Pentane Interactions; α-Helix Mimetics.


Conflict of interest statement

The authors declare no conflict of interest.

Figures

Figure 1
Figure 1
a) The syn‐pentane interaction. b) Contiguously‐methyl substituted synanti (1) and all‐syn (2) hydrocarbons. The distance between methyl groups on one face of the scaffolds closely match the distance between residues on one face of an α‐helix. c) An α‐helical polyalanine showing distances for i, i+4 and i+7 residues. d) An overlay of syn‐anti diastereomer 1 and α‐helical polyalanine showing overlap of the 1st, 5th and 9th methyl groups with the i, i+4 and i+7 residues of the α‐helix.
Figure 2
Figure 2
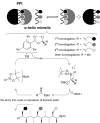
Design of an α‐helix mimetic PPI inhibitor based on linear hydrocarbon 1. The shaded circles represent the hot‐spot residues identified for the PPI in question. The hot‐spot groups can be incorporated by using benzoate ester building blocks bearing the desired residue.
Figure 3
Figure 3
Overlay of scaffold 3 with a representative all‐Ala α‐helix. The ortho substituent, the 3rd and the 7th positions of the scaffold are shown to overlay well with the i, i+4 and i+7 residues of the α‐helix.
Figure 4
Figure 4
a) The five lowest‐energy conformers of mimetic 4 identified through an MM conformational search. b) An overlay of mimetic 4 with p53, representing the orientation predicted by molecular docking calculations (see below).
Figure 5
Figure 5
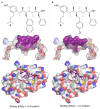
Molecular docking using AutoDock Vina. a) The predicted binding pose of mimetic 4 within the p53 pocket of Mdm2. b) The predicted binding pose of mimetic 5 within the p53 pocket of Mdm2.
Scheme 1
Scheme 1
Assembly line synthesis of boronic ester derivatives 11 and 12, which were converted into p53 mimetics 4 and 5, respectively. MOM=methyoxymethyl; TIB=2,4,6‐triisopropylbenzoate; pin=pinacol.
Scheme 2
Scheme 2
Synthesis of PEGylated derivatives for improved aqueous solubility.
Scheme 3
Scheme 3
Control molecules 17 and 18.
Figure 6
Figure 6
Conformational analysis of mimetic 4. (CDCl3. 21 mM) a) MADs and SDs from comparison of experimental and calculated NMR parameters. b) A ‘bubble plot’ showing the major clusters of conformers as determined by DFT. The major cluster corresponds to a linear conformation, which exhibits dihedral angles of 180° along the backbone. The size of each ‘bubble’ represents the Boltzmann population of that conformer. c) A graph showing the correlation between experimental interproton distances/scalar coupling constants and those calculated by DFT.
Figure 7
Figure 7
Simulated and experimental (MeOD, 500 MHz) 1H NMR backbone methine peaks of PEG derivative 15 showing that PEGylation does not disrupt backbone conformation, which remains linear.
Figure 8
Figure 8
a) The 1H‐15N TROSY spectra of apo‐Mdm2 (red) and Mdm2+mimetic 15 (blue). Residues that exhibited a CSP>2σ upon binding of mimetic 15 have been marked. b) Mapping the location of binding of mimetic 15 to Mdm2 from the CSPs observed in the 1H–15N TROSY. Residues that induce a CSP>2σ are shown in red, CSP>σ are shown in orange and CSP<σ are shown in yellow.

References

    1. None
    1. Jayatunga M. K., Thompson S., Hamilton A. D., Bioorg. Med. Chem. Lett. 2014, 24, 717; - PubMed
    1. Algar S., Martín-Martínez M., González-Muñiz R., Eur. J. Med. Chem. 2021, 211, 113015; - PubMed
    1. Lenci E., Trabocchi A., Chem. Soc. Rev. 2020, 49, 3262; - PubMed
    1. Mabonga L., Kappo A. P., Int. J. Pept. Res. Ther. 2020, 26, 225;

Publication types