

Probing multiple algorithms to calculate brain age: Examining reliability, relations with demographics, and predictive power
- PMID: 37017242
- PMCID: PMC10203791
- DOI: 10.1002/hbm.26292
Probing multiple algorithms to calculate brain age: Examining reliability, relations with demographics, and predictive power
Abstract
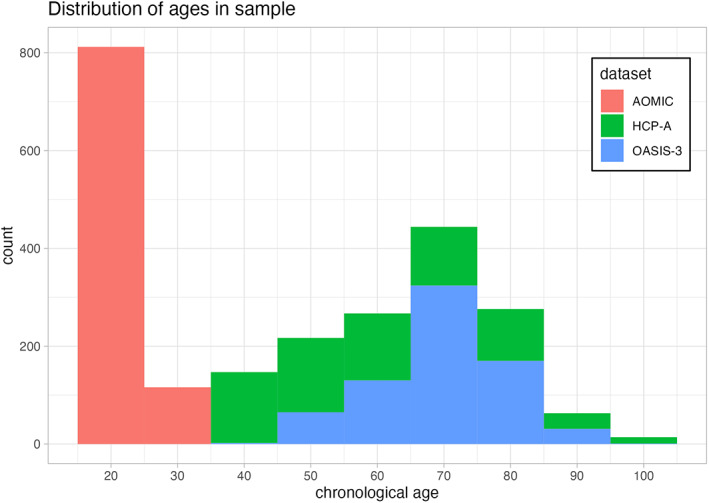
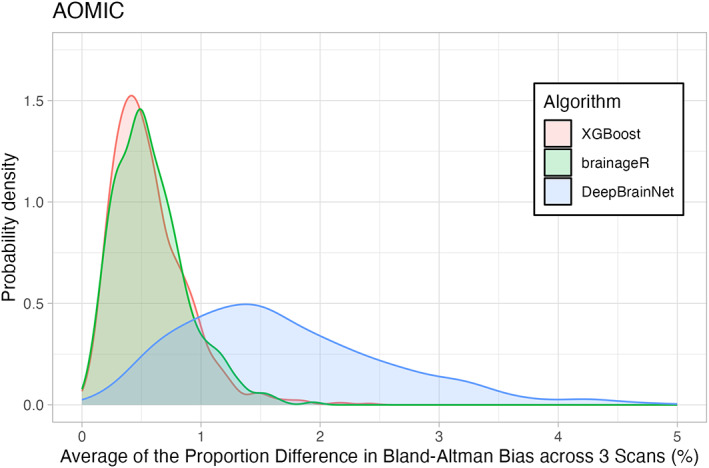
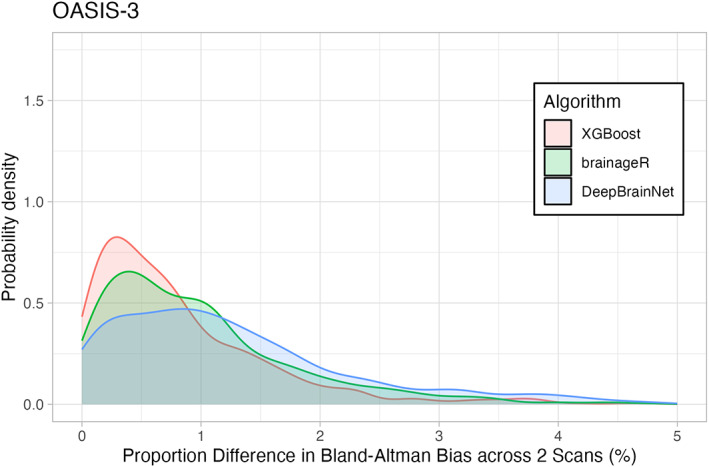
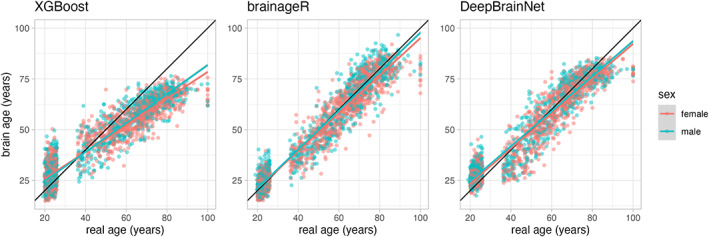
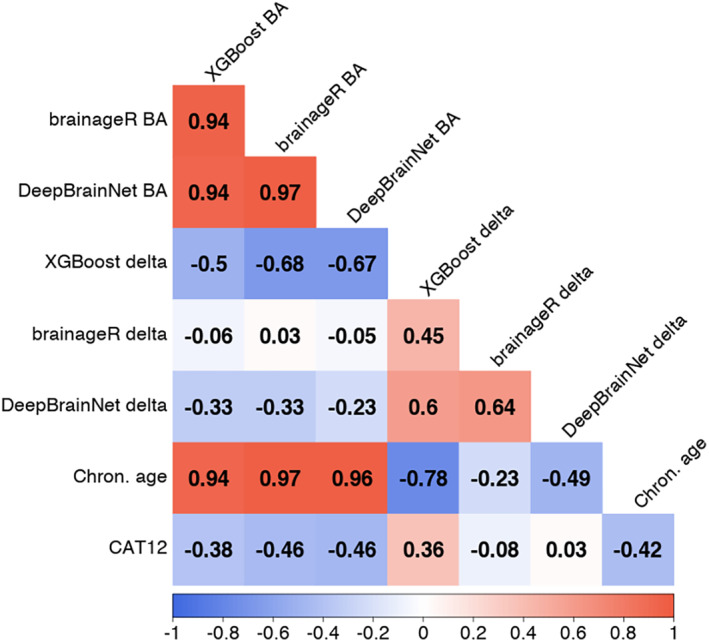
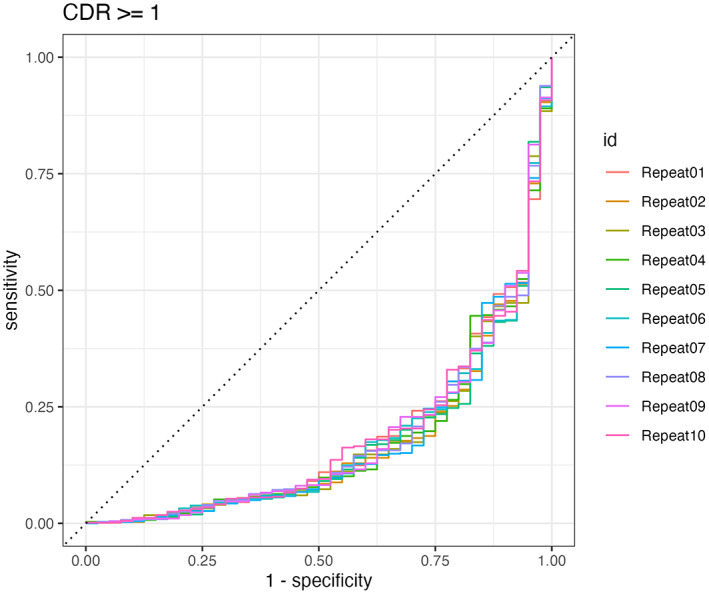
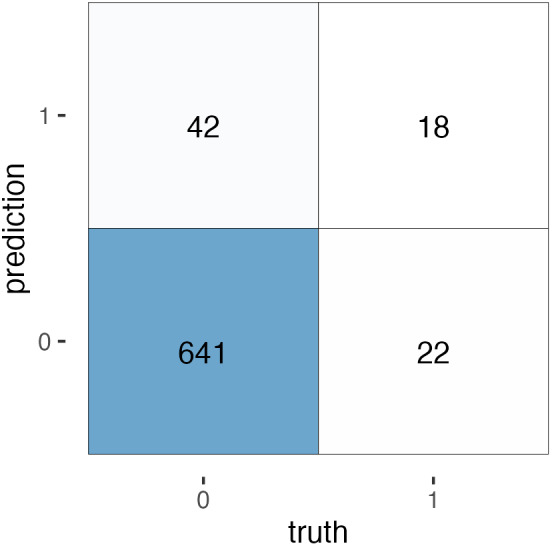
The calculation of so-called "brain age" from structural MRIs has been an emerging biomarker in aging research. Data suggests that discrepancies between chronological age and the predicted age of the brain may be predictive of mortality and morbidity (for review, see Cole, Marioni, Harris, & Deary, 2019). However, with these promising results come technical complexities of how to calculate brain age. Various groups have deployed methods leveraging different statistical approaches, often crafting novel algorithms for assessing this biomarker derived from structural MRIs. There remain many open questions about the reliability, collinearity, and predictive power of different algorithms. Here, we complete a rigorous systematic comparison of three commonly used, previously published brain age algorithms (XGBoost, brainageR, and DeepBrainNet) to serve as a foundation for future applied research. First, using multiple datasets with repeated structural MRI scans, we calculated two metrics of reliability (intraclass correlations and Bland-Altman bias). We then considered correlations between brain age variables, chronological age, biological sex, and image quality. We also calculated the magnitude of collinearity between approaches. Finally, we used machine learning approaches to identify significant predictors across brain age algorithms related to clinical diagnoses of cognitive impairment. Using a large sample (N = 2557), we find all three commonly used brain age algorithms demonstrate excellent reliability (r > .9). We also note that brainageR and DeepBrainNet are reasonably correlated with one another, and that the XGBoost brain age is strongly related to image quality. Finally, and notably, we find that XGBoost brain age calculations were more sensitive to the detection of clinical diagnoses of cognitive impairment. We close this work with recommendations for future research studies focused on brain age.
Keywords: aging; brain age; neuroscience; reliability; statistics.
© 2023 The Authors. Human Brain Mapping published by Wiley Periodicals LLC.
Figures
References
-
- Avesani, P. , McPherson, B. , Hayashi, S. , Caiafa, C. F. , Henschel, R. , Garyfallidis, E. , Kitchell, L. , Bullock, D. , Patterson, A. , & Olivetti, E. (2019). The open diffusion data derivatives, brain data upcycling via integrated publishing of derivatives and reproducible open cloud services. Scientific Data, 6(1), 1–13. 10.1038/s41597-019-0073-y - DOI - PMC - PubMed
-
- Beck, D. , de Lange, A.‐M. G. , Maximov, I. I. , Richard, G. , Andreassen, O. A. , Nordvik, J. E. , & Westlye, L. T. (2021). White matter microstructure across the adult lifespan: A mixed longitudinal and cross‐sectional study using advanced diffusion models and brain‐age prediction. Neuroimage, 224, 117441. 10.1016/j.neuroimage.2020.117441 - DOI - PubMed
-
- Bookheimer, S. Y. , Salat, D. H. , Terpstra, M. , Ances, B. M. , Barch, D. M. , Buckner, R. L. , Burgess, G. C. , Curtiss, S. W. , Diaz‐Santos, M. , Elam, J. S. , Fischl, B. , Greve, D. N. , Hagy, H. A. , Harms, M. P. , Hatch, O. M. , Hedden, T. , Hodge, C. , Japardi, K. C. , Kuhn, T. P. , … Yacoub, E. (2019). The lifespan human connectome project in aging: An overview. NeuroImage, 185, 335–348. 10.1016/j.neuroimage.2018.10.009 - DOI - PMC - PubMed
Publication types
MeSH terms
LinkOut - more resources
Full Text Sources
