. 2023 May 16;11(10):3645-3655.
doi: 10.1039/d3bm00217a.

Extrahepatic transplantation of 3D cultured stem cell-derived islet organoids on microporous scaffolds

Affiliations

Extrahepatic transplantation of 3D cultured stem cell-derived islet organoids on microporous scaffolds

Elizabeth Bealer et al. Biomater Sci. .

Abstract

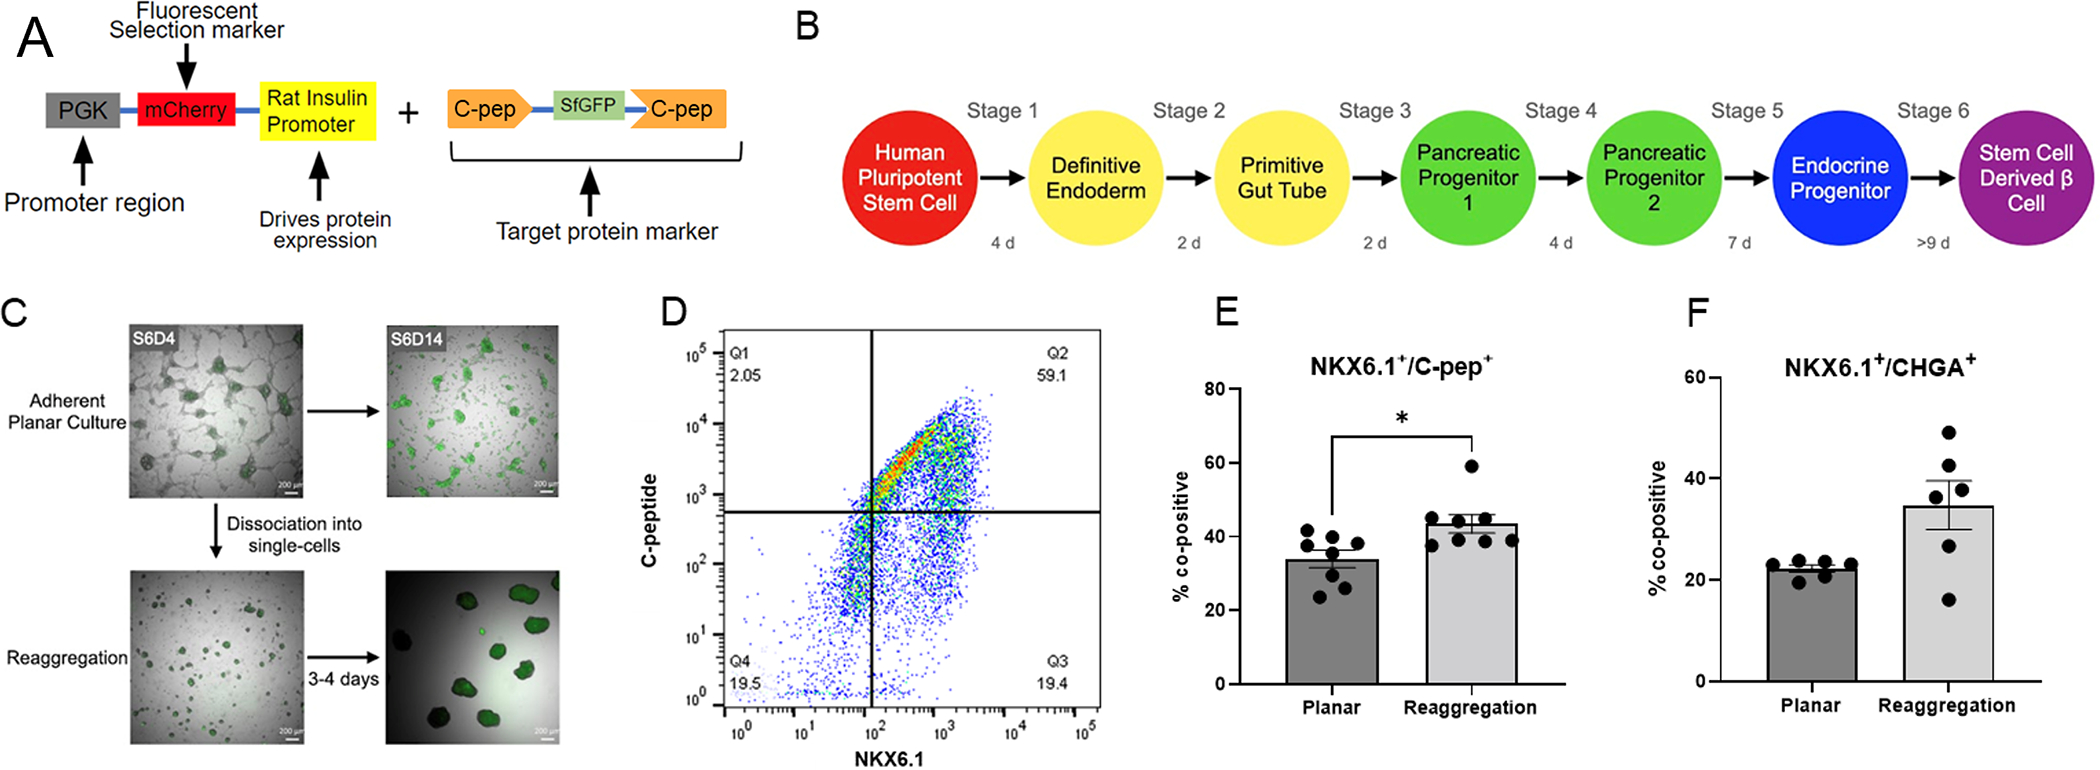
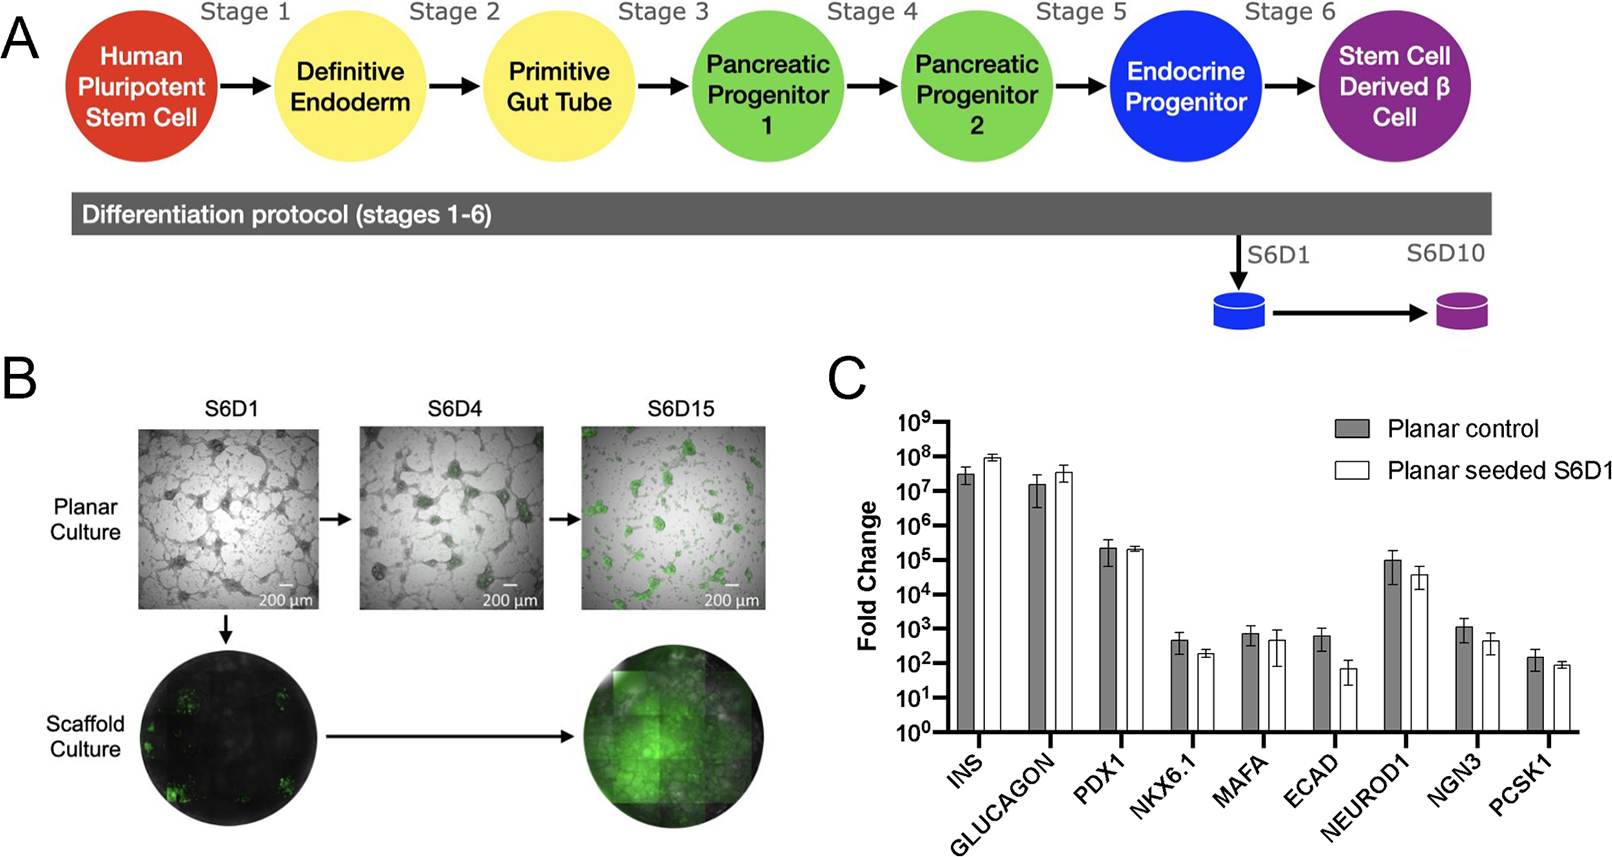
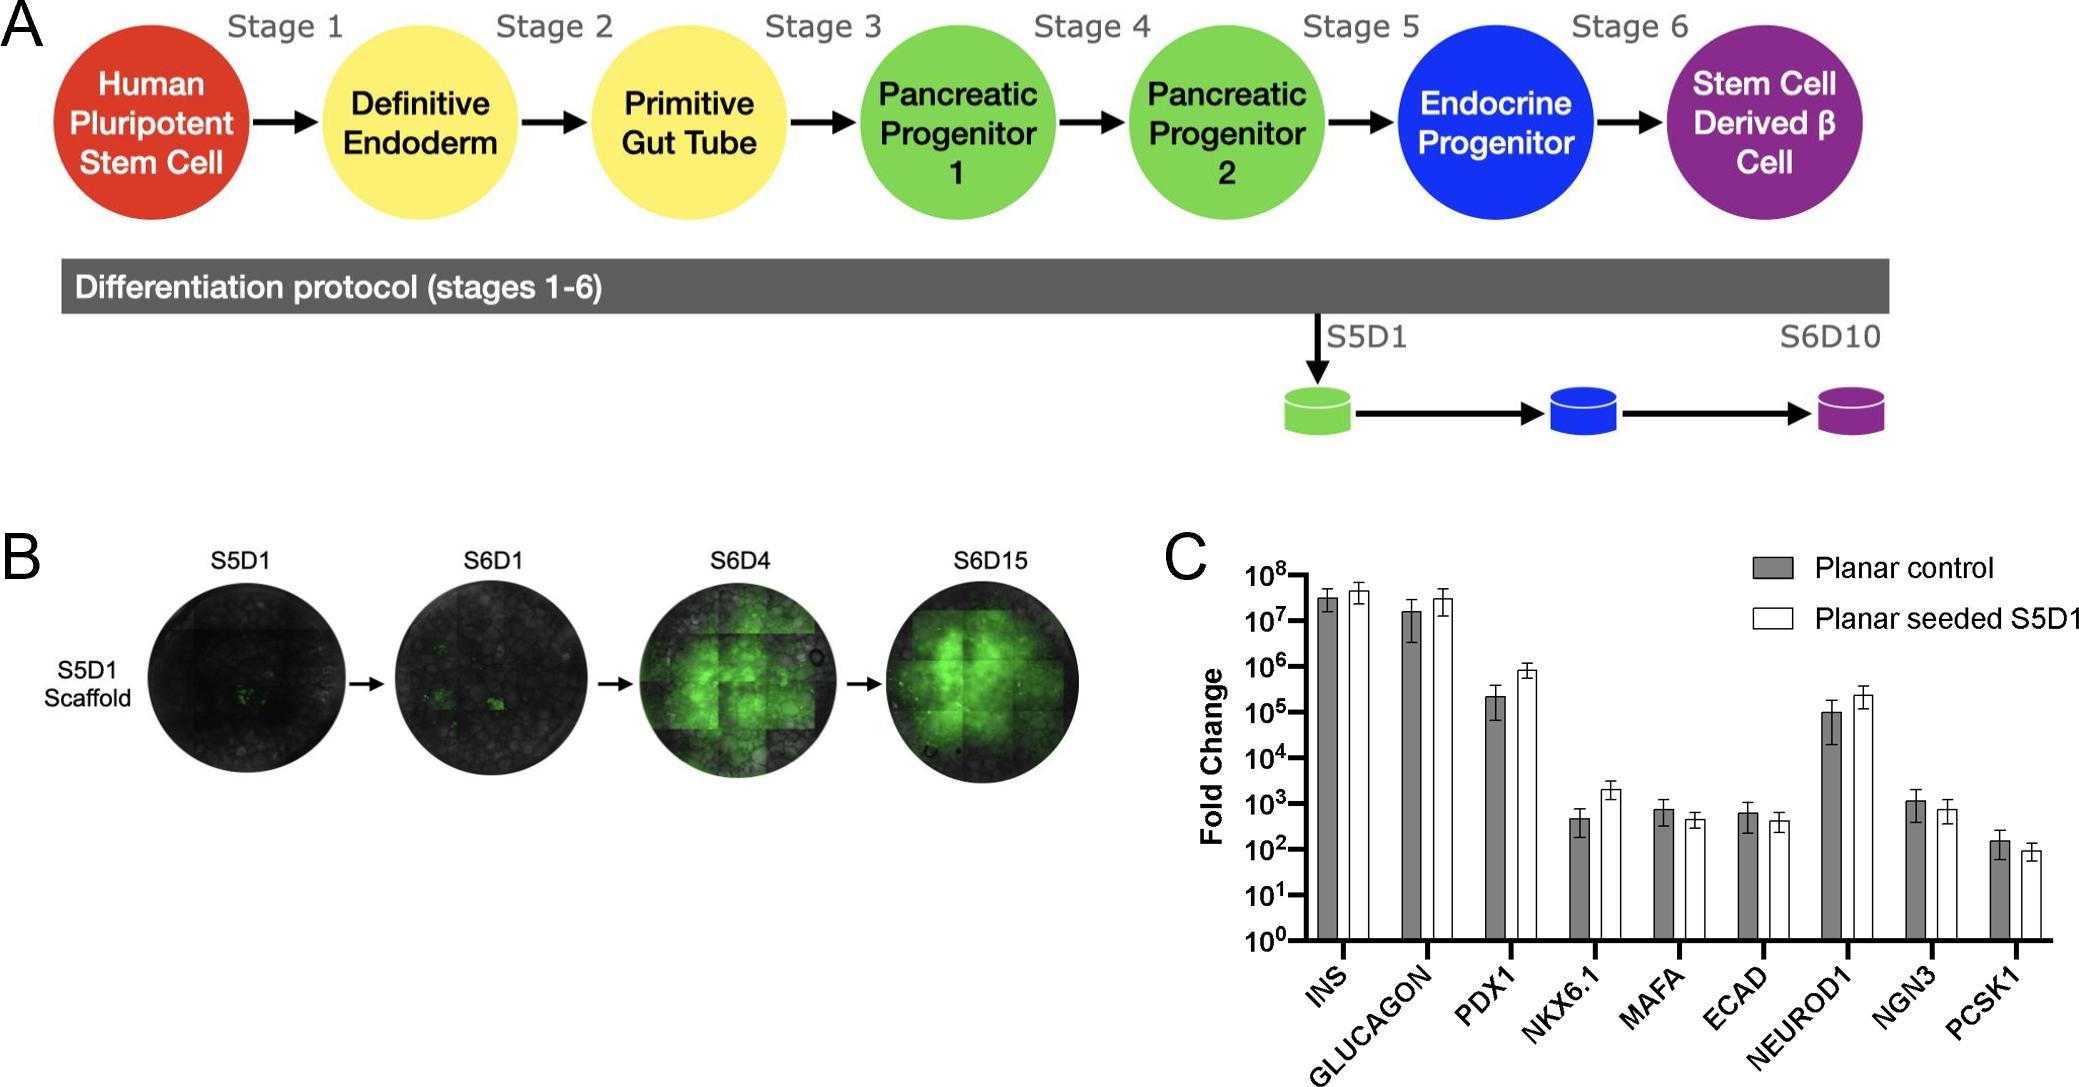
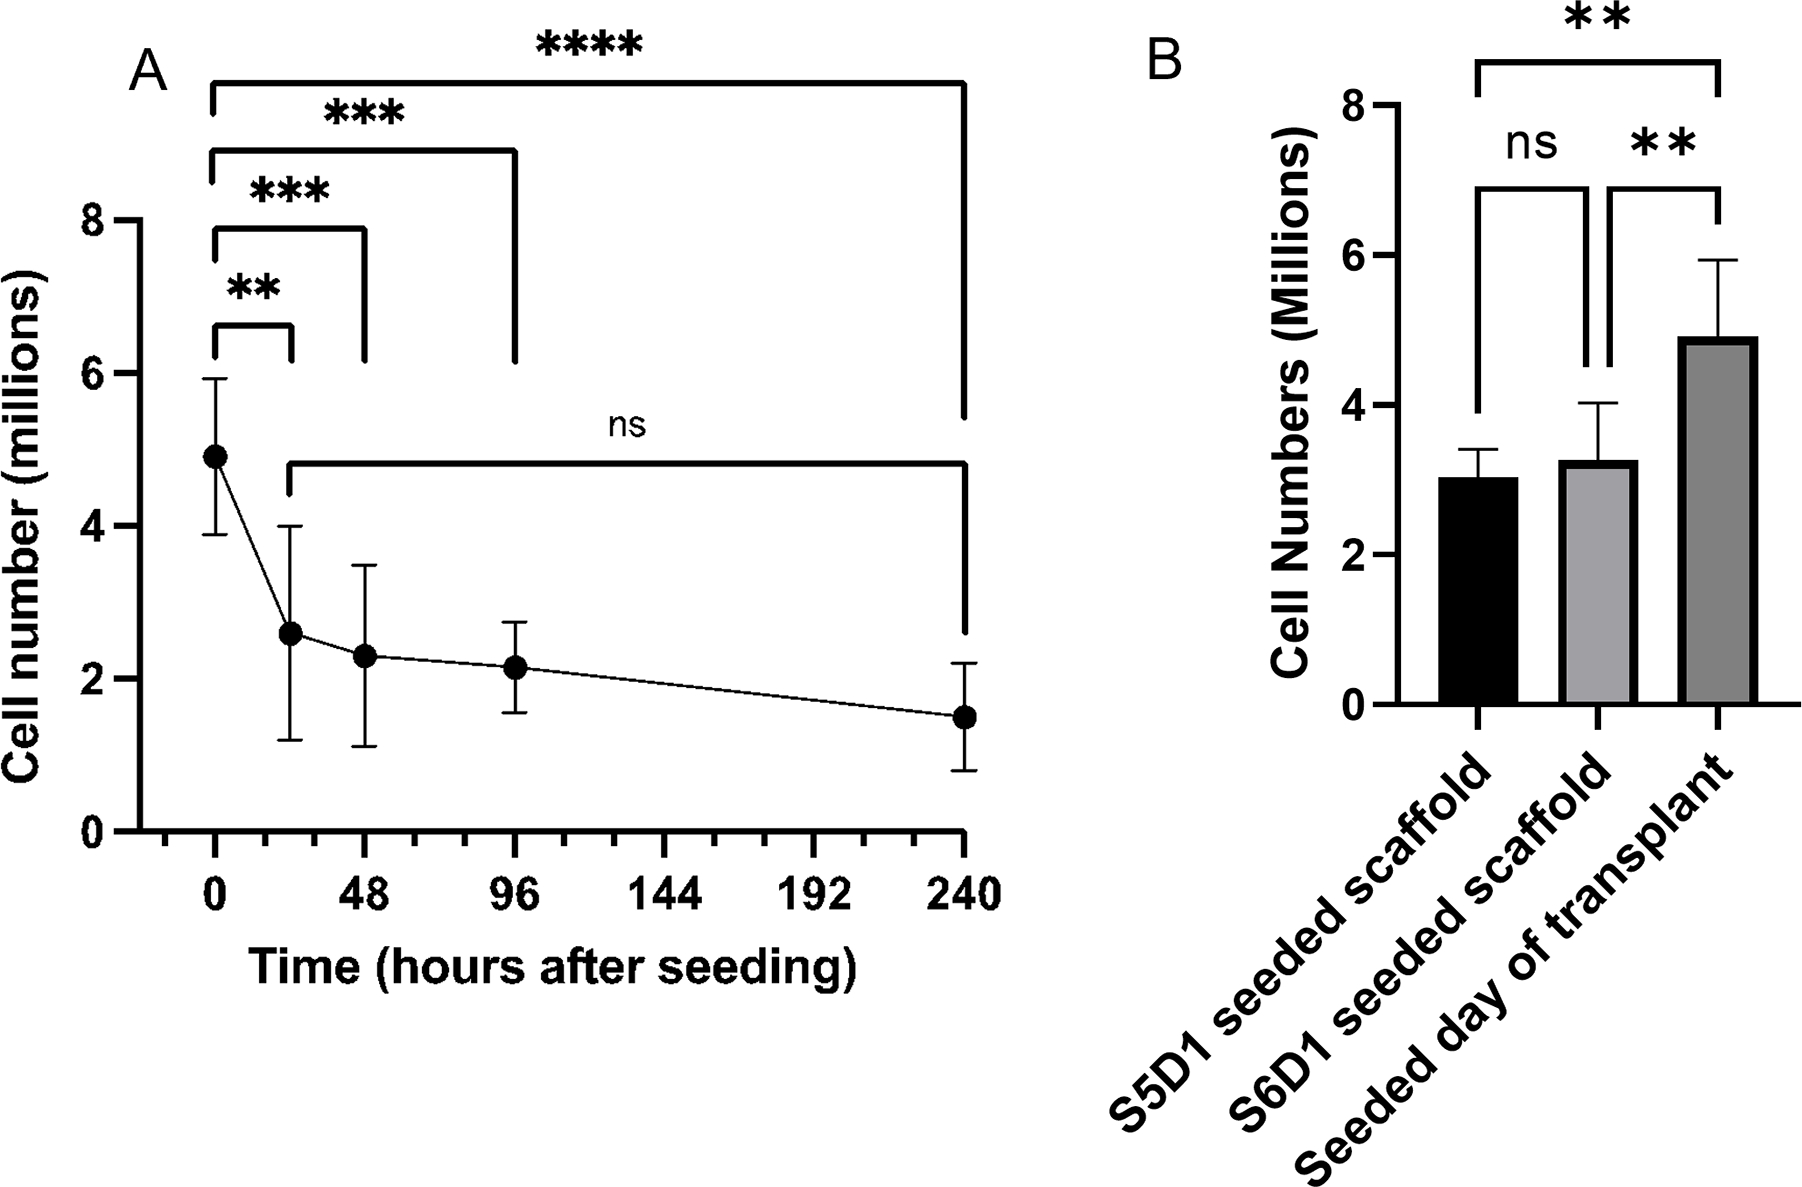
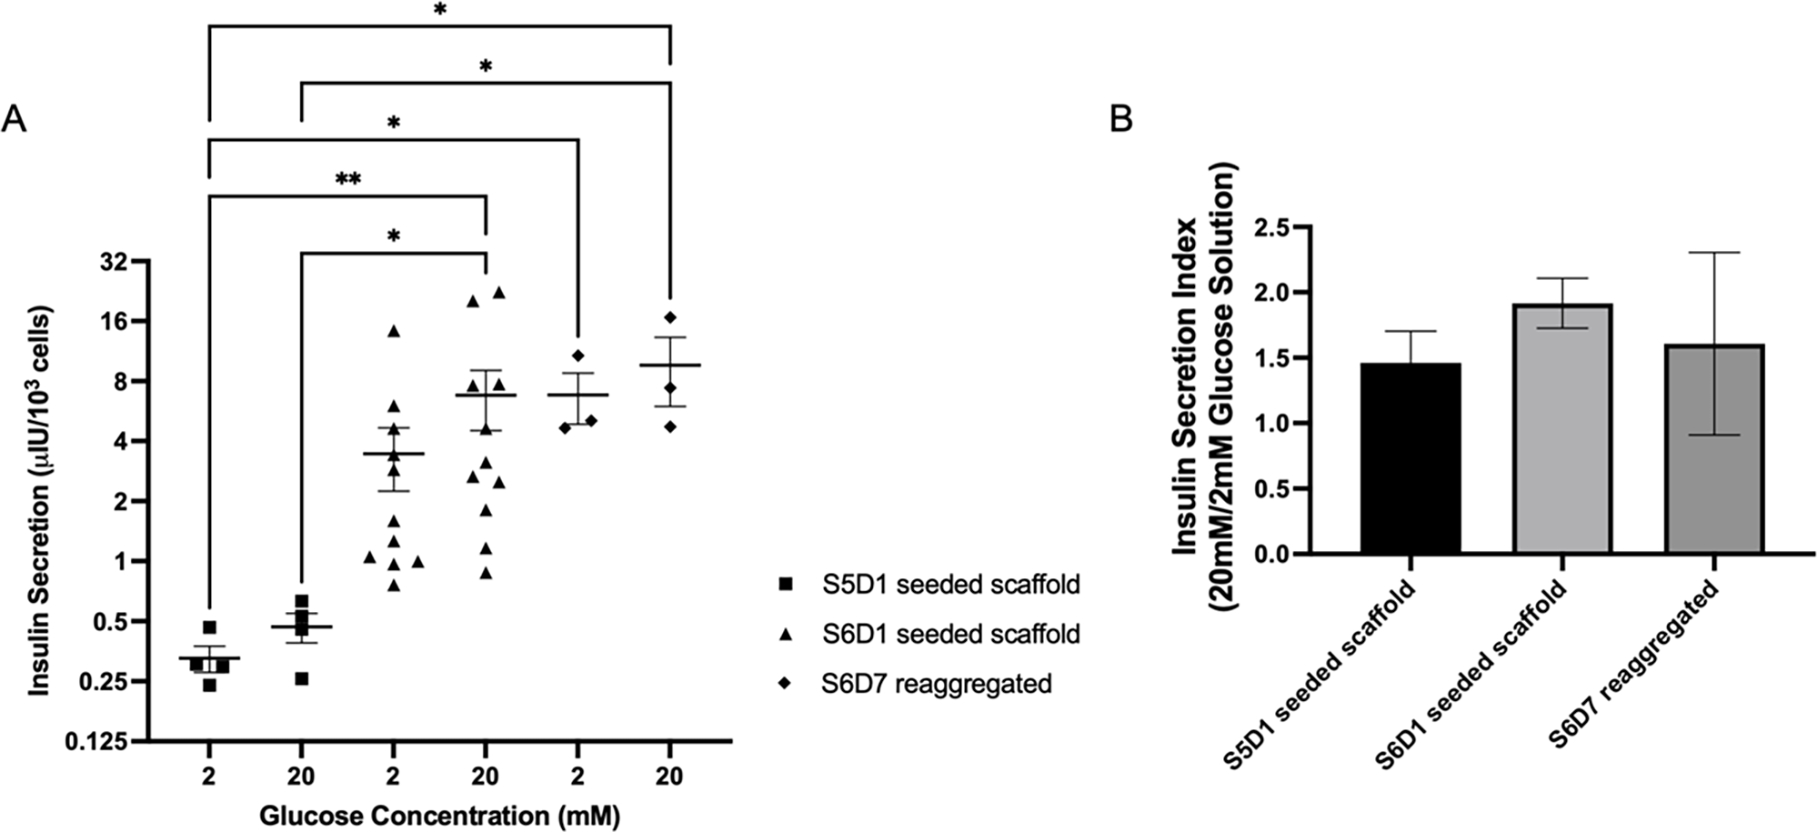
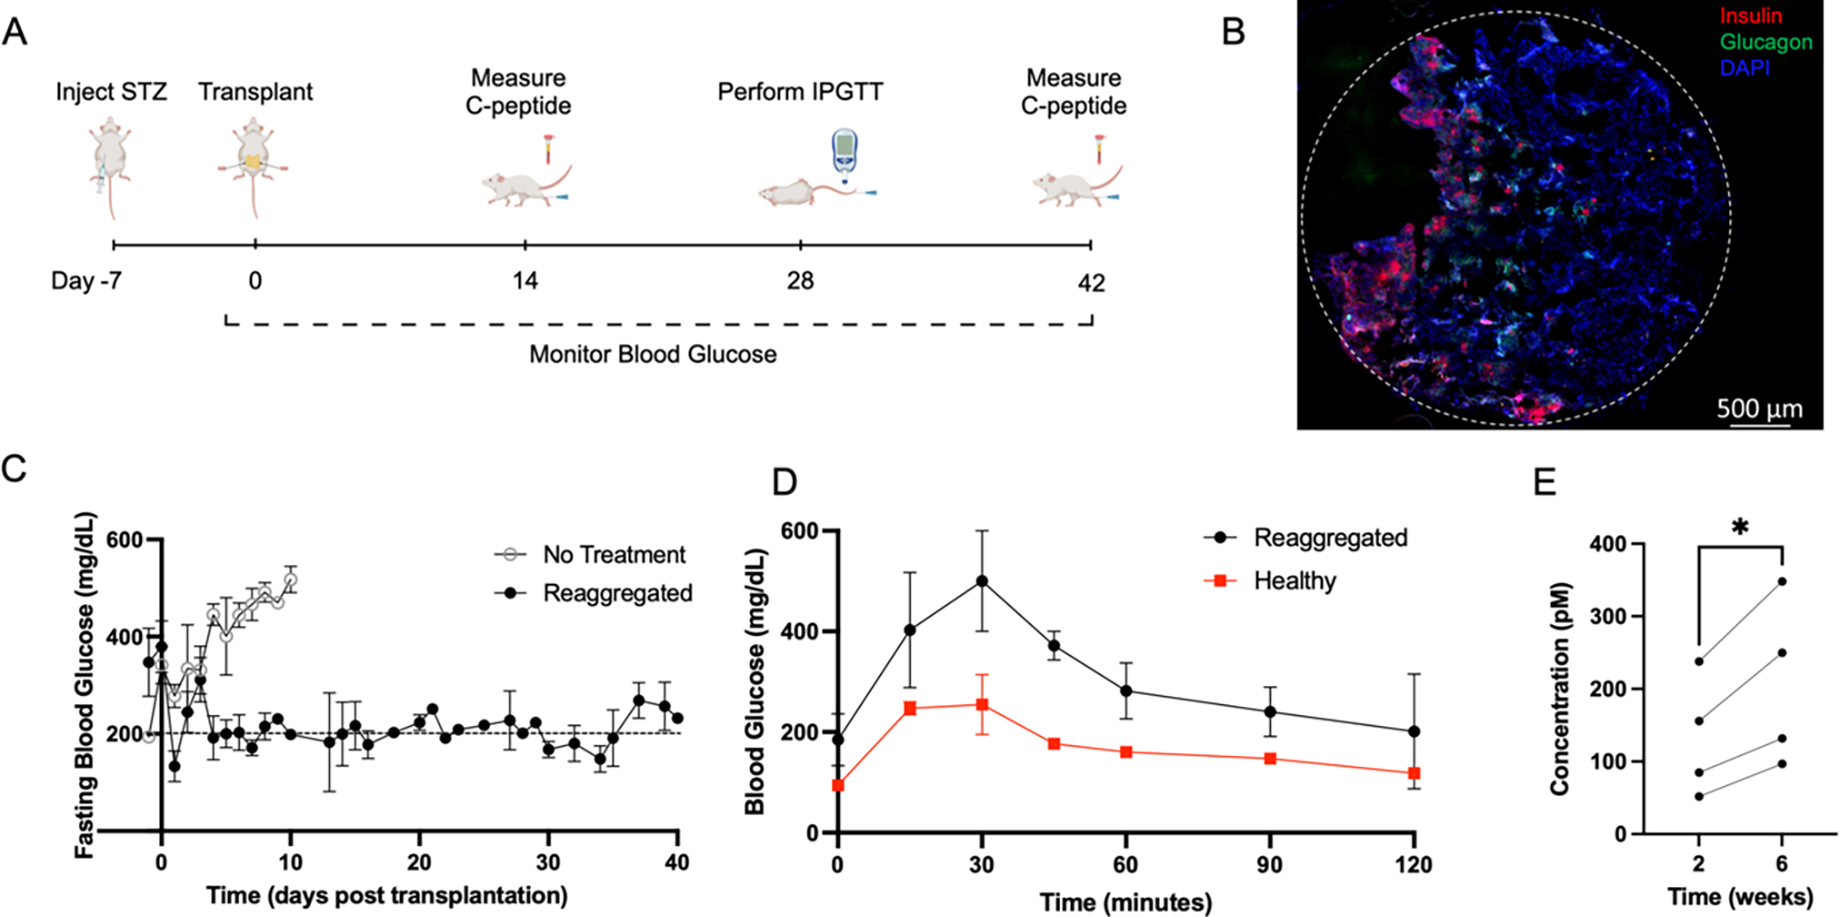
Stem cell differentiation methods have been developed to produce cells capable of insulin secretion which are showing promise in clinical trials for treatment of type-1 diabetes. Nevertheless, opportunities remain to improve cell maturation and function. Three-dimensional (3D) culture has demonstrated improved differentiation and metabolic function in organoid systems, with biomaterial scaffolds employed to direct cell assembly and facilitate cell-cell contacts. Herein, we investigate 3D culture of human stem cell-derived islet organoids, with 3D culture initiated at the pancreatic progenitor, endocrine progenitor, or immature β-cell stage. Clusters formed by reaggregation of immature β-cells could be readily seeded into the microporous poly(lactide-co-glycolide) scaffold, with control over cell number. Culture of islet organoids on scaffolds at the early to mid-stage beta cell progenitors had improved in vitro glucose stimulated insulin secretion relative to organoids formed at the pancreatic progenitor stage. Reaggregated islet organoids were transplanted into the peritoneal fat of streptozotocin-induced diabetic mice, which resulted in reduced blood glucose levels and the presence of systemic human C-peptide. In conclusion, 3D cell culture supports development of islet organoids as indicated by insulin secretion in vitro and supports transplantation to extrahepatic sites that leads to a reduction of hyperglycemia in vivo.


Conflict of interest statement

Conflicts of Interest: There are no conflicts to declare.

Figures

Figure 1.
Figure 1.
(A) Schematic of the sfGFP-Cpep Fluorescent Insulin Reporter. (B) Schematic of culture timeline. (C) Representative brightfield images of cells in planar culture and after reaggregation during the stem cell-derived β-cell stage. 488 channel overlaid with brightfield images indicates insulin secretion of reaggregated and planar cells. (D) Representative image of flow analysis of Cpep+/NKX6.1+ after reaggregation. (E) Comparison of Cpep+/NKX6.1+ populations analyzed with flow cytometry before and after reaggregation (n= 9 Planar, n=9 Reaggregation). (F) Comparison of CHGA+/NKX6.1+ populations analyzed with flow cytometry before and after reaggregation (n=6 Planar, n=6 Reaggregation).
Figure 2.
Figure 2.
(A) Schematic of differentiation protocol including scaffold seeding at Stage 6 Day 1 (S6D1). (B) Fluorescent images of planar culture cells (top) and scaffold culture (bottom) throughout stage 6 of differentiation. 488 channel overlaid with brightfield images to demonstrate sfGFP expression aligned with cells. (C) Gene expression at Stage 6 Day 10 of planar cultured cells compared to planar cells seeded onto a scaffold at Stage 6 Day 1 (n=6 Planar control, n=16 Planar seeded S6D1).
Figure 3.
Figure 3.
(A) Schematic of differentiation protocol including scaffold seeding at Stage 5 Day 1 (S5D1). (B) Fluorescent images throughout stage 5 and 6 of differentiation. (C) Gene expression at Stage 6 Day 10 of planar cultured cells compared to planar cells seeded onto a scaffold at Stage 5 Day 1 (n=6 Planar control, n=12 Planar seeded S5D1).
Figure 4.
Figure 4.
(A) Cell number at various time points after seeding cells S6D1 on the scaffold and continuing cell culture on the scaffold. Scaffolds were analyzed right after seeding, at 24, 48, 96, and 240 hours. Stage media was changed on the scaffold similarly to planar culture. (n=5: 2 hours, n=8: 24 hours, n=8: 48 hours, n=8: 96 hours, n=13: 240 hours). **P<0.01, ***P<0.001, ****P<0.0001. (B) Cell number at the end of differentiation (S6D10) when comparing different seeding starting times. Cells seeded at S5D1 are on the scaffold for about 17 days and 10 days for cells seeded at S6D1. Samples taken the day of transplant were after a brief (2 hour) incubation. (n=5 S5D1 seeded scaffold, n=10 S6D1 seeded scaffold, n=5 Seeded day of transplant). **P<0.01.
Figure 5.
Figure 5.
(A) Insulin secretion normalized to cell number during glucose-stimulated insulin secretion assays performed at Stage 6 Day 10 from scaffolds seeded at Stage 5 Day 1 with planar cells (squares), scaffolds seeded at Stage 6 Day 1 with planar cells (triangles), and planar cells reaggregated at Stage 6 Day 7 (diamonds). Cell number determined by PicoGreen for scaffold conditions and reaggregated. Planar cell number counted using hemocytometer after dissociation. Kruskal-Wallis test with Dunn’s multiple comparisons test performed. Significance level of α=0.05 used (n=4 S5D1 seeded scaffold, n=11 S6D1 seeded scaffold, n=3 S6D7 reaggregated), *P<0.05, **P<0.01. (B) Insulin secretion indexes for each condition.
Figure 6.
Figure 6.
(A) Timeline of in vivo studies, including timepoints induction of diabetes, transplantation of scaffolds to the peritoneal fat, collection of blood serum, and intraperitoneal testing of glucose tolerance. (B) Representative image of a scaffold section explanted after 14 days in vivo indicating survival of transplanted islet organoids. Scaffolds were cryosectioned and stained for human insulin (red), human glucagon (green) and DAPI (blue). The dashed line indicates the circumference of the scaffold. (C) Fasting blood glucose measurements from STZ-induced diabetic mice that received 10M reaggregated cells transplanted on two PLG scaffolds (5M cells/scaffold) (n=3) or no treatment (n=4). Mice were fasted for 4–6 hours prior to blood glucose readings. Blood glucose was measured daily for at least 10 days following transplantation, then 3 times per week for the duration of the study. (D) Blood glucose measurements taken during intraperitoneal glucose tolerance testing of mice that received reaggregated cells (S6D7) transplanted on PLG scaffolds (n=2) and healthy mice (n=2). Mice were fasted for 4–6 hours, then received an intraperitoneal injection of glucose at 2g/kg body weight at t=0. Average area under the curve for treated mice was 37,042 and for healthy mice was 20,655. (E) Circulating C-peptide levels at 2- and 6-weeks post transplantation, measured from serum collected through saphenous vein blood draw. Paired t-test performed using repeated measures from four mice at both time points. Significance level of α=0.05 used.

References

    1. Cryer PE, Diabetes 2008, 57, 3169. - PMC - PubMed
    1. Pambianco G, Costacou T, Ellis D, Becker DJ, Klein R, Orchard TJ, Diabetes 2006, 55, 1463. - PubMed
    1. Kalra S, Mukherjee J, Venkataraman S, Bantwal G, Shaikh S, Saboo B, Das A, Ramachandran A, Indian J Endocr Metab 2013, 17, 819. - PMC - PubMed
    1. Shapiro AMJ, Lakey JRT, Ryan EA, Korbutt GS, Toth E, Warnock GL, Kneteman NM, Rajotte RV, N Engl J Med 2000, 343, 230. - PubMed
    1. Shapiro AMJ, Auchincloss H, Secchi A, Brennan DC, Ryan EA, Polonsky KS, Bertuzzi F, Sutherland DER, Segal M, Barton FB, et al. , n engl j med 2006.