. 2023 Jun 15;207(12):1620-1632.
doi: 10.1164/rccm.202206-1223OC.

Pulse Wave Amplitude Drops Index: A Biomarker of Cardiovascular Risk in Obstructive Sleep Apnea

Affiliations

Pulse Wave Amplitude Drops Index: A Biomarker of Cardiovascular Risk in Obstructive Sleep Apnea

Geoffroy Solelhac et al. Am J Respir Crit Care Med. .

Erratum in

Abstract

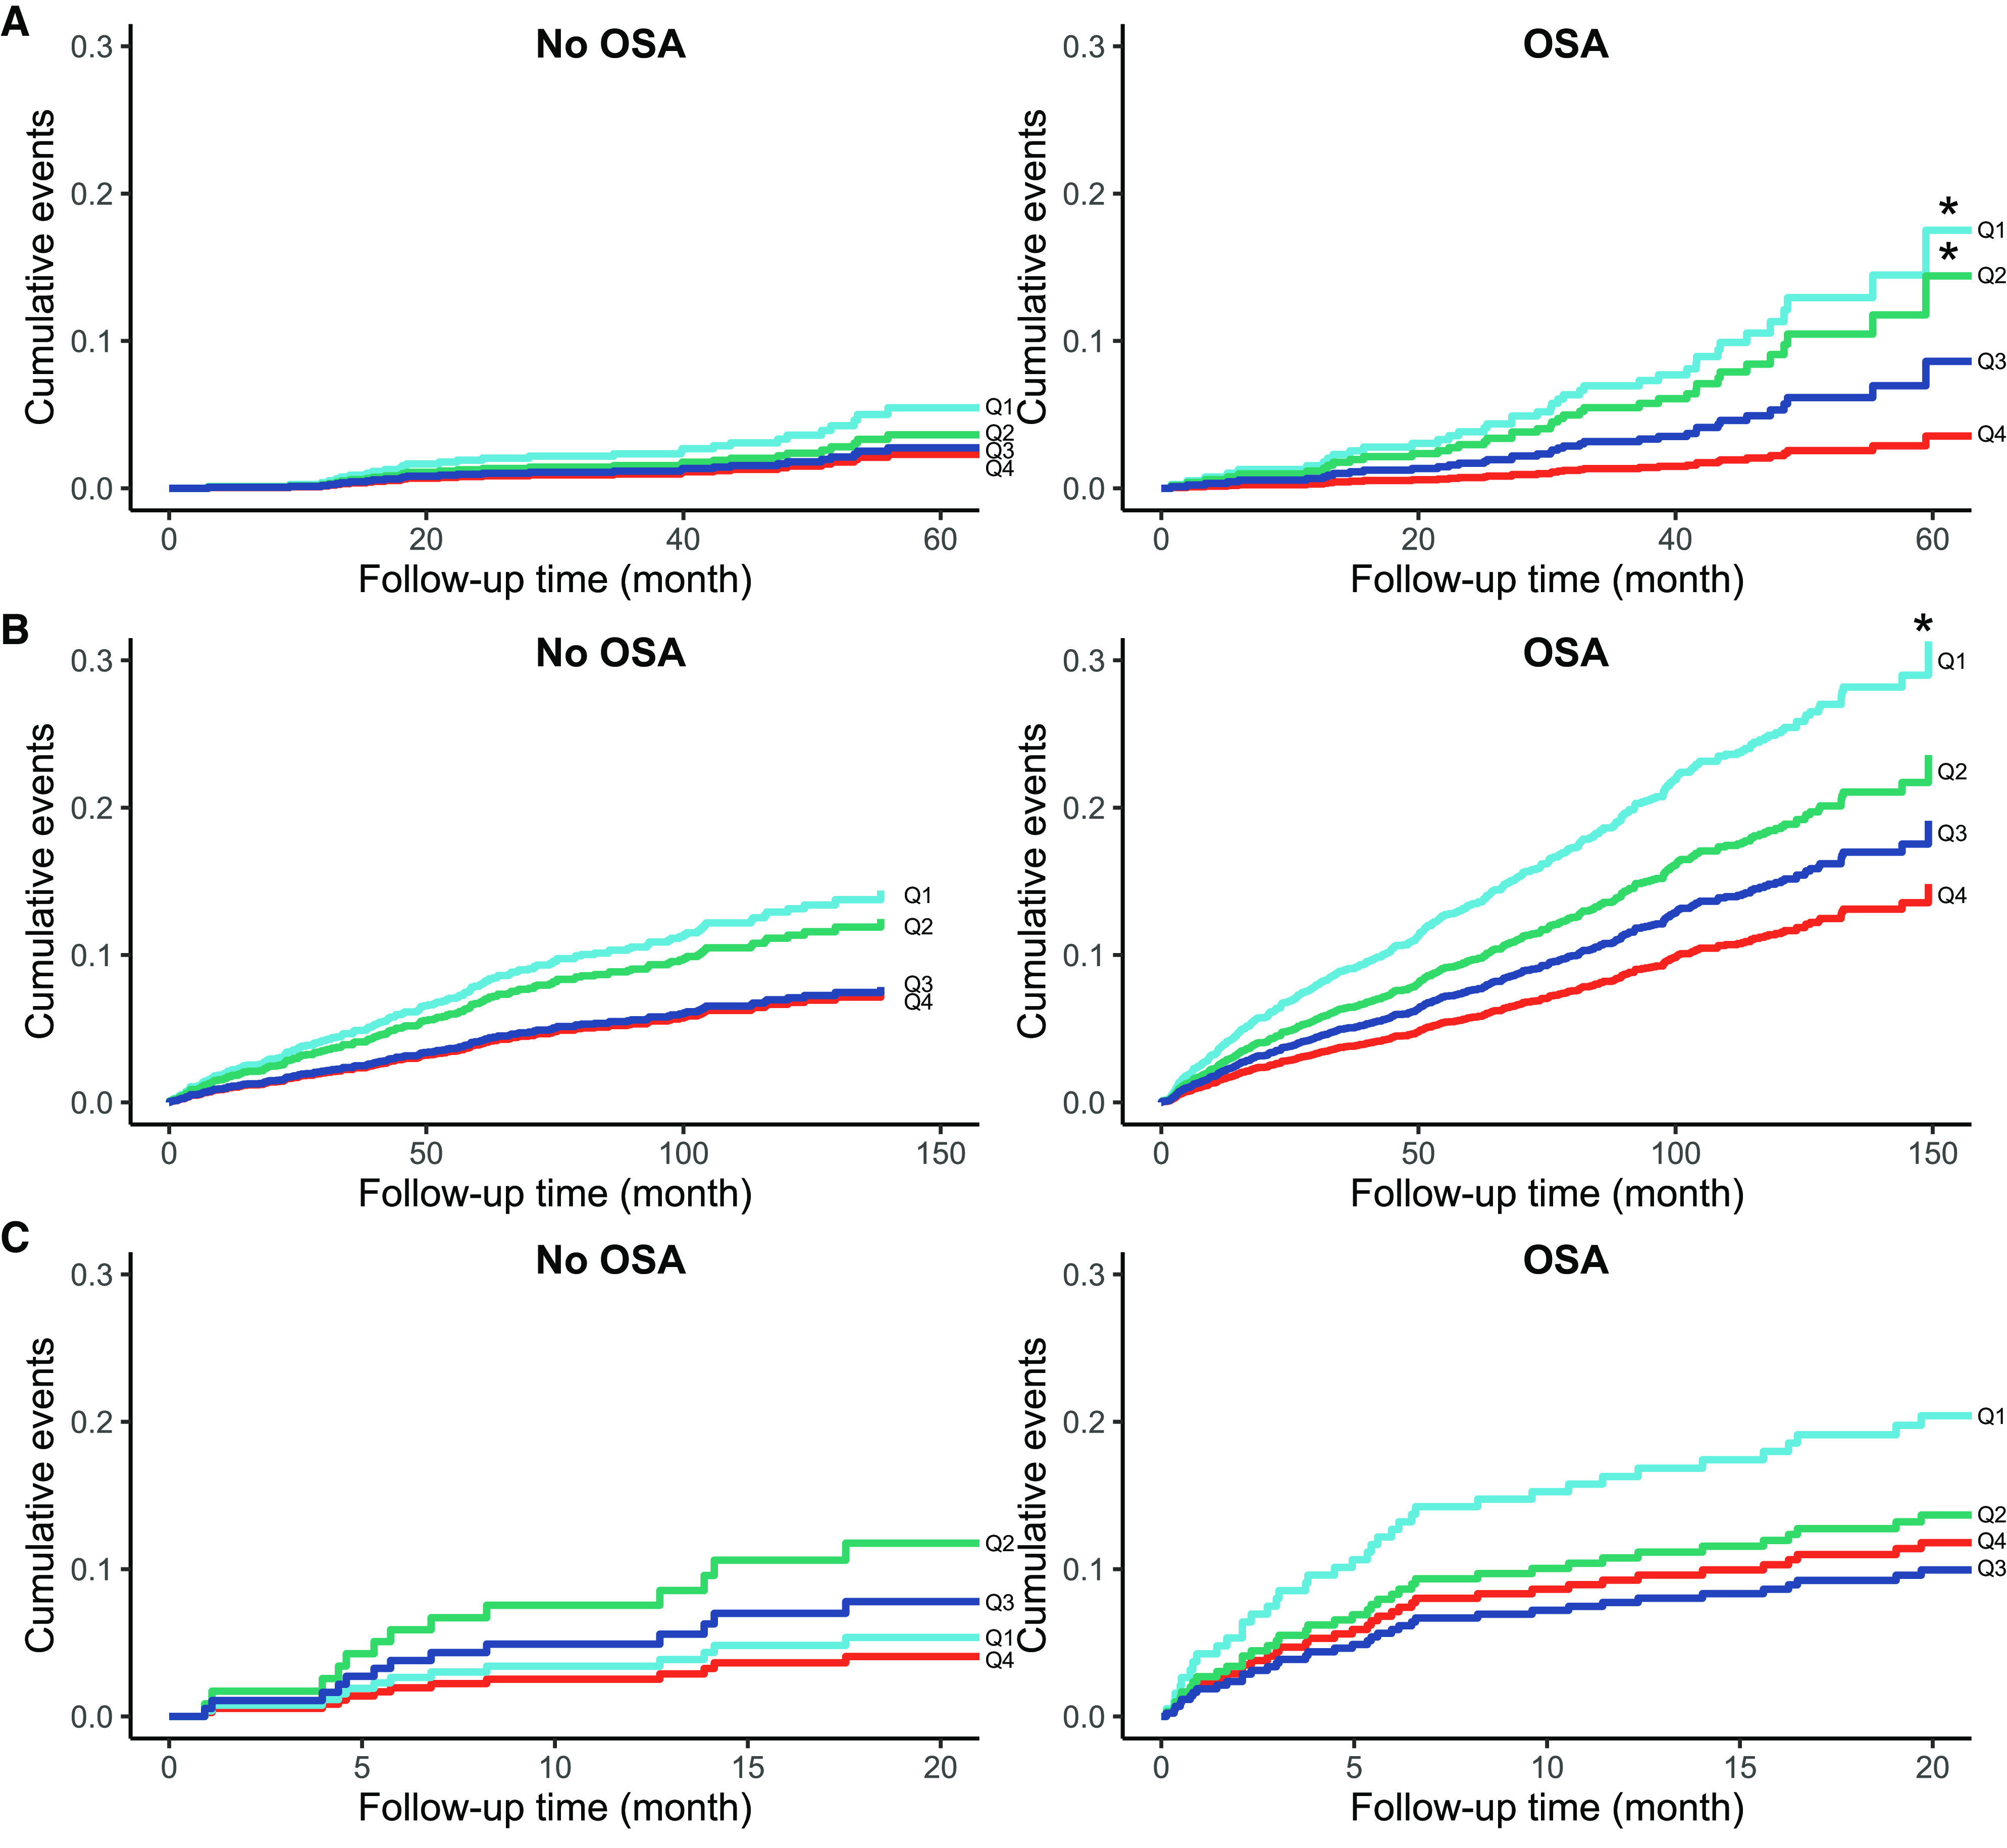
Rationale: It is currently unclear which patients with obstructive sleep apnea (OSA) are at increased cardiovascular risk. Objective: To investigate the value of pulse wave amplitude drops (PWADs), reflecting sympathetic activations and vasoreactivity, as a biomarker of cardiovascular risk in OSA. Methods: PWADs were derived from pulse oximetry-based photoplethysmography signals in three prospective cohorts: HypnoLaus (N = 1,941), the Pays-de-la-Loire Sleep Cohort (PLSC; N = 6,367), and "Impact of Sleep Apnea syndrome in the evolution of Acute Coronary syndrome. Effect of intervention with CPAP" (ISAACC) (N = 692). The PWAD index was the number of PWADs (>30%) per hour during sleep. All participants were divided into subgroups according to the presence or absence of OSA (defined as ⩾15 or more events per hour or <15/h, respectively, on the apnea-hypopnea index) and the median PWAD index. Primary outcome was the incidence of composite cardiovascular events. Measurements and Main Results: Using Cox models adjusted for cardiovascular risk factors (hazard ratio; HR [95% confidence interval]), patients with a low PWAD index and OSA had a higher incidence of cardiovascular events compared with the high-PWAD and OSA group and those without OSA in the HypnoLaus cohort (HR, 2.16 [1.07-4.34], P = 0.031; and 2.35 [1.12-4.93], P = 0.024) and in the PLSC (1.36 [1.13-1.63], P = 0.001; and 1.44 [1.06-1.94], P = 0.019), respectively. In the ISAACC cohort, the low-PWAD and OSA untreated group had a higher cardiovascular event recurrence rate than that of the no-OSA group (2.03 [1.08-3.81], P = 0.028). In the PLSC and HypnoLaus cohorts, every increase of 10 events per hour in the continuous PWAD index was negatively associated with incident cardiovascular events exclusively in patients with OSA (HR, 0.85 [0.73-0.99], P = 0.031; and HR, 0.91 [0.86-0.96], P < 0.001, respectively). This association was not significant in the no-OSA group and the ISAACC cohort. Conclusions: In patients with OSA, a low PWAD index reflecting poor autonomic and vascular reactivity was independently associated with a higher cardiovascular risk.

Keywords: PWAD; cardiovascular risk; pulse oximeter; pulse wave amplitude; sleep apnea.


Figures

Figure 1.
Figure 1.
PPG and PWA assessment. PPG = photoplethysmography; PWA = pulse wave amplitude; PWAD = pulse wave amplitude drop.
Figure 2.
Figure 2.
PWAD index distributions in the three different cohorts. Values are presented as hazard ratios and 95% confidence intervals. PLSC = Pays de la Loire Sleep Cohort; PWAD = pulse wave amplitude drop.
Figure 3.
Figure 3.
HypnoLaus study: adjusted Cox regression curves showing the incidence of composite cardiovascular events on the basis of (A) the presence or absence of obstructive sleep apnea (OSA+ and OSA– , respectively) and (B) OSA+ or OSA– and high or low pulse wave amplitude drop (PWAD) index. Models were adjusted for age (continuous), sex (categorical), body mass index (continuous), weekly alcohol consumption (continuous), smoking (continuous), diabetes (categorical), hypertension (categorical), lipid-lowering drugs (categorical), and vasodilators (categorical). Group description (n, median PWAD index value as n/h [95% confidence interval]): OSA– (1,251, 51.4 [37.2–64.5]), OSA+ (690, 52.4 [38.9–67.6]), OSA–/high PWAD index (629, 64.3 [57.9–73.1]), OSA–/low PWAD index (618, 37.1 [26.9–44.5]), OSA+/high PWAD index (359, 66.3 [58.4–75.2]), and OSA+/low PWAD index (323, 38.4 [28.4–44.9]). aP = 0.031 for OSA+/low PWAD index versus OSA+/high PWAD index. bP = 0.045 for OSA+/low PWAD index versus OSA–/low PWAD index. cP = 0.024 for OSA+/low PWAD index versus OSA–/high PWAD index. *P < 0.05, statistically significant. NS = not statistically significant.
Figure 4.
Figure 4.
Adjusted Cox regression curves showing the incidence or recurrence of cardiovascular events on the basis of pulse wave amplitude drop index quartiles (Qs) in the presence (right) or absence (left) of obstructive sleep apnea (OSA) in the three cohorts: *P < 0.05 and **P < 0.01, statistically significant. Models were adjusted according to the same variables as described in Figure 3 for HypnoLaus, Figure 5 for Pays de la Loire Sleep Cohort (PLSC), and Figure 7 for ISAACC. Values for each cohort are hazard ratios and 95% confidence intervals (HRs [95% CIs]). (A) HRs [95% CIs] for the HypnLaus cohort. No OSA: Q4 versus Q1, 1.27 [0.41–3.88], P = 0.677; Q4 versus Q2, 1.32 [0.43–4.07], P = 0.629; Q4 versus Q3, 1.004 [0.30–3.55], P = 0.994. OSA: Q4 versus Q1, 3.09 [1.00–9.55], P = 0.049; Q4 versus Q2, 3.43 [1.05–11.1], P = 0.041; and Q4 versus Q3, 2.50 [0.69–9.12], P = 0.165. No OSA quartiles (events/h): Q1, 0.23–37.11; Q2: 37.11–51.29; Q3: 51.29–64.52; and Q4: 64.52–119.14. OSA quartiles (events/h): Q1: 0.14–38.80; Q2: 38.80–52.36; Q3: 52.36–67.26; and Q4: 67.26–111.76. (B) HRs [95% CIs] for the PLSC. No OSA: Q4 versus Q1, 1.00 [0.65–1.53], P = 0.984; Q4 versus Q2, 1.10 [0.72–1.69], P = 0.652; and Q4 versus Q3, 0.80 [0.50–1.28], P = 0.356. OSA: Q4 versus Q1, 1.55 [1.18–2.04], P = 0.002; Q4 versus Q2, 1.30 [0.98–1.72], P = 0.069; and Q4 versus Q3, 1.11 [0.83, 1.49], P = 0.467. No OSA quartiles (event/h): Q1, 0.50–31.60; Q2, 31.60–44.08; Q3, 44.08–56.44; and Q4, 56.44–118.18. OSA quartiles (event/h): Q1, 2.20–35.39; Q2, 35.39–49.34; Q3, 49.34–62.78; and Q4, 62.78–126.36. (C) HRs [95% CIs] for the ISAACC cohort. No OSA: Q4 versus Q1, 0.50 [0.06–4.02], P = 0.512; Q4 versus Q2, 1.34 [0.24–7.25], P = 0.736; and Q4 versus Q3, 1.29 [0.21–7.72], P = 0.780. OSA: Q4 versus Q1, 1.26 [0.58–2.97], P = 0.520; Q4 versus Q2, 1.00 [0.41–2.44], P = 0.992; Q4 versus Q3, 0.79 [0.32–1.98], P = 0.628. No OSA quartiles (event/h): Q1, 4.44–23.19; Q2, 23.19–35.79; Q3, 35.79–47.90; and Q4, 47.90–92.81. OSA quartiles (events/h): Q1, 1.70–24.76; Q2, 24.76–40.30; Q3, 40.30–53.08; and Q4, 53.08–118.10.
Figure 5.
Figure 5.
Pays de la Loire Sleep Cohort: adjusted Cox regression curves showing the incidence of major adverse cardiovascular events on the basis of the presence or absence of obstructive sleep apnea (OSA+ and OSA–, respectively) and high or low pulse wave amplitude drop (PWAD) index. Models were adjusted for age (continuous), sex (categorical), body mass index (continuous), diabetes (categorical), hypertension (categorical), smoking status (categorical), type of sleep study (categorical), study site (categorical), β blocker/calcium channel blocker medications (categorical), and treatment status (categorical). Group description (n, median PWAD index value as n/h [95% confidence interval]): OSA–/high PWAD index (1,182, 58.5 [52.2–67.2]), OSA–/low PWAD index (1,522, 33.3 [24.2–40.0]), OSA+/high PWAD index (2,001, 61.1 [53.8–70.7]), and OSA+/low PWAD index (1,662, 33.9 [25.7–40.7]). aP = 0.001 for OSA+/low PWAD index versus OSA+/high PWAD index. bP = 0.410 for OSA+/low PWAD index versus OSA–/low PWAD index. cP = 0.019 for OSA+/low PWAD index versus OSA–/high PWAD index. *P < 0.05, statistically significant.
Figure 6.
Figure 6.
Pays de la Loire Sleep Cohort: adjusted Cox regression curves showing the incidence of major adverse cardiovascular events on the basis of the use of (or not using) continuous positive airway pressure (CPAP) in high (left) or low (right) pulse wave amplitude drop (PWAD) index. Models were adjusted for age (continuous), sex (categorical), body mass index (continuous), diabetes (categorical), hypertension (categorical), smoking status (categorical), type of sleep study (categorical), study site (categorical), β blocker/calcium channel blocker medications (categorical), and treatment status (categorical). Group description (n, median PWAD index value as n/h [95% confidence interval]): high PWAD index-CPAP adherent (1,382, 60.7 [53.7–70.3]), high PWAD index-no CPAP adherent (454, 61.3 [52.9–69.6]), low PWAD index-CPAP adherent (1,308, 33.2 [24.1–40.8]), and low PWAD index-no CPAP adherent (525, 33.3 [25.8–39.9]). HR = hazard ratio.
Figure 7.
Figure 7.
ISAACC study: adjusted Cox regression curves showing incident or recurrent cardiovascular events based on low or high pulse wave amplitude drop (PWAD) index and treatment with continuous positive airway pressure (CPAP) or usual care for participants with obstructive sleep apnea (OSA) compared with the control group without OSA. Models were adjusted for age (continuous), sex (categorical), body mass index (continuous), alcohol (categorical), smoking (categorical), diabetes (categorical), hypertension (categorical), lipid-lowering drugs (categorical), and vasodilators (categorical). Group description (n, median PWAD index value as n/h [95% confidence interval]): no OSA (164, 34.0 [22.7–46.7]); OSA-CPAP/high PWAD index (151, 54.6 [47.3–63.0]); OSA-CPAP/low PWAD index (112, 25.5 [19.7–32.0]); OSA-usual care and high PWAD index (129, 53.1 [46.7–62.8]); and OSA-usual care and low PWAD index (135, 24.4 [18.5–31.0]). *P = 0.028 for OSA-usual care and low PWAD index versus no OSA; P = 0.110 for OSA-CPAP/high PWAD index versus no OSA; P = 0.102 for OSA-CPAP/low PWAD index group versus no OSA; P = 0.208 for OSA-usual care and high PWAD index group versus no OSA.

Comment in

Similar articles

Cited by

References

    1. Pevernagie DA, Gnidovec-Strazisar B, Grote L, Heinzer R, McNicholas WT, Penzel T, et al. On the rise and fall of the apnea-hypopnea index: a historical review and critical appraisal. J Sleep Res . 2020;29:e13066. - PubMed
    1. Malhotra A, Ayappa I, Ayas N, Collop N, Kirsch D, McArdle N, et al. Metrics of sleep apnea severity: beyond the apnea-hypopnea index. Sleep . 2021;44:zsab030. - PMC - PubMed
    1. McEvoy RD, Antic NA, Heeley E, Luo Y, Ou Q, Zhang X, et al. SAVE Investigators and Coordinators CPAP for prevention of cardiovascular events in obstructive sleep apnea. N Engl J Med . 2016;375:919–931. - PubMed
    1. Peker Y, Glantz H, Eulenburg C, Wegscheider K, Herlitz J, Thunström E. Effect of positive airway pressure on cardiovascular outcomes in coronary artery disease patients with nonsleepy obstructive sleep apnea. The RICCADSA randomized controlled trial. Am J Respir Crit Care Med . 2016;194:613–620. - PubMed
    1. Sánchez-de-la-Torre M, Sánchez-de-la-Torre A, Bertran S, Abad J, Duran-Cantolla J, Cabriada V, et al. Effect of obstructive sleep apnoea and its treatment with continuous positive airway pressure on the prevalence of cardiovascular events in patients with acute coronary syndrome (ISAACC study): a randomised controlled trial. Lancet Respir Med . 2019;8:359–367. - PubMed

Publication types