Review
. 2023 Apr 27;66(8):5377-5396.
doi: 10.1021/acs.jmedchem.3c00134. Epub 2023 Apr 5.

Macrocycles in Drug Discovery─Learning from the Past for the Future

Affiliations
Review

Macrocycles in Drug Discovery─Learning from the Past for the Future

Diego Garcia Jimenez et al. J Med Chem. .

Abstract

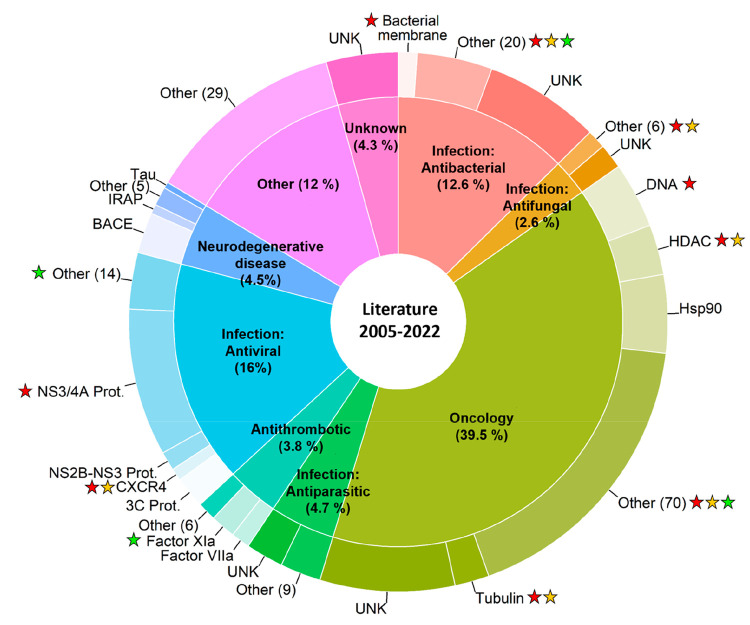
We have analyzed FDA-approved macrocyclic drugs, clinical candidates, and the recent literature to understand how macrocycles are used in drug discovery. Current drugs are mainly used in infectious disease and oncology, while oncology is the major indication for the clinical candidates and in the literature Most macrocyclic drugs bind to targets that have difficult to drug binding sites. Natural products have provided 80-90% of the drugs and clinical candidates, whereas macrocycles in ChEMBL have less complex structures. Macrocycles usually reside in the beyond the Rule of 5 chemical space, but 30-40% of the drugs and clinical candidates are orally bioavailable. Simple bi-descriptor models, i.e., HBD ≤ 7 in combination with either MW < 1000 Da or cLogP > 2.5, distinguished orals from parenterals and can be used as filters in design. We propose that recent breakthroughs in conformational analysis and inspiration from natural products will further improve the de novo design of macrocycles.


Conflict of interest statement

The authors declare no competing financial interest.

Figures

Figure 1
Figure 1
Number of articles retrieved from PubMed each year using (A) “Macrocycle” as the keyword and (B) “Macrocycle and Drug Discovery” as keywords (last downloads May 2022). Some examples of macrocyclic drugs of natural product origin (bacitracin, dactinomycin, amphotericin B, and cyclosporin) and also some obtained by de novo design (simeprevir and lorlatinib), their therapeutic indication, and the year of their first report in the literature have been included.
Figure 2
Figure 2
Number of macrocyclic drugs plotted by their year of approval by the FDA (n = 67, data retrieved on September 1, 2022). (A) Orally absorbed drugs are indicated in blue (n = 26; 39%), while those administered parenterally are in gold (n = 41; 61%). (B) Natural products and derivatives thereof are presented in light green (n = 59, 88%); de novo designed macrocyclic drugs are in dark gray (n = 8, 12%). Contrast agents, macrocycle-conjugated antibodies, PEG-linked macrocycles, and cyclodextrins have been excluded.
Figure 3
Figure 3
Therapeutic indications (inner circle) and targets (outer circle) of the macrocyclic drugs approved by the FDA (n = 72). Five macrocycles are duplicated because each one is used for two therapeutic indications. Therapeutic indications treated by <4% of the total number of macrocyclic drugs have been grouped under “Other”. Targets separated by “and” indicate that the corresponding drug is a molecular glue, while targets separated by a comma indicate that the corresponding drug displays polypharmacology. NA: Target not available. A complete list of therapeutic indications and targets for the macrocyclic drugs is provided in Table S1.
Figure 4
Figure 4
(A) Classification of the shape of the binding sites in the crystalline complexes of macrocyclic drugs with their targets (n = 34). The number of drugs bound to each binding site class and their percentages of the total are given in parentheses. Examples of drug–target complexes in which the macrocycle binds to a pocket (B), flat (C), tunnel-shaped (D), or groove-shaped (E) binding site. The macrocyclic ligands are displayed as green sticks with nitrogen atoms in blue, oxygen in red, and sulfur in yellow. The selected examples are octreotide bound to the somatostatin receptor 2 (SSTR2, PDB ID: 7T11), simeprevir bound to the HCV NS3/4A protease (PDB ID: 3KEE), rifapentin bound to RNAP (PDB ID: 2A69), and lorlatinib bound in the groove of the ALK (PDB ID: 4CLI).
Figure 5
Figure 5
Normalized principal moments of inertia (PMI) plot illustrating (A) the shapes of the target-bound conformations of macrocyclic drugs bound to targets that have flat, groove, tunnel, or pocket-shaped binding sites (n = 31) compared to the shapes of a fully Ro5 compliant reference set of drugs (n = 37) and (B) the shape of the target-bound macrocyclic drugs, colored by the shape of their binding site. All four macrocycles that bind to a flat binding site are inhibitors of the NS3/4A protease of the hepatitis C virus.
Figure 6
Figure 6
Radar plot comparing the median values for the descriptors employed in Lipinski’s Ro5 and Veber’s rule for the oral (blue, n = 24) and parenteral (gold, n = 38) subsets of FDA-approved macrocyclic drugs. Note that HBD, HBA, and TPSA were calculated differently than in the original rules (cf. Methods).
Figure 7
Figure 7
Principal component analysis of the chemical space of the macrocyclic drugs data set (n = 53). The PCA was based on the descriptors of Lipinski’s and Veber’s rules, as well as cLogS, calculated at pH 7.0. Ellipses in blue and yellow shading show the 95% confidence intervals for orally and parenterally administered macrocycles, respectively. The centroid of each class is indicated with a large circle in the color of the respective class. The contributions of individual descriptors to the PCAs are indicated by the length of the arrows. The structures of three Ro5 compliant macrocycles (13), two analogues of cyclic peptide hormones (4 and 5), as well as cyclosporin (6) and voclosporin (7) are provided. Nine parenterals with MW > 1500 Da were excluded in the PCA to provide a better dissection of the chemical space of the orally bioavailable macrocycles (cf. Figure S4 for the PCA for the complete set of macrocycles (n = 62)).
Figure 8
Figure 8
Single-property distributions for HBD (A), TPSA (B), and NRotB (C) for the oral (blue) and parenteral (gold) subsets of the macrocyclic drugs training set (n = 62). The black dashed line indicates the intersection point of the density plot, and the derived cutoff value is given adjacent to the dashed line. The reliability of single-property models based on each of the three descriptors for the differentiation of oral and parenteral drugs in the training set is given by the Cohen’s kappa (κ) value.
Figure 9
Figure 9
Discrimination of orally bioavailable and parenterally administered (A) macrocyclic drugs and (B) an external test set of macrocycles not yet approved as drugs in bi-descriptor chemical space. Oral drugs are indicated by blue circles, while parenterals are in yellow. The filled circles have been jittered slightly to avoid overlap. The blue shading marks chemical space defined by HBD ≤ 7 and one of MW < 982 Da, cLogP > 2.22, or TPSA < 292 Å2. Some parenteral macrocycles are not included in the figures which have been truncated at HBD < 20, MW < 1500 Da, −5 < cLogP < 10, and TPSA < 600 Å2. Figure S7 includes all parenterals.
Figure 10
Figure 10
(A) Comparison of the number of HBDs in orally bioavailable macrocyclic drugs discovered by de novo design (n = 7) or from natural products (n = 17) for the charge state calculated at pH 7.0. Frequencies of HBDs originating from (B) amide moieties and (C) phenols and aliphatic alcohols (OH) in the two classes of drugs. The natural product class includes both original natural products and semisynthetic derivatives. Box plots show the 50th percentiles as horizontal bars, the 25th and 75th percentiles as boxes, and the 25th percentile minus 1.5× the interquartile range and the 75th percentile plus 1.5× the interquartile range as whiskers. Black dots represent values higher than 1.5× the interquartile range and less than 3× the interquartile range at either end of the box. Violin shapes represent the data density at each count value.
Figure 11
Figure 11
Therapeutic indications (inner circle) and targets (outer circle) for the macrocycles in clinical trials (n = 34). Therapeutic indications treated by only one clinical candidate (each 2.9%) have been grouped under “Other”. Targets with FDA-approved macrocyclic drugs have been marked with a red star, while a gray star indicates that the target is modulated by an approved nonmacrocyclic drug. Targets separated by “and” indicate that the corresponding drug is a molecular glue, while targets separated by a comma indicate that the corresponding drug displays polypharmacology. NA: Target not available. A complete list of therapeutic indications and targets for the macrocycles is clinical trials is available in Table S8.
Figure 12
Figure 12
(A) Principal component analysis of the chemical space of the clinical trials data set (n = 27). The PCA was based on the descriptors of Lipinski’s and Veber’s rules as well as cLogS calculated at pH 7.0. Five parenterals with MW > 1500 Da were excluded from the PCA to provide a better dissection of the chemical space of the orally bioavailable macrocycles [cf. Figure S13 for the PCA for the complete set of macrocycles (n = 32)]. Ellipses in blue and yellow shading show the 95% confidence intervals for orally and parenterally administered macrocycles, respectively. The centroid of each class is indicated with a large circle in the color of the respective class. The contributions of individual descriptors to the PCA are indicated by the length of the arrows. The structure of the oral outlier odalasvir (9) is provided. The structure of milvexian (8), which is close to the centroid of the oral class, is given for comparison. Avasopasem manganese and motexafin gadolinium were removed due to calculation errors with metals. (B) Radar plot comparing the median values for the descriptors employed in Lipinski’s Ro5 and Veber’s rule for the oral FDA-approved (light blue, n = 24) and clinical trial macrocyclic subsets (dark blue, n = 11). Note that HBD, HBA, and TPSA were calculated differently than in the original rules (cf. Methods).
Figure 13
Figure 13
Therapeutic indications (inner circle) and targets (outer circle) of the macrocycles reported in the articles published in 20 leading medicinal chemistry journals during 2005–2022 (n = 532). Therapeutic indications amounting to <2% of the entries have been grouped under “Other”. Less explored targets for each indication have been clustered as “Other”, with the number of unique targets provided in brackets. UNK denotes that the target is unknown or not reported. Targets with FDA-approved macrocyclic drugs have been marked with a red star, while an orange star indicates one or several clinical candidates toward the same target. A green star indicates that a clinical candidate is directed toward a novel target, i.e., a target not modulated by an existing drug. A star adjacent to “Other” may indicate one or several drugs or clinical candidates directed toward one or several targets (cf. Tables S1 and S8 for full details). Complete lists of articles reporting therapeutic indications and/or targets retrieved from the literature are provided as .csv files in the Supporting Information.
Figure 14
Figure 14
Principal component analysis comparing the chemical space of the macrocycles retrieved from ChEMBL (n = 28052, in gray) to (A) the macrocyclic drugs approved by the FDA (n = 62, in red) and the macrocycles (MC) undergoing clinical trials (CT) (n = 32, in green) and to (B) the combined oral (n = 35, in blue) and parenteral (n = 59, in yellow) parts of the drugs and clinical candidates data sets. The centroid of each class is indicated with a large circle in the color of the respective class. The PCA was based on the descriptors of Lipinski’s and Veber’s rules as well as cLogS, calculated at pH 7.0. The contributions of individual descriptors to the PCAs are indicated by the length of the arrows. PCAs for macrocycles with MW < 1500 Da are found in Figure S18. (C and E) Distribution of molecular weight (MW) and calculated lipophilicity (cLogP) for the macrocycles in the ChEMBL (n = 28 052, in gray), drug (n = 62, in red), and clinical candidates (n = 32, in green) data sets. (D and F) Distribution of molecular weight (MW) and calculated lipophilicity (cLogP) for the macrocycles in the ChEMBL data set (n = 28 052, in gray) and in the combined oral (n = 35, in blue) and parenteral (n = 59, in yellow) parts of the drugs and clinical candidate data sets. The median value for the descriptor is given in each panel and indicated by a dashed line.

References

    1. Blanco M. J.; Gardinier K. M. New Chemical Modalities and Strategic Thinking in Early Drug Discovery. ACS Med. Chem. Lett. 2020, 11 (3), 228–231. 10.1021/acsmedchemlett.9b00582. - DOI - PMC - PubMed
    1. Valeur E.; Guéret S. M.; Adihou H.; Gopalakrishnan R.; Lemurell M.; Waldmann H.; Grossmann T. N.; Plowright A. T. New Modalities for Challenging Targets in Drug Discovery. Angew. Chemie Int. Ed. 2017, 56 (35), 10294–10323. 10.1002/anie.201611914. - DOI - PubMed
    1. Doak B. C.; Over B.; Giordanetto F.; Kihlberg J. Oral Druggable Space beyond the Rule of 5: Insights from Drugs and Clinical Candidates. Chem. Biol. 2014, 21 (9), 1115–1142. 10.1016/j.chembiol.2014.08.013. - DOI - PubMed
    1. DeGoey D. A.; Chen H.-J.; Cox P. B.; Wendt M. D. Beyond the Rule of 5: Lessons Learned from AbbVie’s Drugs and Compound Collection. J. Med. Chem. 2018, 61 (7), 2636–2651. 10.1021/acs.jmedchem.7b00717. - DOI - PubMed
    1. Shultz M. D. Two Decades under the Influence of the Rule of Five and the Changing Properties of Approved Oral Drugs. J. Med. Chem. 2019, 62 (4), 1701–1714. 10.1021/acs.jmedchem.8b00686. - DOI - PubMed

Publication types

MeSH terms