. 2023 Apr 25;14(2):e0276422.
doi: 10.1128/mbio.02764-22. Epub 2023 Apr 5.

Intragranuloma Accumulation and Inflammatory Differentiation of Neutrophils Underlie Mycobacterial ESX-1-Dependent Immunopathology

Affiliations

Intragranuloma Accumulation and Inflammatory Differentiation of Neutrophils Underlie Mycobacterial ESX-1-Dependent Immunopathology

Julia Lienard et al. mBio. .

Abstract

The conserved ESX-1 type VII secretion system is a major virulence determinant of pathogenic mycobacteria, including Mycobacterium tuberculosis and Mycobacterium marinum. ESX-1 is known to interact with infected macrophages, but its potential roles in regulating other host cells and immunopathology have remained largely unexplored. Using a murine M. marinum infection model, we identify neutrophils and Ly6C+MHCII+ monocytes as the main cellular reservoirs for the bacteria. We show that ESX-1 promotes intragranuloma accumulation of neutrophils and that neutrophils have a previously unrecognized required role in executing ESX-1-mediated pathology. To explore if ESX-1 also regulates the function of recruited neutrophils, we performed a single-cell RNA-sequencing analysis that indicated that ESX-1 drives newly recruited uninfected neutrophils into an inflammatory phenotype via an extrinsic mechanism. In contrast, monocytes restricted the accumulation of neutrophils and immunopathology, demonstrating a major host-protective function for monocytes specifically by suppressing ESX-1-dependent neutrophilic inflammation. Inducible nitric oxide synthase (iNOS) activity was required for the suppressive mechanism, and we identified Ly6C+MHCII+ monocytes as the main iNOS-expressing cell type in the infected tissue. These results suggest that ESX-1 mediates immunopathology by promoting neutrophil accumulation and phenotypic differentiation in the infected tissue, and they demonstrate an antagonistic interplay between monocytes and neutrophils by which monocytes suppress host-detrimental neutrophilic inflammation. IMPORTANCE The ESX-1 type VII secretion system is required for virulence of pathogenic mycobacteria, including Mycobacterium tuberculosis. ESX-1 interacts with infected macrophages, but its potential roles in regulating other host cells and immunopathology have remained largely unexplored. We demonstrate that ESX-1 promotes immunopathology by driving intragranuloma accumulation of neutrophils, which upon arrival adopt an inflammatory phenotype in an ESX-1-dependent manner. In contrast, monocytes limited the accumulation of neutrophils and neutrophil-mediated pathology via an iNOS-dependent mechanism, suggesting a major host-protective function for monocytes specifically by restricting ESX-1-dependent neutrophilic inflammation. These findings provide insight into how ESX-1 promotes disease, and they reveal an antagonistic functional relationship between monocytes and neutrophils that might regulate immunopathology not only in mycobacterial infection but also in other infections as well as in inflammatory conditions and cancer.

Keywords: ESX-1 type VII secretion; granuloma; host-pathogen interactions; iNOS; immunopathology; monocytes; mycobacterial pathogenesis; neutrophils; single-cell RNA-seq.


Conflict of interest statement

The authors declare no conflict of interest.

Figures

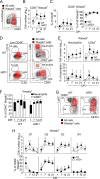
FIG 1
FIG 1
M. marinum drives neutrophilic inflammation in an ESX-1-dependent manner. Flow cytometry analysis of tail tissues from C57BL/6 mice infected with 5 × 10⁶ CFU of WT or ΔRD1 M. marinum or left uninfected (UI), as indicated. (A) Number of hematopoietic cells (CD45+). (B) Gating strategy defining neutrophils (Ly6G+CD11b+), monocyte-derived cells and macrophages (CD64+), and conventional dendritic cells (cDCs; CD64MHCII+CD11c+) in a UI mouse. (C) Quantification of data as defined in panel B. (D) Subdivision of CD64+ cells into gates 1 to 4 (G1 to G4) based on MHCII and Ly6C expression. (E) Number of cells within the G1 to G4 as defined in panel D. (F) Gating strategy to define B (CD19+) and T cells (TCRβ+CD4+ or CD8+). (G) Quantification of data as defined in panel F. (H) Relative abundance of each cell population among the 6 defined populations in panels B and F. DPI, days post infection. (A to H) Results (mean ± SD; n = 7 to 9 infected and 2 to 3 uninfected mice) from two independent experiments. Black asterisks indicate comparison between WT- and ΔRD1-infected mice. Gray asterisks indicate comparison between infected and UI mice. *, P < 0.05; **, P < 0.01; ***, P < 0.001; ****, P < 0.0001, by two-way ANOVA.
FIG 2
FIG 2
Neutrophils and Ly6C+MHCII+ monocytes are the main cellular reservoirs for M. marinum in the infected tissue. Flow cytometry analysis of tail tissues from C57BL/6 mice infected with 5 × 10⁶ CFU of Wasabi-expressing WT or ΔRD1 M. marinum. (A) Representative flow cytometry plot of Wasabi expression among all cells in a WT-infected mouse at 21 days postinfection (DPI). (B) Quantification of live CD45+Wasabi+ cells at indicated DPI as gated in panel A. (C) Proportion of Wasabi+CD45+ cells among total CD45+ cells (left) or among total Wasabi+ cells (right). (D) Representative flow cytometry plots of Wasabi+ cells in the hematopoietic compartment. Live CD45+CD19TCRβ cells were gated for analysis of Ly6G and CD64 expression. (E) Numbers of Wasabi+ neutrophils and CD64+ as indicated (top) and their corresponding proportion among total neutrophils or CD64+ cells (bottom). (F) Proportion of Wasabi+ neutrophils and CD64+ cells among total Wasabi+CD45+ cells. (G) Representative flow cytometry plot of Wasabi+ cells among the G1 to G4 subpopulations of CD64+ cells. (H) Numbers of Wasabi+ G1 to G4 populations (top) and their corresponding proportion among total Wasabi+CD64+ cells (bottom). (A to H) Results (mean ± SD; n = 7 to 9) from two independent experiments. *, P < 0.05; **, P < 0.01, by two-way ANOVA.
FIG 3
FIG 3
ESX-1 promotes localized neutrophil accumulation in the granuloma core region. Microscopy analysis of tail cross sections from C57BL/6 mice infected with 5 × 10⁷ CFU of Wasabi-expressing WT or ΔRD1 M. marinum at the indicated DPI. Immunofluorescence staining of Gr1+ neutrophils (red), CD64+ cells (blue), MPO+ cells (white), and Wasabi+ bacteria (green). Boxes, R1 and R2, indicate enlarged regions shown on the right. Scale bar = 200 μm on the left. Images were acquired using Z-stack acquisition with extended focus imaging (EFI) on an OLYMPUS VS-120 virtual slide microscope. R1, region 1; R2, region 2; B, bone; BM, bone marrow. Analysis performed on 2 to 3 tail cross sections per mouse (n = 3 mice per group per time point).
FIG 4
FIG 4
Neutrophils are required for M. marinum-induced pathology. Neutrophil depletion in C57BL/6 mice infected with 5 × 10⁷ CFU of Wasabi-expressing WT M. marinum. (A) Experimental setup for neutrophil depletion. Consecutive intraperitoneal injections of rat anti-mouse Ly6G (or isotype control) and mouse anti-rat kappa light chain monoclonal antibodies, as indicated. (B, E, and G) Flow cytometry analysis of tail tissues. (B) Neutrophil and CD64+ cell numbers (top) and their corresponding proportions among total CD45+ cells (bottom). (C) Visible tail lesions of representative mice at 21 DPI. (D) Cumulative length of visible tail lesions. (E) Numbers of Wasabi+ neutrophils and CD64+ cells (top) and their corresponding proportion among total neutrophils and CD64+ cells (bottom). (F) Proportion of Wasabi+CD45+ cells among total Wasabi+ cells. (G) Proportion of Wasabi+ neutrophils and CD64+ cells among total Wasabi+CD45+ cells. (H) Bacterial burden in the tail. (B, E, and G) Results (mean ± SD; n = 9 mice) from three independent experiments. (D) Results (n ≥ 21 mice) from three independent experiments. Bars indicate the mean for each group. (H) Results (n = 9 to 12 mice; two-tailed unpaired t test) from two independent experiments. Bars indicate the mean for each group. (B and D to F) *, P < 0.05; **, P < 0.01; ***, P < 0.001; ****, P < 0.0001, by two-way ANOVA.
FIG 5
FIG 5
ESX-1 drives differentiation of newly recruited uninfected neutrophils into a proinflammatory phenotype. Single-cell RNA-sequencing analysis of neutrophils sorted from tail tissues 14 DPI from C57BL/6 mice infected with 5× 10⁷ CFU of Wasabi-expressing WT or ΔRD1 M. marinum. Results are based on two independent experiments. (A) Experimental setup of the single cell RNA-seq analysis using the 10x Genomics approach. Infected (Wasabi+) and noninfected (Wasabi) neutrophils (Live CD45+Ly6G+CD11b+) were sorted (15,000 cells per analytical group) by FACS and single-cell RNA-seq was performed. (B) Louvain clusters at resolution 0.1 visualized on UMAP embedding. (C) RNA velocity estimates for neutrophils shown on UMAP embedding of full data set and colored by clustering from panel B. White arrow visualizes the overall direction of differentiation from origin. (D) UMAP embedding with Cxcr2 expression overlay. (E) UMAP plot from panel B split into individual analytical groups as indicated. (F) Cluster distribution for each analytical group in each of the two independent experiments performed. (G) Gene ontology (GO) analysis (Biological processes) of cluster 1 compared to all other clusters and ordered by the −log (P value). The first 15 GO terms are indicated as well as their corresponding fold-enrichment score on the heat map. (H) Violin plots of single-cell RNA expression level within clusters. Top 5 differentially expressed genes (DEGs) between cluster 1 (top row) or 0 (bottom row) and all other clusters, ordered by log fold change values. (I) Proportion of infected and uninfected bystander neutrophils in the infected tissue, as indicated. Results (mean; n = 7 to 9 mice) are from two independent experiments.
FIG 6
FIG 6
Monocytes are required to suppress neutrophil accumulation. CCR2+/− or CCR2−/− mice were infected with 5 × 10⁷ CFU of Wasabi-expressing WT M. marinum. Unless indicated, analyses were performed at 14 DPI. (A, B, and F to H) Flow cytometry analyses of tail tissues. (A) Numbers of CD64+ cells and neutrophils (top), as indicated, and their corresponding proportions among total CD45+ cells (bottom). (B) Numbers of G1 to G4 CD64+ cells (top) and their corresponding proportions among total CD45+ cells (bottom). (C) Visible tail lesions of representative infected mice. (D) Cumulative length of visible tail lesions. (E) Numbers of Wasabi+ neutrophils and CD64+ cells (top) and their corresponding proportion among total neutrophils and CD64+ cells (bottom). (F) Bacterial burden in the tail. (G) Proportion of Wasabi+CD45+ cells among total Wasabi+ cells. (H) Proportions of Wasabi+ neutrophils and CD64+ cells among total Wasabi+CD45+ cells. (A, B, F, and G) Results (n = 11 to 12 mice; two-tailed unpaired t or Mann-Whitney test) from three independent experiments. (D) Results (n = 11 to 12 mice; two-way ANOVA) from three independent experiments. (E) Results (n = 6 to 8 mice; two-tailed unpaired t test) from two independent experiments. (H) Results (mean ± SD; n = 11 to 12 mice per group) from three independent experiments. (A, B, and D to G) Bars indicate the mean for each group. *, P < 0.05; **, P < 0.01; ***, P < 0.001; ****, P < 0.0001.
FIG 7
FIG 7
iNOS activity in monocytes is required for their ability to suppress neutrophilic inflammation. C57BL/6 wild type (A to F and J to L), CCR2-RFP (G and H), and CCR2+/− or CCR2−/− (I) mice were infected with 5 × 10⁷ CFU of Wasabi-expressing WT or ΔRD1 M. marinum, as indicated. (A to H) Flow cytometry analysis of tail tissues at 14 DPI. (A and B) Representative FACS plots (A) and quantification of iNOS-positive CD64+ cells (B) as a percentage of all iNOS-positive cells in the tissue. (C and D) Representative FACS plots of iNOS expression in infected (Wasabi+) and uninfected (Wasabi) CD64+ cells (C) and the corresponding quantified data (D). (E) Representative FACS plots of iNOS+ expression in the G1 to G4 gates of CD64+ cells. (F) Proportion of iNOS+ G2 cells among total iNOS+ cells. (G and H) Representative FACS plots of CCR2-RFP+ and CD45+ expression among iNOS+ cells (G) and quantification of iNOS-positive CCR2-RFP+ cells (H) as a percentage of all iNOS-positive cells in the tissue. (I) RT-qPCR-based analysis of Nos2 mRNA expression in tail tissues of WT infected CCR2+/− or CCR2−/− mice at 14 DPI, as described in Materials and Methods. (J to L) Treatment with aminoguanidine (AG) in WT-infected C57BL/6 mice. (J) Cumulative length of visible tail lesions. (K) Neutrophils numbers in tail tissues. (L) Cumulative length of visible tail lesions in AG-treated mice with or without neutrophil depletion as indicated. (A to F) Results (mean ± SD; n = 12 to 13 mice; two-tailed Mann-Whitney test [B to F]; two-way ANOVA [D]) from two independent experiments. (G and H) Results (mean ± SD; n = 3 mice per group; two-tailed Mann-Whitney test). (I) Results (n = 5 to 8 mice; two-tailed Mann-Whitney test). (J) Results (n = 22 to 23 mice; two-way ANOVA) from two independent experiments. (K) Results (n = 11 mice; two-tailed unpaired t test) from two independent experiments. (L) Results for n = 9 to 12 mice (two-way ANOVA). (I to L) Bars indicate the mean for each group. *, P < 0.05; **, P < 0.01; ***, P < 0.001; ****, P < 0.0001; ns, not significant.

References

    1. Stinear TP, Seemann T, Harrison PF, Jenkin GA, Davies JK, Johnson PD, Abdellah Z, Arrowsmith C, Chillingworth T, Churcher C, Clarke K, Cronin A, Davis P, Goodhead I, Holroyd N, Jagels K, Lord A, Moule S, Mungall K, Norbertczak H, Quail MA, Rabbinowitsch E, Walker D, White B, Whitehead S, Small PL, Brosch R, Ramakrishnan L, Fischbach MA, Parkhill J, Cole ST. 2008. Insights from the complete genome sequence of Mycobacterium marinum on the evolution of Mycobacterium tuberculosis. Genome Res 18:729–741. doi:10.1101/gr.075069.107. - DOI - PMC - PubMed
    1. Gao LY, Guo S, McLaughlin B, Morisaki H, Engel JN, Brown EJ. 2004. A mycobacterial virulence gene cluster extending RD1 is required for cytolysis, bacterial spreading and ESAT-6 secretion. Mol Microbiol 53:1677–1693. doi:10.1111/j.1365-2958.2004.04261.x. - DOI - PubMed
    1. Stanley SA, Raghavan S, Hwang WW, Cox JS. 2003. Acute infection and macrophage subversion by Mycobacterium tuberculosis require a specialized secretion system. Proc Natl Acad Sci USA 100:13001–13006. doi:10.1073/pnas.2235593100. - DOI - PMC - PubMed
    1. Lienard J, Nobs E, Lovins V, Movert E, Valfridsson C, Carlsson F. 2020. The Mycobacterium marinum ESX-1 system mediates phagosomal permeabilization and type I interferon production via separable mechanisms. Proc Natl Acad Sci USA 117:1160–1166. doi:10.1073/pnas.1911646117. - DOI - PMC - PubMed
    1. Wassermann R, Gulen MF, Sala C, Perin SG, Lou Y, Rybniker J, Schmid-Burgk JL, Schmidt T, Hornung V, Cole ST, Ablasser A. 2015. Mycobacterium tuberculosis differentially activates cGAS- and inflammasome-dependent intracellular immune responses through ESX-1. Cell Host Microbe 17:799–810. doi:10.1016/j.chom.2015.05.003. - DOI - PubMed

Publication types

Substances